

QTL mapping and identification of candidate genes linked to red rot resistance in sugarcane
- PMID: 36778768
- PMCID: PMC9911584
- DOI: 10.1007/s13205-023-03481-7
QTL mapping and identification of candidate genes linked to red rot resistance in sugarcane
Abstract
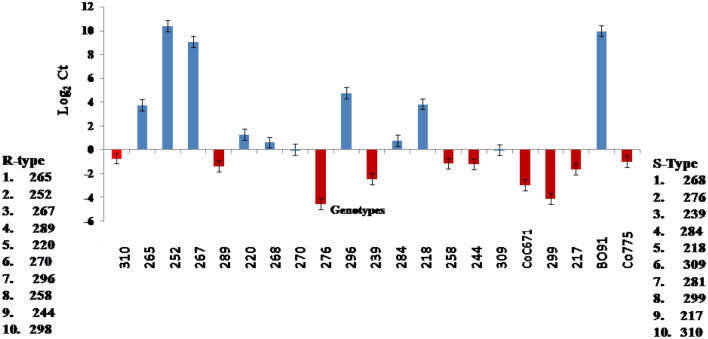
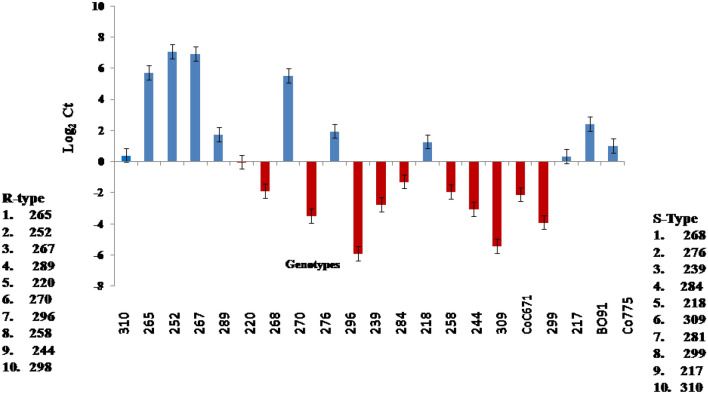
Sugarcane (Saccharum species hybrid) is one of the most important commercial crops cultivated worldwide for products like white sugar, bagasse, ethanol, etc. Red rot is a major sugarcane disease caused by a hemi-biotrophic fungus, Colletotrichum falcatum Went., which can potentially cause a reduction in yield up to 100%. Breeding for red rot-resistant sugarcane varieties has become cumbersome due to its complex genome and frequent generation of new pathotypes of red rot fungus. In the present study, a genetic linkage map was developed using a selfed population of a popular sugarcane variety CoS 96268. A QTL linked to red rot resistance (qREDROT) was identified, which explained 26% of the total phenotypic variation for the trait. A genotype-phenotype network analysis performed to account for epistatic interactions, identified the key markers involved in red rot resistance. The differential expression of the genes located in the genomic region between the two flanking markers of the qREDROT as well as in the vicinity of the markers identified through the genotype-phenotype network analysis in a set of contrasting genotypes for red rot infection further confirmed the mapping results. Further, the expression analysis revealed that the plant defense-related gene coding 26S protease regulatory subunit is strongly associated with the red rot resistance. The findings can help in the screening of disease resistant genotypes for developing red rot-resistant varieties of sugarcane.
Supplementary information: The online version contains supplementary material available at 10.1007/s13205-023-03481-7.
Keywords: Linkage mapping; Marker-aided selection; QTL; Red rot; Sugarcane.
© King Abdulaziz City for Science and Technology 2023, Springer Nature or its licensor (e.g. a society or other partner) holds exclusive rights to this article under a publishing agreement with the author(s) or other rightsholder(s); author self-archiving of the accepted manuscript version of this article is solely governed by the terms of such publishing agreement and applicable law.
Conflict of interest statement
Conflict of interestThe authors declare that they have no conflict of interest in the publication.
Figures


Similar articles
-
Combining genomic selection with genome-wide association analysis identified a large-effect QTL and improved selection for red rot resistance in sugarcane.Front Plant Sci. 2022 Oct 31;13:1021182. doi: 10.3389/fpls.2022.1021182. eCollection 2022. Front Plant Sci. 2022. PMID: 36388469 Free PMC article.
-
Identification of putative candidate genes for red rot resistance in sugarcane (Saccharum species hybrid) using LD-based association mapping.Mol Genet Genomics. 2016 Jun;291(3):1363-77. doi: 10.1007/s00438-016-1190-3. Epub 2016 Mar 9. Mol Genet Genomics. 2016. PMID: 26961118
-
Differential regulation of defense-related gene expression in response to red rot pathogen Colletotrichum falcatum infection in sugarcane.Appl Biochem Biotechnol. 2013 Sep;171(2):488-503. doi: 10.1007/s12010-013-0346-4. Epub 2013 Jul 17. Appl Biochem Biotechnol. 2013. PMID: 23861092
-
Genes tagging and molecular diversity of red rot susceptible/tolerant sugarcane hybrids using c-DNA and unigene derived markers.World J Microbiol Biotechnol. 2012 Apr;28(4):1669-79. doi: 10.1007/s11274-011-0974-1. Epub 2011 Dec 16. World J Microbiol Biotechnol. 2012. PMID: 22805949
-
Molecular Characterization and Pathogenicity of Colletotrichum falcatum Causing Red Rot on Sugarcane in Southern Florida.J Fungi (Basel). 2024 Oct 27;10(11):742. doi: 10.3390/jof10110742. J Fungi (Basel). 2024. PMID: 39590662 Free PMC article.
References
-
- Abdelkhalek A, Elmorsi A, Alshehaby O, Mishra NS, Hafez E. Identification of genes differentially expressed in onion infected with Iris yellow spot virus. Phytopathol Mediterr. 2018;57:334–340.
-
- Aitken KS, Jackson PA, McIntyre CL. A combination of AFLP and SSR markers provides extensive map coverage and identification of homo(eo)logous linkage groups in a sugarcane cultivar. Theor Appl Genet. 2005;110(5):789–801. - PubMed
-
- Aitken KS, Jackson PA, McIntyre CL. Quantitative trait loci identified for sugar related traits in a sugarcane (Saccharum spp.) cultivar × Saccharum officinarum population. Theor Appl Genet. 2006;112(7):1306–1317. - PubMed
-
- Aitken K, Li J, Wang L, Qing C, Fan YH, Jackson P. Characterization of intergeneric hybrids of Erianthus rockii and Saccharum using molecular markers. Genet Resour Crop Evol. 2007;54(7):1395–1405.
-
- Aitken KS, Hermann S, Karno K, Bonnett GD, McIntyre LC, Jackson PA. Genetic control of yield related stalk traits in sugarcane. Theor Appl Genet. 2008;117(7):1191–1203. - PubMed
LinkOut - more resources
Full Text Sources
