. 2023 Jan 27:14:1105330.
doi: 10.3389/fmicb.2023.1105330. eCollection 2023.

Dynamic changes in fecal microbiota in donkey foals during weaning: From pre-weaning to post-weaning

Affiliations

Dynamic changes in fecal microbiota in donkey foals during weaning: From pre-weaning to post-weaning

Zhenwei Zhang et al. Front Microbiol. .

Abstract

Introduction: A better understanding of the microbiota community in donkey foals during the weaning transition is a prerequisite to optimize gut function and improve feed efficiency. The objective of the present study was to investigate the dynamic changes in fecal microbiota in donkey foals from pre-to post-weaning period.

Methods: A total of 27 fecal samples of donkey foals were collected in the rectum before morning feeding at pre-weaning (30 days of age, PreW group, n = 9), dur-weaning (100 days of age, DurW group, n = 9) and post-weaning (170 days of age, PostW group, n = 9) period. The 16S rRNA amplicon sequencing were employed to indicate the microbial changes during the weaning period.

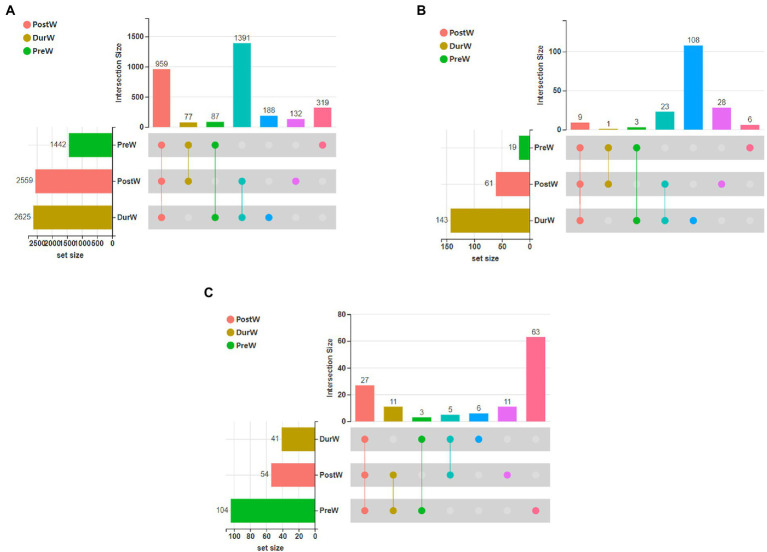
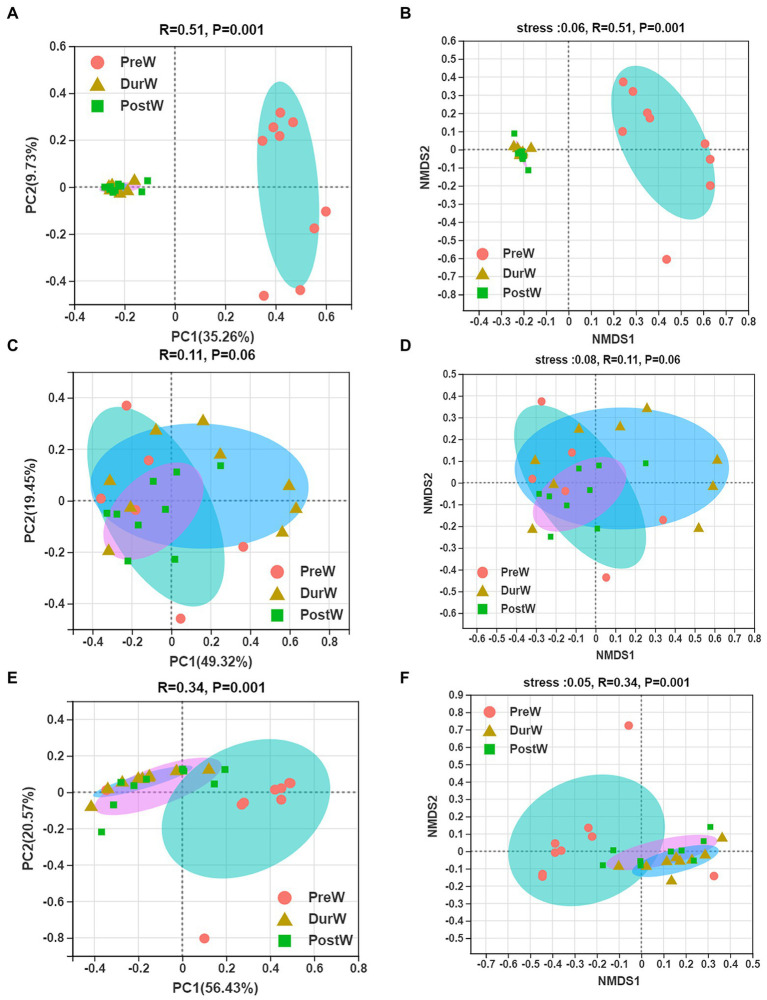
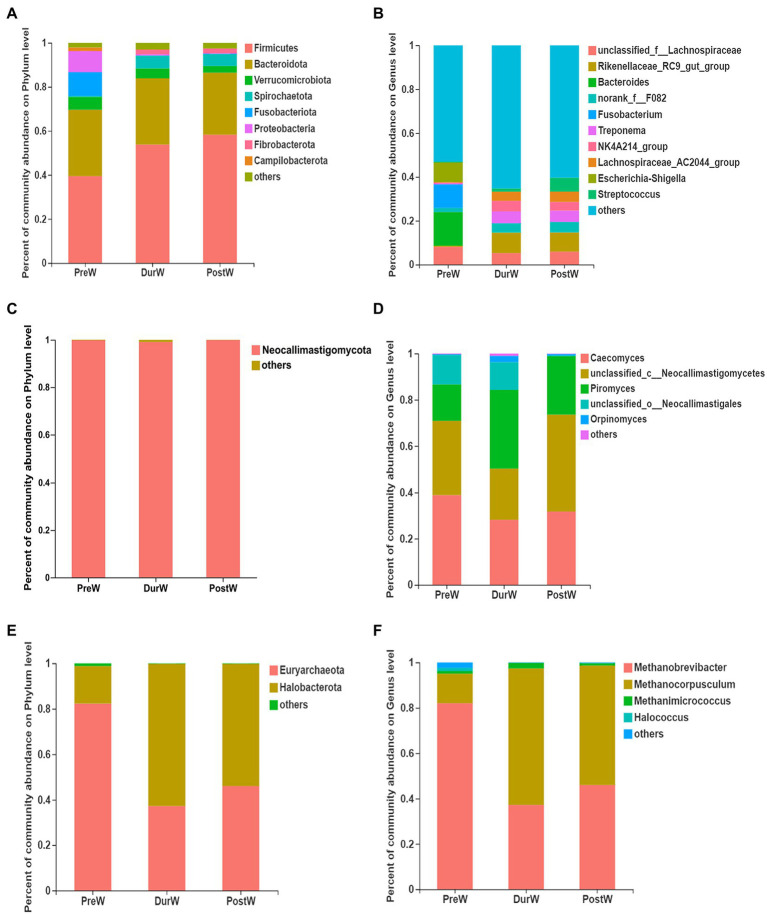
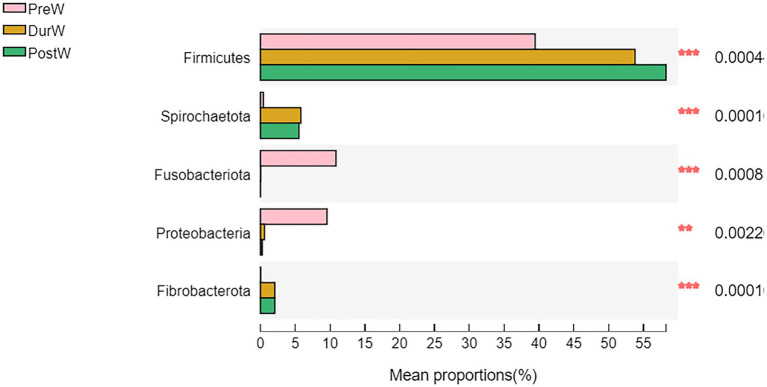
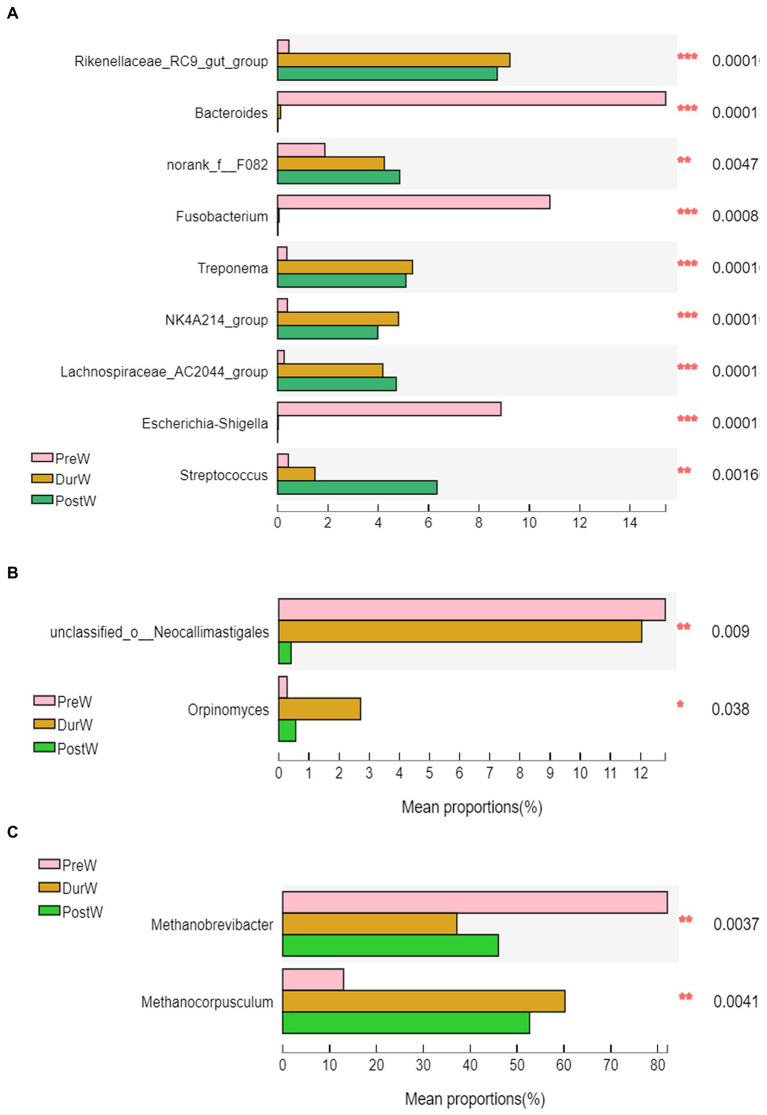
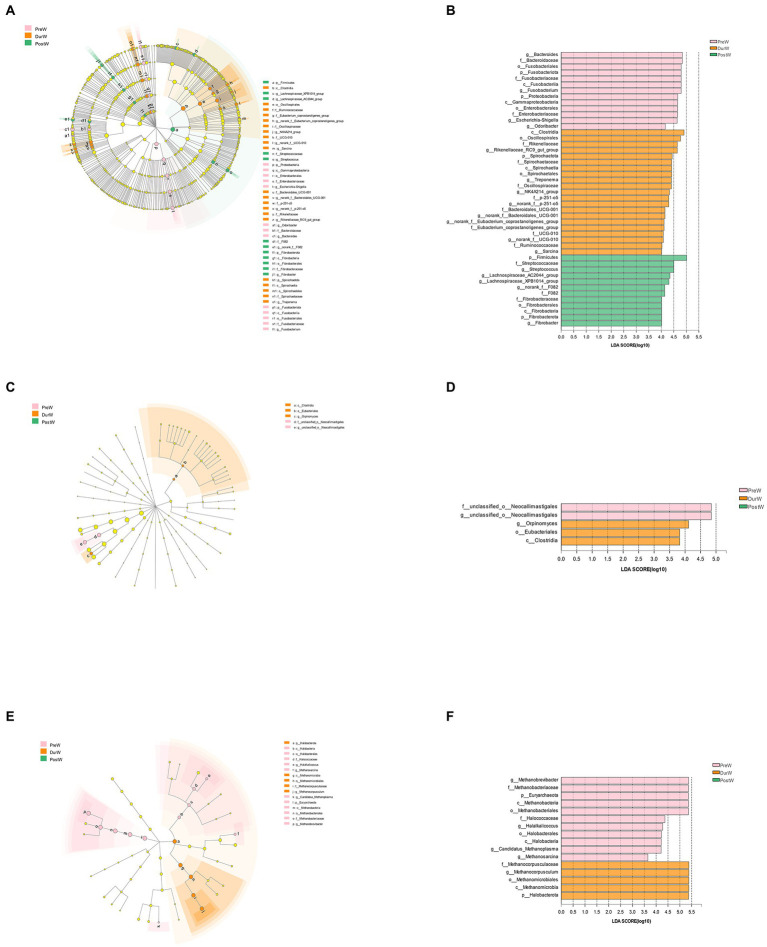
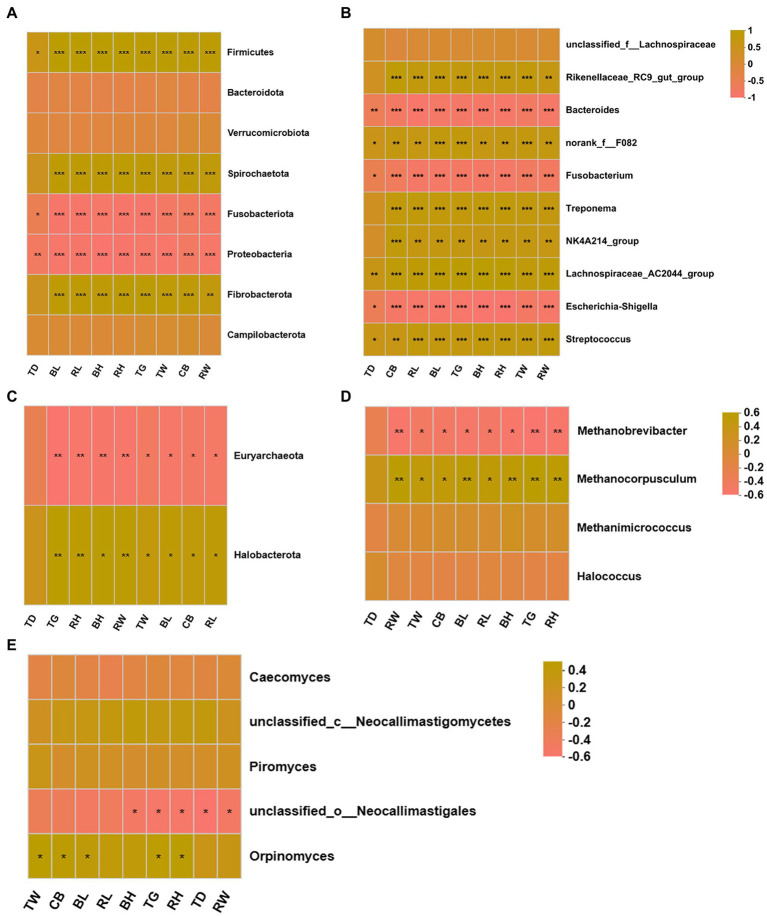
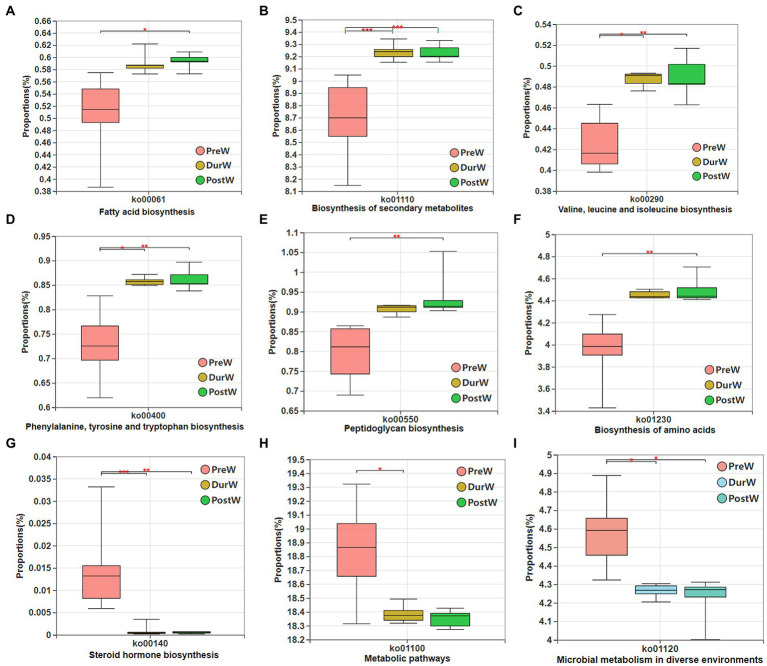
Results: In the present study, the cessation of breastfeeding gradually and weaning onto plant-based feeds increased the microbial diversity and richness, with a higher Shannon, Ace, Chao and Sobs index in DurW and PostW than in PreW (p < 0.05). The predominant bacterial phyla in donkey foal feces were Firmicutes (>50.5%) and Bacteroidota (>29.5%), and the predominant anaerobic fungi and archaea were Neocallimastigomycota and Euryarchaeota. The cellulolytic related bacteria including phylum Firmicutes, Spirochaetota and Fibrobacterota and genus norank_f_F082, Treponema, NK4A214_group, Lachnospiraceae_AC2044_group and Streptococcus were increased from pre-to post-weaning donkey foals (p < 0.05). Meanwhile, the functions related to the fatty acid biosynthesis, carbohydrate metabolism and amino acid biosynthesis were significantly enriched in the fecal microbiome in the DurW and PostW donkeys. Furthermore, the present study provided the first direct evidence that the initial colonization and establishment of anaerobic fungi and archaea in donkey foals began prior to weaning. The relative abundance of Orpinomyces were the highest in DurW donkey foals among the three groups (p < 0.01). In terms of archaea, the abundance of Methanobrevibacter were higher in PreW than in DurW and PostW (p < 0.01), but the abundance of Methanocorpusculum were significantly increased in DurW and PostW compared to PreW donkey foals (p < 0.01).

Discussion: Altogether, the current study contributes to a comprehensive understanding of the development of the microbiota community in donkey foals from pre-to post-weaning period, which may eventually result in an improvement of the digestion and feed efficiency in donkeys.

Keywords: anaerobic fungi; archaea; bacteria; donkey foal; fecal microbiota; weaning.


Conflict of interest statement

The authors declare that the research was conducted in the absence of any commercial or financial relationships that could be construed as a potential conflict of interest.

Figures

Figure 1
Figure 1
The UpSet Venn diagram presenting the distribution of microbial bacterial (A), anaerobic fungi (B), and archaeal (C) community OTUs among different groups. PreW, pre-weaning donkeys; DurW, during weaning donkeys; PostW, post-weaning donkeys.
Figure 2
Figure 2
Principal co-ordinates analysis (PCoA) and Nonmetric multidimensional scaling analysis (NMDS) of microbial community composition among different groups. (A) The PCoA analysis of bacteria. (B) The NMDS analysis of bacteria. (C) The PCoA analysis of anaerobic fungi. (D) The NMDS analysis of anaerobic fungi. (E) The PCoA analysis of archaea. (F) The NMDS analysis of archaea; PreW, pre-weaning donkeys; DurW, during weaning donkeys; PostW, post-weaning donkeys.
Figure 3
Figure 3
Composition of the predominant microbiota among different groups (accounting for ≥0.01% of the total sequences in at least one samples). (A) The predominant bacteria at phylum level. (B) The predominant bacteria at genus level. (C) The predominant anaerobic fungi at phylum level. (D) The predominant anaerobic fungi at genus level. (E) The predominant archaea at phylum level. (F) The predominant archaea at genus level; PreW, pre-weaning donkeys; DurW, during weaning donkeys; PostW, post-weaning donkeys.
Figure 4
Figure 4
Difference of the predominant microbiota at phylum level among different groups (abundance of the microbiota is expressed as a percentage). PreW, pre-weaning donkeys; DurW, during weaning donkeys; PostW, post-weaning donkeys; **p < 0.05; ***p < 0.01.
Figure 5
Figure 5
Difference of the predominant microbiota at genus level among different groups (abundance of the microbiota is expressed as a percentage). (A) The different bacteria. (B) The different anaerobic fungi. (C) The different archaea; PreW, pre-weaning donkeys; DurW, during weaning donkeys; PostW, post-weaning donkeys; *p < 0.05; **p < 0.01, ***p<0.001.
Figure 6
Figure 6
The LEfSe analysis showed the biomarkers of the microbial community in donkey foals during weaning period. The cladogram indicating the differences in relative abundance of taxa among PreW, DurW, and PostW groups; and the bar column shows the microbial taxa with significant differences among three groups (LDA score > 3). The length of the bar column represents the LDA score. (A) The cladogram of bacteria. (B) The LDA plot of bacteria. (C) The cladogram of anaerobic fungi. (D) The LDA plot of anaerobic fungi. (E) The cladogram of archaea. (F) The LDA plot of archaea; PreW, pre-weaning donkeys; DurW, during weaning donkeys; PostW, post-weaning donkeys.
Figure 7
Figure 7
Co-occurrence network analysis on microbiota among different groups. (A) The network analysis of bacteria. (B) The network analysis of anaerobic fungi. (C) The network analysis of archaea; PreW, pre-weaning donkeys; DurW, during weaning donkeys; PostW, post-weaning donkeys.
Figure 8
Figure 8
Correlation heatmap of differentially donkey fecal microbiota and body measurements. Each row in the graph represents a microbiota phylum/genus, each column represents a body measurement, the color in the graph indicates the Pearson coefficient between the microbial phylum/genus and donkey body measurements, and the brick yellow indicates positive correlation. The pale pink is representative negative correlation. The darker color indicate the greater the correlation. (A) Between donkey body measurements and bacteria at phylum level. (B) Between donkey body measurements and bacteria at genus level. (C) Between donkey body measurements and anaerobic fungi at phylum level. (D) Between donkey body measurements and anaerobic fungi at genus level. (E) Between donkey body measurements and archaea at genus level. *p < 0.05; **p<0.01; ***p<0.001. BH, body height; BL, body length; TG, thoracic girth; TD, thoracic depth; TW, thoracic width; RH, rump height; RL, rump length; RW, rump width; CB, circumference of cannon bone.
Figure 9
Figure 9
Variations in composition of bacterial KEGG metabolic pathways inferred by PICRUSt. KEGG, Kyoto Encyclopedia of Genes and Genomes; PICRUSt, the phylogenetic investigation of communities by reconstruction of unobserved states; PreW, pre-weaning donkeys; DurW, during weaning donkeys; PostW, post-weaning donkeys. *p < 0.05; **p<0.01; ***p<0.001.
Figure 10
Figure 10
Variations in composition of anaerobic fungi functional groups inferred by FUNGuild. FUNGuild, fungi functional guild; PreW, pre-weaning donkeys; DurW, during weaning donkeys; PostW, post-weaning donkeys.

Similar articles

Cited by

References

    1. Caporaso J. G., Bittinger K., Bushman F. D., DeSantis T. Z., Andersen G. L., Knight R. (2010). PYNAST: a flexible tool for aligning sequences to a template alignment. Bioinformatics 26, 266–267. doi: 10.1093/bioinformatics/btp636, PMID: - DOI - PMC - PubMed
    1. Chanter N., Hall G. A., Bland A. P., Hayle A. J., Parsons K. R. (1986). Dysentery in calves caused by an atypical strain of Escherichia coli (S102-9). Vet. Microbiol. 12, 241–253. doi: 10.1016/0378-1135(86)90053-2, PMID: - DOI - PMC - PubMed
    1. Cui Y., Liu H., Gao Z., Xu J., Liu B., Guo M., et al. . (2022). Whole-plant corn silage improves rumen fermentation and growth performance of beef cattle by altering rumen microbiota. Appl. Microbiol. Biotechnol. 106, 4187–4198. doi: 10.1007/s00253-022-11956-5, PMID: - DOI - PubMed
    1. Dougal K., Harris P. A., Edwards A., Pachebat J. A., Blackmore T. M., Worgan H. J., et al. . (2012). A comparison of the microbiome and the metabolome of different regions of the equine hindgut. FEMS Microbiol. Ecol. 82, 642–652. doi: 10.1111/j.1574-6941.2012.01441.x, PMID: - DOI - PubMed
    1. Edwards J. E., Shetty S. A., van den Berg P., Burden F., van Doorn D. A., Pellikaan W. F., et al. . (2020). Multi-kingdom characterization of the core equine fecal microbiota based on multiple equine (sub) species. Anim. Microbiome 2:6. doi: 10.1186/s42523-020-0023-1, PMID: - DOI - PMC - PubMed