Can a present-day thermal niche be preserved in a warming climate by a shift in phenology? A case study with sea turtles
- PMID: 36778962
- PMCID: PMC9905989
- DOI: 10.1098/rsos.221002
Can a present-day thermal niche be preserved in a warming climate by a shift in phenology? A case study with sea turtles
Abstract
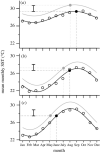
How species respond to climate change may impact their extinction probability. Here we link climatology and ecology to tackle a globally important conservation question. For sea turtles, there are concerns that climate warming will cause both the feminization of populations as well as reduced hatchling survival. For 58 nesting sites across the world spanning all seven sea turtle species, we investigated whether warming might be avoided by shifts in nesting phenology to a cooler part of the year. We show that even with the most extreme phenological shift that has been reported to date-an 18-day advance in nesting per °C increase in sea surface temperature (SST)-temperatures will continue to increase at nesting sites with climate warming. We estimate that SST at nesting sites will rise by an average of 0.6°C (standard deviation = 0.9°C, n = 58) when we model a 1.5°C rise in SST combined with a best-case-scenario shift in nesting. Since sea turtles exhibit temperature-dependent sex determination, these temperature rises could lead to increasingly female-biased sex ratios as well as reduced hatchling production at sites across the world. These findings underscore concerns for the long-term survival of this iconic group.
Keywords: climate change adaptation; climatology; conservation; endangered species; marine turtles.
© 2023 The Authors.
Conflict of interest statement
The authors declare no conflict.
Figures


Similar articles
-
Adaptation of sea turtles to climate warming: Will phenological responses be sufficient to counteract changes in reproductive output?Glob Chang Biol. 2024 Jan;30(1):e16991. doi: 10.1111/gcb.16991. Epub 2023 Oct 31. Glob Chang Biol. 2024. PMID: 37905464
-
Climate warming and sea turtle sex ratios across the globe.Glob Chang Biol. 2024 Jan;30(1):e17004. doi: 10.1111/gcb.17004. Epub 2023 Nov 14. Glob Chang Biol. 2024. PMID: 37961789
-
Climate change resilience of a globally important sea turtle nesting population.Glob Chang Biol. 2019 Feb;25(2):522-535. doi: 10.1111/gcb.14520. Epub 2018 Dec 19. Glob Chang Biol. 2019. PMID: 30567014
-
Temperature-Dependent Sex Determination in Sea Turtles in the Context of Climate Change: Uncovering the Adaptive Significance.Bioessays. 2020 Nov;42(11):e2000146. doi: 10.1002/bies.202000146. Epub 2020 Sep 8. Bioessays. 2020. PMID: 32896903 Review.
-
A roadmap for multiple paternity research with sea turtles.Adv Mar Biol. 2024;97:123-133. doi: 10.1016/bs.amb.2024.07.002. Epub 2024 Aug 3. Adv Mar Biol. 2024. PMID: 39307555 Review.
Cited by
-
Individual plasticity in response to rising sea temperatures contributes to an advancement in green turtle nesting phenology.Proc Biol Sci. 2025 Feb;292(2041):20241809. doi: 10.1098/rspb.2024.1809. Epub 2025 Feb 19. Proc Biol Sci. 2025. PMID: 39968614 Free PMC article.
-
Global assessment of current extinction risks and future challenges for turtles and tortoises.Nat Commun. 2025 Aug 2;16(1):7114. doi: 10.1038/s41467-025-62441-2. Nat Commun. 2025. PMID: 40753074 Free PMC article.
-
Responsiveness to cold snaps by turtle embryos depends on exposure timing and duration.Proc Biol Sci. 2025 Jan;292(2038):20242445. doi: 10.1098/rspb.2024.2445. Epub 2025 Jan 15. Proc Biol Sci. 2025. PMID: 39809316 Free PMC article.
-
Distribution of global sea turtle nesting explained from regional-scale coastal characteristics.Sci Rep. 2024 Jan 8;14(1):752. doi: 10.1038/s41598-023-50239-5. Sci Rep. 2024. PMID: 38191897 Free PMC article.
-
Temperature Conditions in Artificial Sea Turtle Nests: Toward Optimized Hatchery Management.Ecol Evol. 2025 Jul 9;15(7):e71750. doi: 10.1002/ece3.71750. eCollection 2025 Jul. Ecol Evol. 2025. PMID: 40641480 Free PMC article.
References
-
- Parmesan C, et al. 1999. Poleward shifts in geographical ranges of butterfly species associated with regional warming. Nature 399, 579-583. (10.1038/21181) - DOI
Associated data
LinkOut - more resources
Full Text Sources

