. 2022 Aug 10;2(8):100167.
doi: 10.1016/j.xgen.2022.100167.

CNest: A novel copy number association discovery method uncovers 862 new associations from 200,629 whole-exome sequence datasets in the UK Biobank

Affiliations

CNest: A novel copy number association discovery method uncovers 862 new associations from 200,629 whole-exome sequence datasets in the UK Biobank

Tomas Fitzgerald et al. Cell Genom. .

Abstract

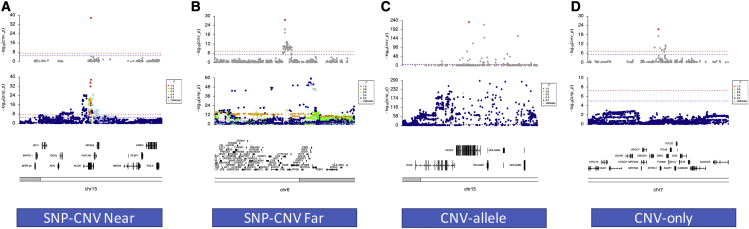
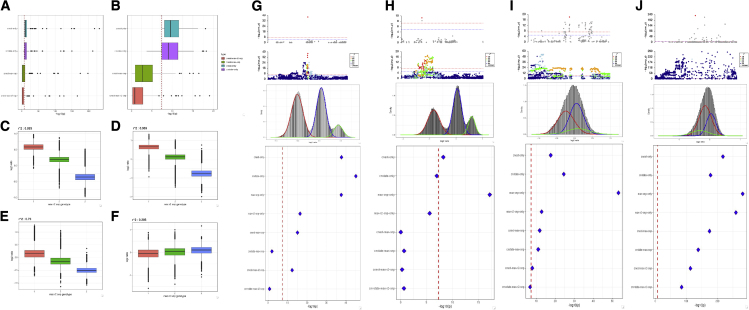
Copy number variation (CNV) is known to influence human traits, having a rich history of research into common and rare genetic disease, and although CNV is accepted as an important class of genomic variation, progress on copy-number-based genome-wide association studies (GWASs) from next-generation sequencing (NGS) data has been limited. Here we present a novel method for large-scale copy number analysis from NGS data generating robust copy number estimates and allowing copy number GWASs (CN-GWASs) to be performed genome-wide in discovery mode. We provide a detailed analysis in the UK Biobank resource and a specifically designed software package. We use these methods to perform CN-GWAS analysis across 78 human traits, discovering over 800 genetic associations that are likely to contribute strongly to trait distributions. Finally, we compare CNV and SNP association signals across the same traits and samples, defining specific CNV association classes.

Keywords: copy number variation; genome-wide association studies; next-generation sequencing; whole-exome sequencing.


Conflict of interest statement

The authors declare no competing interests.

Figures

None
Graphical abstract
Figure 1
Figure 1
QC of CNV calls in the 200,629 UK Biobank exome sequences (A) Gender classification, the relative coverage of autosomes compared with chromosome X and the CNest gender classifications shown in different colors across all samples. (B) The total number of autosomal CNV calls versus a measure of the proportion of rare CNVs per sample using a 1% population frequency. (C) The log10 of the loss to gain ratio versus log10 of the total number of CNV calls for each sample. (D) A density plot showing (B) but for QC-passed samples only.
Figure 2
Figure 2
Copy number association Manhattan plots for four different UK Biobank traits Exon-level signals are shown in different shades of gray and CNV call level signals in orange and green. (A–D) Associations for (A) hair color using a linear model, (B) associations for standing height using a linear model, (C) associations for disease coding asthma using a logistic model, (D) associations for disease coding myocardial infarction using a logistic model. (E) Zoom locus plot showing chr15 around the OCA2/HERC2 genes for hair color signal. (F) Zoom locus plot showing chr15 around the ADAMTSL3/UBE2Q2L/GOLGA6L4 genes for standing height signal. (G) Zoom locus plot showing chr2 around the genes CHROMR, PRKRA, and PJVK for asthma signal. (H) Zoom locus plot showing chr6 around the LPA gene for myocardial infarction signal.
Figure 3
Figure 3
ICD10 code case/control copy number associations (A) Combined and overlaid Manhattan plot for CNV associations across 44 ICD10 codes. (B) Combined QQ plot including all p values from association results across all 44 traits. (C) Overlaid QQ plots showing all individual QQ plots for the 44 traits. (D) Plot showing the total number of exons for all ICD10 codes that had any significant signal. (E) Locus zoom plot at UGT1A genes for ICD10 code E80 (disorders of porphyrin and bilirubin metabolism). (F) Locus zoom plot at the PRSS1 gene for ICD10 code D50 (iron deficiency anemia). (G) Locus zoom plot at the SLC2A9 gene for ICD10 code M10 (gout). (H) Locus zoom plot at the RHD and RHCE genes for ICD10 code O 36 (maternal care for known or suspected fetal problems). (I) Locus zoom plot at the PNPLA3 gene for ICD10 code K74 (fibrosis and cirrhosis of liver).
Figure 4
Figure 4
Locus zoom plots showing SNP and CNV association results for the different CNV association type classifications for four different quantitative traits (A) SNP-CNV near association plot for standing height at ACAN. (B) SNP-CNV far association plot for FEV/FEC ratio at C4A. (C) CNV-allele association plot for hair color at HERC2. (D) CNV-only association plot for chronotype at SPDYE1.
Figure 5
Figure 5
Competitive models for CNV and SNPs using copy number estimates, copy number genotypes, and joint models including SNP genotypes from the most highly correlated SNP or the SNP with the highest association signal for the same trait within 1 Mb (A) Minus log10 p values for four different models: CNest only, copy number estimates only; cnstate only, copy number genotypes (three-component mixture model) only; CNest-max-snp, joint model with copy number estimates and the SNP with the highest association signal for the same trait within 1 Mb; CNest-max-r2-snp, joint model with copy number estimates and the most highly correlated SNP within 1 Mb. (B) Zoomed in view of (A) restricting the x axis to a maximum −log10 p value of 20. (C–F) SNP genotypes from the most highly correlated SNP against the copy number estimate (log2 ratio) for four individual exon-level association signals, further details of which are shown in (G)–(J). (G–J) Finer-grain details for joint models of four exon-level copy number association signals; top panel shows the copy number estimate association signal with the lead exon highlighted in red, second panel shows the SNP genotypes association signal from SNP GWAS tests in the same samples and trait colored by the r2 of SNP genotypes against the lead exon signal from the copy number GWAS (CN-GWAS), the third panel shows the copy number estimate (log2 ratio) of the lead exon association from the CN-GWAS fitted using a three-component mixture model to define copy number genotypes, and the fourth panel shows the −log10 p value from eight different types of association model: cnstate-only, cnstate-only, max-snp-only, max-r2-snp-only, CNest-max-snp, cnstate-max-snp, CNest-max-r2-snp, and cnstate-max-r2-snp.

Similar articles

Cited by

References

    1. Wellcome Trust Case Control Consortium Genome-wide association study of 14, 000 cases of seven common diseases and 3, 000 shared controls. Nature. 2007;447:661–678. - PMC - PubMed
    1. MacArthur J., Bowler E., Cerezo M., Gil L., Hall P., Hastings E., Junkins H., McMahon A., Milano A., Morales J., et al. The new NHGRI-EBI Catalog of published genome-wide association studies (GWAS Catalog) Nucleic Acids Res. 2017;45:D896–D901. - PMC - PubMed
    1. Lee J.J., Wedow R., Okbay A., Kong E., Maghzian O., Zacher M., Nguyen-Viet T.A., Bowers P., Sidorenko J., Karlsson Linnér R., et al. Gene discovery and polygenic prediction from a genome-wide association study of educational attainment in 1.1 million individuals. Nat. Genet. 2018;50:1112–1121. - PMC - PubMed
    1. Purcell S., Neale B., Todd-Brown K., Thomas L., Ferreira M.A.R., Bender D., Maller J., Sklar P., de Bakker P.I.W., Daly M.J., Sham P.C. PLINK: a tool set for whole-genome association and population-based linkage analyses. Am. J. Hum. Genet. 2007;81:559–575. - PMC - PubMed
    1. Smith S.M., Douaud G., Chen W., Hanayik T., Alfaro-Almagro F., Sharp K., Elliott L.T. An expanded set of genome-wide association studies of brain imaging phenotypes in UK Biobank. Nat. Neurosci. 2021;24:737–745. - PMC - PubMed

LinkOut - more resources