. 2023 Aug;19(8):2240-2256.
doi: 10.1080/15548627.2023.2179781. Epub 2023 Feb 24.

Narirutin activates TFEB (transcription factor EB) to protect against Acetaminophen-induced liver injury by targeting PPP3/calcineurin

Affiliations

Narirutin activates TFEB (transcription factor EB) to protect against Acetaminophen-induced liver injury by targeting PPP3/calcineurin

Zhiyuan Fang et al. Autophagy. 2023 Aug.

Abstract

Acetaminophen (APAP) overdose is the predominant cause of drug-induced liver injury worldwide. The macroautophagy/autophagy-lysosomal pathway (ALP) is involved in the APAP hepatotoxicity. TFEB (transcription factor EB) promotes the expression of genes related to autophagy and lysosomal biogenesis, thus, pharmacological activation of TFEB-mediated ALP may be an effective therapeutic approach for treating APAP-induced liver injury. We aimed to reveal the effects of narirutin (NR), the main bioactive constituents isolated from citrus peels, on APAP hepatotoxicity and to explore its underlying mechanism. Administration of NR enhanced activities of antioxidant enzymes, improved mitochondrial dysfunction and alleviated liver injury in APAP-treated mice, whereas NR did not affect APAP metabolism and MAPK/JNK activation. NR enhanced TFEB transcriptional activity and activated ALP in an MTOR complex 1 (MTORC1)-independent but PPP3/calcineurin-dependent manner. Moreover, knockout of Tfeb or knockdown of PPP3CB/CNA2 (protein phosphatase 3, catalytic subunit, beta isoform) in the liver abolished the beneficial effects of NR on APAP overdose. Mechanistically, NR bound to PPP3CB via PRO31, LYS61 and PRO347 residues and enhanced PPP3/calcineurin activity, thereby eliciting dephosphorylation of TFEB and promoting ALP, which alleviated APAP-induced oxidative stress and liver injury. Together, NR protects against APAP-induced liver injury by activating a PPP3/calcineurin-TFEB-ALP axis, indicating NR may be a potential agent for treating APAP overdose.Abbreviations: ALP: autophagy-lysosomal pathway; APAP: acetaminophen; APAP-AD: APAP-protein adducts; APAP-Cys: acetaminophen-cysteine adducts; CAT: catalase; CETSA: cellular thermal shift assay; CQ: chloroquine; CYP2E1: cytochrome P450, family 2, subfamily e, polypeptide 1; CYCS/Cyt c: cytochrome c, somatic; DARTS: drug affinity responsive target stability assay; ENGASE/NAG: endo-beta-N-acetylglucosaminidase; GOT1/AST: glutamic-oxaloacetic transaminase 1, soluble; GPT/ALT: glutamic pyruvic transaminase, soluble; GSH: glutathione; GPX/GSH-Px: glutathione peroxidase; KD: dissociation constant; Leu: leupeptin; MCOLN1: mucolipin 1; MTORC1: MTOR complex 1; NAC: N-acetylcysteine; NAPQI: N-acetyl-p-benzoquinoneimine; NFAT: nuclear factor of activated T cells; NR: narirutin; OA: okadaic acid; RRAG: Ras related GTP binding; ROS: reactive oxygen species; PPP3CB/CNA2: protein phosphatase 3, catalytic subunit, beta isoform; PPP3R1/CNB1: protein phosphatase 3, regulatory subunit B, alpha isoform (calcineurin B, type I); SOD: superoxide dismutase; SPR: surface plasmon resonance analysis; TFEB: transcription factor EB.

Keywords: PPP3CB/CNA2; TFEB; autophagy-lysosomal pathway; hepatotoxicity; oxidative stress.


Conflict of interest statement

The authors declare no conflicts of interests.

Figures

Figure 1.
Figure 1.
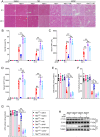
APAP-induced liver injury and oxidative stress are alleviated in mice treated with NR. (A-G) NR (50 mg/kg) was administered to male mice with simultaneous APAP (300 mg/kg) injection or 1 h before or 1, 2, or 4 h after APAP injection. (A) Representative images from H&E staining in mouse livers. Scale bar: 100 μm. (B) Quantification of necrotic areas (n = 9 per group). (C, D) Serum activities of GPT and GOT1 (n = 9 per group). (E-G) Hepatic activities of SOD, CAT and GPX in mice (n = 9 per group). (H) Immunoblotting of mitochondrial and cytoplasmic CYCS in mouse livers (n = 6 per group). Mice were administrated with NR (50 mg/kg, i.p) for 5 h or APAP (300 mg/kg, i.p) for 6 h; mice were given APAP (300 mg/kg, i.p) for 1 h followed by administration of NR (50 mg/kg, i.p) for another 5 h. (I) Survival rate of mice treated with saline, NR (50 mg/kg, i.p), APAP (500 mg/kg, i.p) or APAP + NR (treatment with 500 mg/kg APAP for 1 h followed by administration of 50 mg/kg NR). Saline and NR groups, n = 10 per group; APAP and APAP + NR groups, n = 20 per group. Data were expressed as the mean ± SEM. *P < 0.05; **P < 0.01.
Figure 2.
Figure 2.
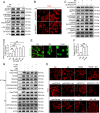
NR does not alter APAP metabolism and MAPK/JNK activation, but activates TFEB-mediated ALP in APAP-treated mice. Mice were given APAP (300 mg/kg, i.p) for 1 h followed by administration of NR (50 mg/kg, i.p) for different times. (A) Immunoblotting of CYP2E1 in mouse livers. (B) Total GSH content in mouse livers (n = 9 per group). (C) Immunoblotting of MAPK/JNK and p-MAPK/JNK(Thr183/Tyr185) in mouse livers. (D) Immunoblotting of mitochondrial and cytoplasmic MAPK/JNK and p-MAPK/JNK(Thr183/Tyr185) in mouse livers. (E-H, J-L) Mouse liver samples were collected after APAP treatment for 6 h. (E) Immunoblotting of SQSTM1 and LC3 in mouse livers. To block autophagic flux, mice were pretreated with Leu (40 mg/kg) for 8 h. (F) Relative mRNA levels of the indicated genes in mouse livers (n = 9 per group). (G) Immunoblotting of LAMP1, CTSD, MCOLN1, p-TFEB(Ser211) and TFEB in mouse livers. (H) Relative lysosomal ENGASE activity in mouse livers (n = 9 per group). (I) The content of APAP-Cys in mouse livers (n = 9 per group). (J) Immunoblotting of mitochondrial and cytoplasmic PINK1 and PRKN/Parkin in mouse livers. (K) Representative images from immunofluorescence staining of TFEB in mouse livers. Scale bar: 10 μm. (L) Immunoblotting of nuclear and cytoplasmic TFEB in mouse livers. (M) Immunoblotting of TFEB, SQSTM1 and LC3 in mouse livers. Mice were pretreated with Leu (40 mg/kg) for 8 h and then treated with NR (50 mg/kg) for 5 h. (N) Immunoblotting of LAMP1, CTSD and MCOLN1 in mouse livers. Mice were treated with or without NR (50 mg/kg) for 5 h. n = 6 per group for A, C-E, G, J and L-N. Data were expressed as the mean ± SEM. *P < 0.05; **P < 0.01.
Figure 3.
Figure 3.
Deletion of hepatic Tfeb blocks the protection effects of NR on APAP-induced liver injury and oxidative stress. Mice were given APAP (300 mg/kg, i.p) for 1 h followed by administration of NR (50 mg/kg, i.p) for another 5 or 23 h. (A) Representative images from H&E staining in mouse livers. Scale bar: 100 μm. (B) Quantification of necrotic areas (n = 9 per group) (C, D) Serum activities of GPT and GOT1 (n = 9 per group). (E-H) Mouse liver samples were collected after APAP treatment for 6 h. (E-G) Hepatic activities of SOD, CAT and GPX (n = 9 per group). (H) Immunoblotting of mitochondrial and cytoplasmic CYCS in mouse livers (n = 6 per group). Data were expressed as the mean ± SEM. *P < 0.05; **P < 0.01.
Figure 4.
Figure 4.
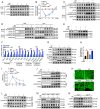
NR activates TFEB via PPP3/calcineurin. (A) Immunoblotting of p-ULK1(Ser757), ULK1, p-RPS6KB(Thr389), RPS6KB, p-RPS6(Ser240/244), RPS6, p-EIF4EBP1(Ser65) and EIF4EBP1 in HepG2 cells treated with NR (80 μM) for 7 h or Torin1 (250 nM) for 1 h. (B-C) HepG2 cells were transfected with WT RRAGC or active RRAGCS75L, and then treated with or without 80 μM NR for 7 h. (B) Representative fluorescence images of the subcellular localization of endogenous TFEB in HepG2 cells. Scale bar: 10 μm. (C) Immunoblotting of HA-RRAGC, p-ULK1(Ser757), ULK1, p-RPS6KB(Thr389), RPS6KB, p-RPS6(Ser240/244), RPS6, p-EIF4EBP1(Ser65) and EIF4EBP1 in HepG2 cells. (D) Activity of PPP3/calcineurin in HepG2 cells transfected with ΔCaN or treated with different concentrations of NR (0, 20, 40 or 80 μM) for 7 h. (E) Representative images of the subcellular localization of GFP-NFAT in HepG2 cells. Scale bar: 10 μm. HepG2 cells transfected with GFP-NFAT were treated with 80 μM NR for 7 h or transfected with ΔCaN. (F) Relative mRNA level of RCAN1.4. (G) Co-IP analysis to assay interactions between Flag-TFEB and MTOR, RRAGA, RRAGC, PPP3CB/CNA2 and YWHA/14-3-3 in HepG2 cells. HepG2 cells transfected with Flag-TFEB were treated with 80 μM NR for 7 h, 250 nM Torin1 for 1 h or transfected with ΔCaN. (H) Representative fluorescence images of the subcellular localization of endogenous TFEB in HepG2 cells. Scale bar: 10 μm. HepG2 cells were treated with FK506 (5 μM, 3 h), BAPTA-AM (10 μM, 3 h), OA (800 nM, 1 h) or transfected with siPPP3CB or siMCOLN1 in the presence or absence of NR (80 μM, 7 h). All experiments were repeated at least 3 times. Data were expressed as the mean ± SEM. *P < 0.05; **P < 0.01.
Figure 5.
Figure 5.
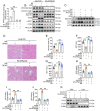
PPP3/calcineurin is required for NR to improve APAP-induced liver injury and oxidative stress. Mice injected with Ad-shPpp3cb or Ad-shCtrl were given APAP (300 mg/kg, i.p) for 1 h followed by administration of NR (50 mg/kg, i.p) for another 5 h. (A) Activity of PPP3/calcineurin in mouse livers. (B) Immunoblotting of PPP3CB/CNA2, PPP3R1/CNB1, p-TFEB(Ser211), TFEB, LAMP1, CTSD and MCOLN1 in mouse livers. (C) Immunoblotting of SQSTM1 and LC3 in mouse livers. Mice were intraperitoneally injected Leu (40 mg/kg) before APAP injection for 8 h. (D) Representative images from H&E staining in mouse livers. Scale bar: 100 μm. (E) Quantification of necrotic areas. (F, G) Serum activities of GPT and GOT1. (H-J) Hepatic activities of SOD, CAT and GPX. (K) Immunoblotting of mitochondrial and cytoplasmic CYCS in mouse livers. n = 9 per group for A and E-J. n = 6 per group for B, C and K. Data were expressed as the mean ± SEM. *P < 0.05; **P < 0.01.
Figure 6.
Figure 6.
NR binds to PRO31, LYS61 and PRO347 of PPP3CB/CNA2. (A, B) HepG2 cells transfected with siCtrl or siTFEB were treated with or without 80 μM NR for 7 h. (A) The quantitative data of the levels of lysosomal and cytosolic Ca2+ in HepG2 cells. (B) Activity of PPP3/calcineurin in HepG2 cells. (C) Representative fluorescence images of the subcellular localization of GFP-NFAT in HepG2 cells. Scale bar: 10 μm. HepG2 cells transfected with GFP-NFAT were transfected with siCtrl or siTFEB, and then treated with or without 80 μM NR for 7 h. (D, E) CETSA and DARTS were performed to measure the binding ability of NR to PPP3CB/CNA2 and PPP3R1/CNB1 in HEK293T cells. (F) Stable three-dimensional structure of PPP3/calcineurin binding with NR based on molecular dynamics simulation and the detailed presentation of the binding sites. (G) SPR assay of PPP3CB/CNA2 and PPP3R1/CNB1 interaction with NR. (H, I) CETSA and DARTS were performed to measure the binding ability of NR to PPP3CB/CNA2 truncations in HEK293T cells. (J, K) CETSA and DARTS were performed to measure the binding ability of NR to PPP3CB/CNA2 mutants. (L) Co-IP analysis to assay the interaction between HA- PPP3CB/CNA2 and TFEB in HEK293T cells. HEK293T cells were transfected with WT PPP3CB/CNA2 or mutant PPP3CB/CNA2 (P31A, L61A, P347A), and then treated with or without 80 μM NR for 7 h. All experiments were repeated at least 3 times. Data were expressed as the mean ± SEM. *P < 0.05; **P < 0.01.
Figure 7.
Figure 7.
PRO31, LYS61 and PRO347 of PPP3CB/CNA2 is responsible for the protective effects of NR on APAP toxicity. Primary mouse hepatocytes transfected with Ad-shPpp3cb were transfected with WT PPP3CB/CNA2 or mutant PPP3CB/CNA2 (P31A, L61A, P347A). Then, cells were treated with NR (80 μM) 1 h after APAP administration (10 mM) and harvested after APAP treatment for 8 h. (A) Activity of PPP3/calcineurin in hepatocytes. (B) Representative fluorescence images of the subcellular localization of endogenous TFEB in hepatocytes. Scale bar: 10 μm. (C) Immunoblotting of SQSTM1 and LC3 in hepatocytes. To block autophagic flux, hepatocytes were treated with 50 μM CQ for 4 h before APAP treatment. (D) Immunoblotting of HA- PPP3CB/CNA2, p-TFEB(Ser211), TFEB, LAMP1, CTSD and MCOLN1 in hepatocytes. (E) Representative fluorescence images of TMRE and MitoSOX in hepatocytes. Scale bar: 10 μm. (F) Immunoblotting of mitochondrial and cytoplasmic CYCS in hepatocytes. (G, H) Activities of GPT and GOT1 in medium. (I) Viability of hepatocytes. (J) Proposed model for the beneficial effects of NR on APAP overdose. NR binds to PPP3/calcineurin catalytic subunit A2 via PRO31, LYS61 and PRO347 residues and enhances PPP3/calcineurin activity, thereby dephosphorylates TFEB and promotes activation of ALP, which alleviates APAP-induced oxidative stress and liver injury (created with BioRender.com). All experiments were repeated at least 3 times. Data were expressed as the mean ± SEM. *P < 0.05; **P < 0.01.

References

    1. Larson AM. Acetaminophen hepatotoxicity. Clin Liver Dis. 2007;11(3):525–548. - PubMed
    1. Dahlin DC, Miwa GT, Lu AY, et al. N-acetyl-p-benzoquinone imine: a cytochrome P-450-mediated oxidation product of Acetaminophen. Proc Natl Acad Sci U S A. 1984;81(5):1327–1331. - PMC - PubMed
    1. McGill MR, Sharpe MR, Williams CD, et al. The mechanism underlying Acetaminophen-induced hepatotoxicity in humans and mice involves mitochondrial damage and nuclear DNA fragmentation. J Clin Invest. 2012;122(4):1574–1583. - PMC - PubMed
    1. Ni H-M, McGill MR, Chao X, et al. Removal of Acetaminophen protein adducts by autophagy protects against Acetaminophen-induced liver injury in mice. J Hepatol. 2016;65(2):354–362. - PMC - PubMed
    1. Hanawa N, Shinohara M, Saberi B, et al. Role of JNK translocation to mitochondria leading to inhibition of mitochondria bioenergetics in Acetaminophen-induced liver injury. J Biol Chem. 2008;283:13565–13577. - PMC - PubMed

Publication types

Supplementary concepts