Unravelling homologous recombination repair deficiency and therapeutic opportunities in soft tissue and bone sarcoma
- PMID: 36779660
- PMCID: PMC10086583
- DOI: 10.15252/emmm.202216863
Unravelling homologous recombination repair deficiency and therapeutic opportunities in soft tissue and bone sarcoma
Abstract
Defects in homologous recombination repair (HRR) in tumors correlate with poor prognosis and metastases development. Determining HRR deficiency (HRD) is of major clinical relevance as it is associated with therapeutic vulnerabilities and remains poorly investigated in sarcoma. Here, we show that specific sarcoma entities exhibit high levels of genomic instability signatures and molecular alterations in HRR genes, while harboring a complex pattern of chromosomal instability. Furthermore, sarcomas carrying HRDness traits exhibit a distinct SARC-HRD transcriptional signature that predicts PARP inhibitor sensitivity in patient-derived sarcoma cells. Concomitantly, HRDhigh sarcoma cells lack RAD51 nuclear foci formation upon DNA damage, further evidencing defects in HRR. We further identify the WEE1 kinase as a therapeutic vulnerability for sarcomas with HRDness and demonstrate the clinical benefit of combining DNA damaging agents and inhibitors of DNA repair pathways ex vivo and in the clinic. In summary, we provide a personalized oncological approach to treat sarcoma patients successfully.
Keywords: HRD score; HRDness; genomic instability; sarcoma.
© 2023 The Authors. Published under the terms of the CC BY 4.0 license.
Conflict of interest statement
C.P. reports a consulting/advisory role for F. Hoffman‐La Roche AG outside this work. M.A.R. is on the SAB for Neogenomics, Inc., and receives research funding from H. Hoffman‐La Roche AG and Genentech, Inc. No competing interest, financial or otherwise, is declared by all other authors.
Figures

Quantification of loss‐of‐heterozygosity (LOH) in soft tissue and bone sarcoma.
Quantification of large‐scale transitions (LST) in soft tissue and bone sarcoma.
Quantification of telomeric allelic imbalances (TAI) in soft tissue and bone sarcoma.
Quantification of homologous recombination deficiency (HRD) score in soft tissue and bone sarcoma.
Oncoprint depicting the molecular alterations in 70 HRR genes in soft tissue and bone sarcoma and the total number of alterations. HGSOC, high‐grade serous ovarian cancer; TNBC, triple‐negative breast cancer; CRC, colorectal cancer; UPS, undifferentiated pleomorphic sarcoma; MFS, myxofibrosarcoma; OS, osteosarcoma; ULMS, uterine leiomyosarcoma; LMS, extra‐uterine leiomyosarcoma; DDLPS, dedifferentiated liposarcoma; SS, synovial sarcoma; DT, desmoid tumor.

- A–D
Heatmaps with hierarchical clustering showing aneuploidies (A), gains (B), losses (C) and total CIN (D) per chromosome in HRDhigh and HRDlow soft tissue and bone sarcoma, HGSOC, CRC and TNBC.
- E–H
Quantification of aneuploidies (E), gains (F), losses (G) and total number of alterations including gains and losses (H) in HRDhigh and HRDlow soft tissue and bone sarcoma, HGSOC, CRC and TNBC.
- I–L
CIN of cytobands including HRR genes in HRDhigh LMS (I), ULMS (J), MFS (K) and UPS (L) compared to HRDlow.
- M
List of the chromosomal cytobands that include HRR genes and exhibit increased CIN in HRDhigh compared with HRDlow sarcoma.
- N
Total number of alterations in STS patients previously treated with chemotherapy, radiotherapy or both.
- O
Correlation matrix showing genomic instability signatures and CIN.
- P
Matrix dot plot of mutational signatures in STS.

- A–D
Histograms depicting the frequency of LOH, LST, TAI, and HRD score in sarcoma.
- E
Bimodal distribution of HRR‐CIN in sarcoma.
- F
Receiver operating characteristic (ROC) curve of HRD scores from TCGA‐SARC cohort using HRR‐CIN for binary classification.
- G
Implementation of the Youden index on the ROC curve (F) to select the optimal cut‐off value for the HRD score 32 in soft tissue sarcoma. Datasets from TCGA‐SARC (n = 247) were used.
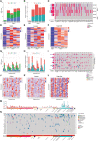
- A
Quantification of LOH, LST, TAI and HRD score in MFS.
- B
Fraction of genome with gains and losses in an MFS cohort.
- C
Oncoprint depicting the molecular alterations in HRR genes in MFS and the total number of alterations.
- D–F
Heatmaps of gains (D), losses (E), and total CIN (F) per chromosome in MFS.
- G
Quantification of LOH, LST, TAI and HRD score in angiosarcoma. Dotted line indicates the HRD score cut‐off of 32.
- H
Fraction of genome with gains and losses in an angiosarcoma cohort.
- I
Oncoprint depicting the molecular alterations in HRR genes in angiosarcoma and the total number of alterations.
- J–L
Heatmaps of gains (J), losses (K) and total CIN (L) per chromosome in angiosarcoma.
- M
LOH and tumor mutational burden (TMB) across several soft tissue and bone sarcoma cohorts. LOH values are reported as genome‐wide percentage of LOH events. TMB values are reported as mutations per megabase.
- N
Oncoprint depicting molecular alterations in HRR genes (included in the FoundationOne®HEME assay) in several sarcoma entities as well as their corresponding microsatellite (MS) status.
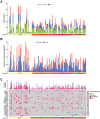
LOH, LST, TAI, and HRD score in OS, LMS, ULMS and UPS cohorts.
Fraction of genome with gains and losses in OS, LMS, ULMS and UPS cohorts.
Oncoprint depicting gains and losses in chromosomal regions of HRR genes (included in the Affymetrix Genome‐wide Human SNP 6.0 arrays and Oncoscan array) and the total number of alterations in OS, LMS, ULMS and UPS cohorts.

- A
Volcano plot showing enrichment of HRR genes in HRDhigh compared with HRDlow sarcoma cases.
- B
Enrichment score of HRR genes in HRDhigh compared with HRDlow sarcoma cases. Normalized enrichment P‐value = 2.5e10−10.
- C
Heatmap with hierarchical clustering of differentially expressed genes in HRDhigh compared with HRDlow sarcoma cases.
- D, E
GSEA showing hallmark (D) and KEGG (E) pathways enriched in HRDhigh compared with HRDlow sarcoma cases.
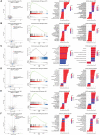
- A–F
Volcano plot showing HRR genes, enrichment score of HRR genes, GSEA showing hallmark and KEGG pathways enriched in HRDhigh compared with HRDlow UPS (A), MFS (B), ULMS (C), MPNST (D), LMS (E) and DDLPS (F). Normalized enrichment P‐values < 0.01 for UPS, MFS, MPNST, LMS, and DDLPS. Datasets from TCGA‐SARC (n = 247) were used.
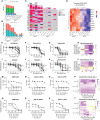
- A
Quantification of LOH, LST, TAI and HRD score in patient‐derived sarcoma cell models.
- B
Fraction of genome with gains and losses in patient‐derived sarcoma cell models.
- C
Oncoprint depicting the molecular alterations in HRR genes in patient‐derived sarcoma cell models and the total number of alterations.
- D
Heatmap with hierarchical clustering of the SARC‐HRD gene signature in HRDhigh compared with HRDlow sarcoma cell models. Data was mean‐centre and scaled.
- E–G
Ex vivo treatment of HRDhigh (NMFH‐1, OH931, PM197, USZ‐21_MFS2 and USZ‐21_UPS1) sarcoma models compared with HRDlow (USZ‐20_REA1, USZ‐21_LG1, USZ‐22_EMC2, USZ‐20_SFT1 and USZ‐21_CIC1) sarcoma models for 4 days with six doses of the chemotherapy agents oxaliplatin, doxorubicin, and trabectedin.
- H
Heatmap of IC50 showing drug sensitivity responses in all cell models.
- I, J
HRDhigh sarcoma cell models show sensitivity to the PARPi olaparib (I) and niraparib (J) when treated for 12 days.
- K
HRDhigh sarcoma cell models show sensitivity to the WEE1 inhibitor adavosertib when treated for 12 days.
- L
Heatmap of IC50 showing sensitivity to PARPi and WEE1i in HRDhigh but not HRDlow sarcoma cell models. The ovarian carcinoma cell line UWB1.289 with BRCA1 mutations was used as positive control for PARPi response and HRDness.
- M–O
HRDhigh sarcoma cell models and UWB1.289 treated for 3 days with five doses of olaparib alone and in combination with 1 nM trabectedin. Note that no sensitivity to olaparib in monotherapy was observed at 3 days but from 8 days on (see Figs EV5A and B).
- P
Heatmap of the synergy scores ZIP, Loewe, Bliss and HSA showing synergy in the combinatorial modality.
- Q–S
HRDhigh sarcoma cell models and UWB1.289 treated for 3 days with five doses adavosertib alone and in combination with 100 nM doxorubicin.
- T
Heatmap of the synergy scores ZIP, Loewe, Bliss and HSA showing synergy in the combinatorial modality.

- A–C
Heatmaps of gains (A), losses (B) and total CIN (C) per chromosome in sarcoma cell models.
- D
Volcano plot showing enrichment of HRR genes in HRDhigh compared with HRDlow sarcoma cell models.
- E
Enrichment score of HRR genes in HRDhigh compared with HRDlow sarcoma cell models. Normalized enrichment P‐value < 0.01.
- F, G
GSEA showing hallmark (F) and KEGG (G) pathways enriched in HRDhigh compared with HRDlow sarcoma cell models.

- A, B
HRDhigh sarcoma cell models show sensitivity to the PARPi olaparib (A) and niraparib (B) when treated for 8 days.
- C
HRDhigh sarcoma cell models show sensitivity to the WEE1 inhibitor adavosertib when treated for 8 days.
- D
Heatmap of IC50 showing sensitivity to PARPi and WEE1i in HRDhigh but not HRDlow sarcoma cell models. The ovarian carcinoma cell line UWB1.289 with BRCA1 mutations was used as positive control for PARPi response and HRDness.
- E
Area under the curve (AUC) for oxaliplatin, doxorubicin and trabectedin upon 4 days treatment; corresponding dose–response curves depicted in Fig 5E–G.
- F
AUC for olaparib, niraparib and adavosertib upon 8 days treatment; corresponding dose–response curves depicted in Fig EV5A–C.
- G
AUC for olaparib, niraparib and adavosertib upon 12 days treatment; corresponding dose–response curves depicted in Fig 5I–K.
- H, I
HRDlow sarcoma cell models treated for 3 days with five doses olaparib alone and in combination with 1 nM trabectedin.
- J, K
HRDlow sarcoma cell models treated for 3 days with five doses adavosertib alone and in combination with 100 nM doxorubicin.
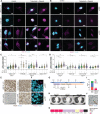
- A
Immunofluorescence showing nuclear expression of the DNA damage marker γH2A.X (magenta) upon 6 h treatment with 10 nM trabectedin and 100 nM olaparib in combination in HRDhigh and HRDlow sarcoma cell models as well as ovarian carcinoma UWB1.289 cells.
- B
Immunofluorescence showing RAD51 nuclear foci (magenta) upon 6 h treatment with 10 nM trabectedin and 100 nM olaparib in combination only in the HRDlow sarcoma cell model (USZ‐21_LG1).
- C, D
Quantification of γH2A.X (C) or RAD51 (D) nuclear intensity per cell compared to untreated control cells.
- E
Immunohistochemistry (IHC) in human tissue sections showing RAD51 (brown) expression in HRDlow but not HRDhigh sarcoma patients. Small‐nucleated lymphocytes and/or proliferating cells appeared RAD51‐positive in HRDhigh models.
- F
Immunofluorescence in human tissue sections showing RAD51 (magenta) nuclear foci in an HRDlow but not an HRDhigh sarcoma patient.
- G
Timeline of LMS patient diagnosis and treatment.
- H
Magnetic resonance imaging (MRI) of LMS patient since primary diagnosis. Open arrowheads point at metastatic lesions. PDX, primary diagnosis; PD, progressive disease; AMI, acute myocardial infarction; PR, partial response; SD, stable disease; CT, computer tomography; MRI, magnetic resonance imaging.
- I
Genomic profiling of a gastric metastasis showing HRD score and fraction of genome altered.
- J
RAD51 IHC in the metastatic patient's tissue. Compare RAD51 nuclear expression in normal tissue (arrowhead points at gastric gland) but not in tumorous gastric tissue.
- K
Oncoprint depicting the molecular alterations in HRR genes in the metastatic sample.
Comment in
-
Leveraging homologous recombination repair deficiency in sarcoma.EMBO Mol Med. 2023 Apr 11;15(4):e17453. doi: 10.15252/emmm.202317453. Epub 2023 Mar 17. EMBO Mol Med. 2023. PMID: 36929572 Free PMC article.
Similar articles
-
Leveraging homologous recombination deficiency for sarcoma : Unravelling homologous recombination repair deficiency and therapeutic opportunities in soft tissue and bone sarcoma.Pathologie (Heidelb). 2024 Nov;45(Suppl 1):14-19. doi: 10.1007/s00292-024-01381-y. Epub 2024 Nov 13. Pathologie (Heidelb). 2024. PMID: 39535612 Free PMC article.
-
Molecular signatures of BRCAness analysis identifies PARP inhibitor Niraparib as a novel targeted therapeutic strategy for soft tissue Sarcomas.Theranostics. 2020 Jul 25;10(21):9477-9494. doi: 10.7150/thno.45763. eCollection 2020. Theranostics. 2020. PMID: 32863940 Free PMC article.
-
Homologous recombination deficiency real-time clinical assays, ready or not?Gynecol Oncol. 2020 Dec;159(3):877-886. doi: 10.1016/j.ygyno.2020.08.035. Epub 2020 Sep 20. Gynecol Oncol. 2020. PMID: 32967790 Review.
-
Leveraging homologous recombination repair deficiency in sarcoma.EMBO Mol Med. 2023 Apr 11;15(4):e17453. doi: 10.15252/emmm.202317453. Epub 2023 Mar 17. EMBO Mol Med. 2023. PMID: 36929572 Free PMC article.
-
Testing for homologous recombination repair or homologous recombination deficiency for poly (ADP-ribose) polymerase inhibitors: A current perspective.Eur J Cancer. 2023 Jan;179:136-146. doi: 10.1016/j.ejca.2022.10.021. Epub 2022 Nov 2. Eur J Cancer. 2023. PMID: 36563604 Review.
Cited by
-
Transcriptomic and proteomic profiling identifies feline fibrosarcoma as clinically amenable model for aggressive sarcoma subtypes.Neoplasia. 2025 Feb;60:101104. doi: 10.1016/j.neo.2024.101104. Epub 2024 Dec 15. Neoplasia. 2025. PMID: 39681068 Free PMC article.
-
Whole-Exome Analysis and Osteosarcoma: A Game Still Open.Int J Mol Sci. 2024 Dec 20;25(24):13657. doi: 10.3390/ijms252413657. Int J Mol Sci. 2024. PMID: 39769419 Free PMC article. Review.
-
Loss of the DNA Repair Gene RNase H2 Identifies a Unique Subset of DDR-Deficient Leiomyosarcomas.Mol Cancer Ther. 2024 Jul 2;23(7):1057-1065. doi: 10.1158/1535-7163.MCT-23-0761. Mol Cancer Ther. 2024. PMID: 38561019 Free PMC article.
-
Biomimetic Targeted Co-Delivery System Engineered from Genomic Insights for Precision Treatment of Osteosarcoma.Adv Sci (Weinh). 2025 Jan;12(2):e2410427. doi: 10.1002/advs.202410427. Epub 2024 Nov 18. Adv Sci (Weinh). 2025. PMID: 39555699 Free PMC article.
-
Gene co-expression network analysis reveals relationship between leukocyte fraction and genomic instability in dedifferentiated liposarcoma.Mol Biol Res Commun. 2025;14(3):203-218. doi: 10.22099/mbrc.2025.51329.2050. Mol Biol Res Commun. 2025. PMID: 40321702 Free PMC article.
References
Publication types
MeSH terms
Substances
Associated data
- Actions
Grants and funding
LinkOut - more resources
Full Text Sources
Medical
Molecular Biology Databases
Research Materials

