. 2023 Apr 1;324(4):C807-C820.
doi: 10.1152/ajpcell.00286.2022. Epub 2023 Feb 13.

Statins inhibit protein kinase D (PKD) activation in intestinal cells and prevent PKD1-induced growth of murine enteroids

Affiliations

Statins inhibit protein kinase D (PKD) activation in intestinal cells and prevent PKD1-induced growth of murine enteroids

James Sinnett-Smith et al. Am J Physiol Cell Physiol. .

Abstract

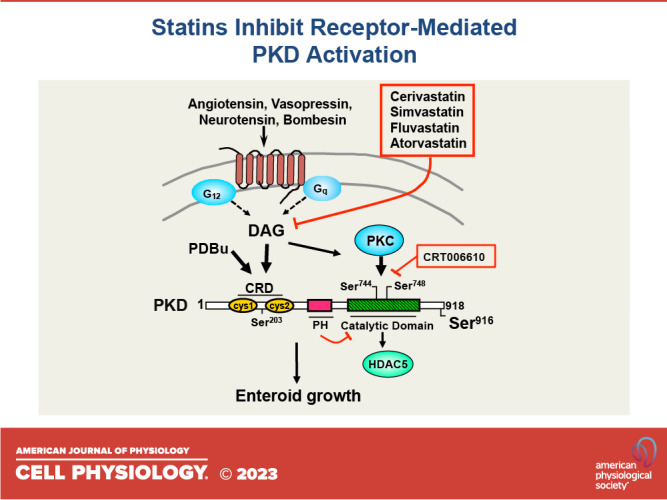
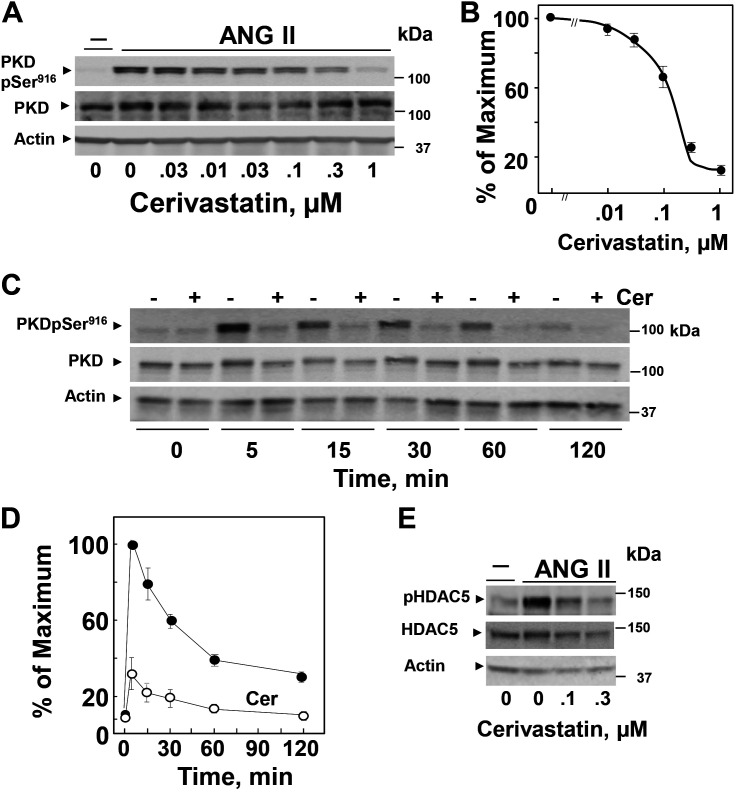
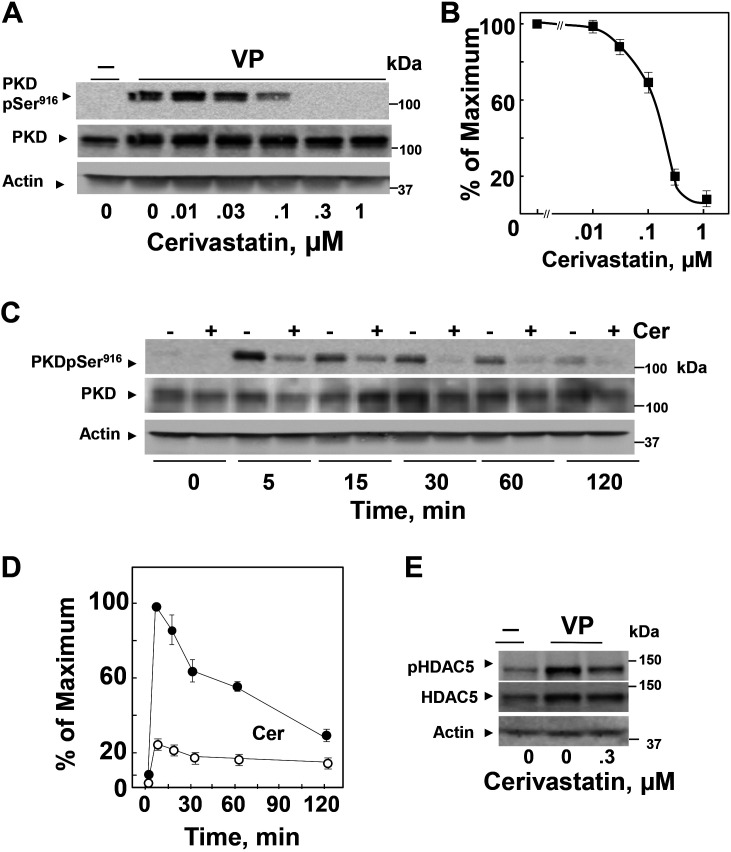
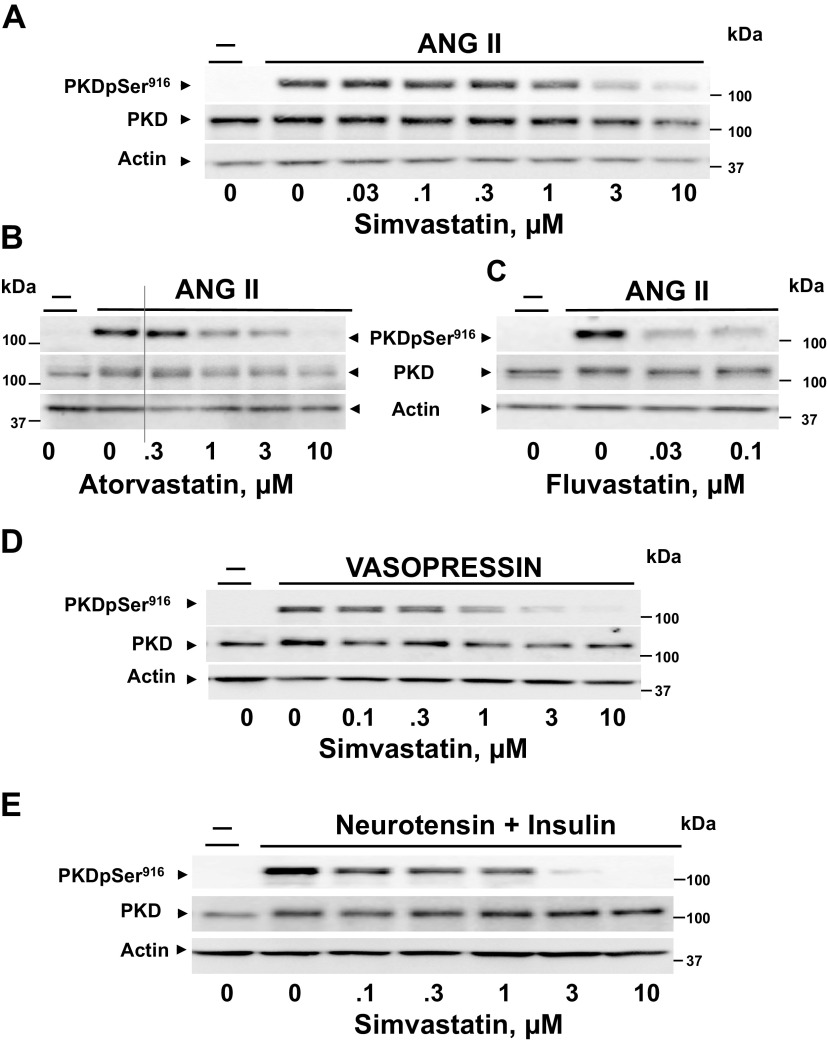
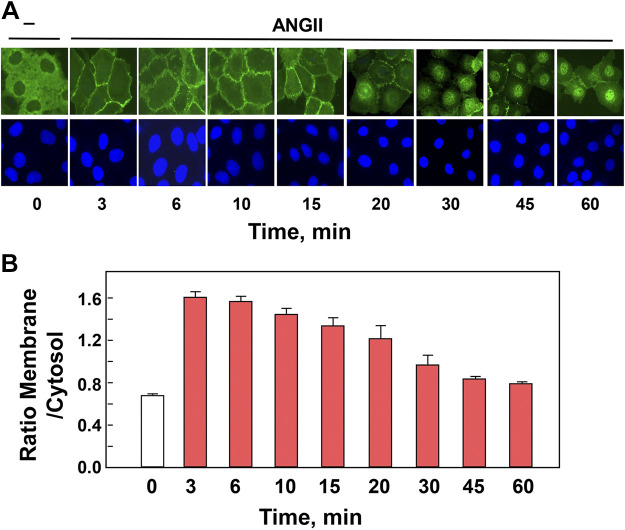
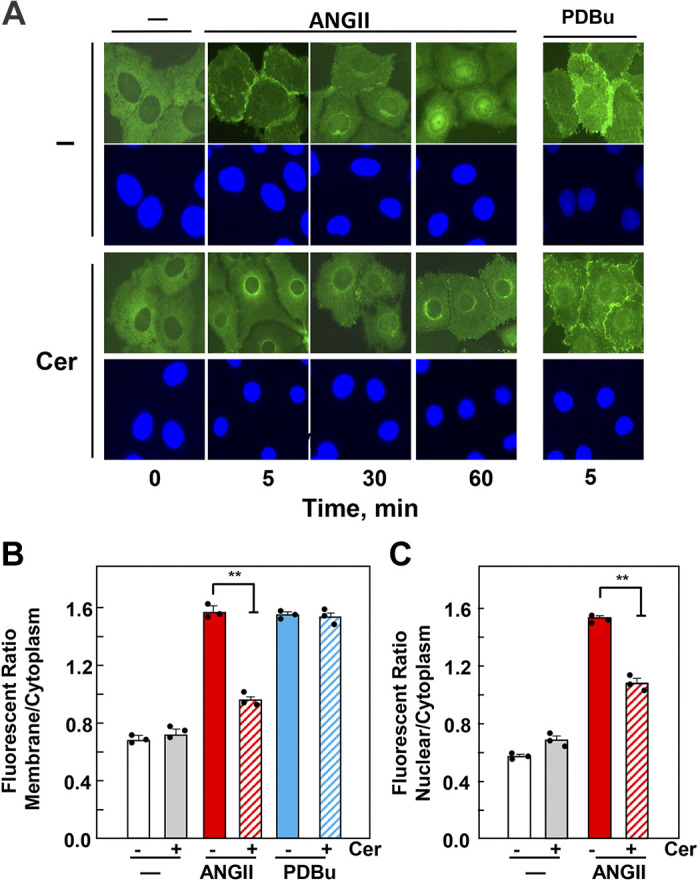
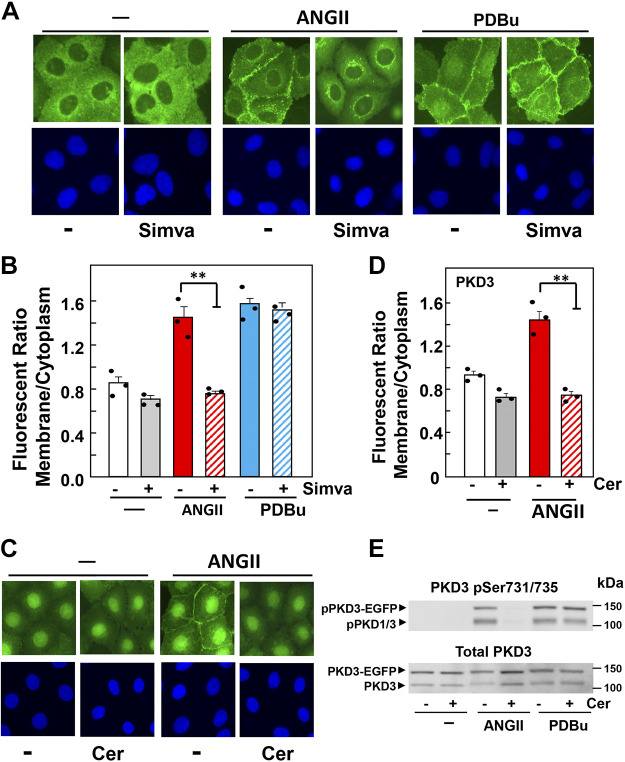
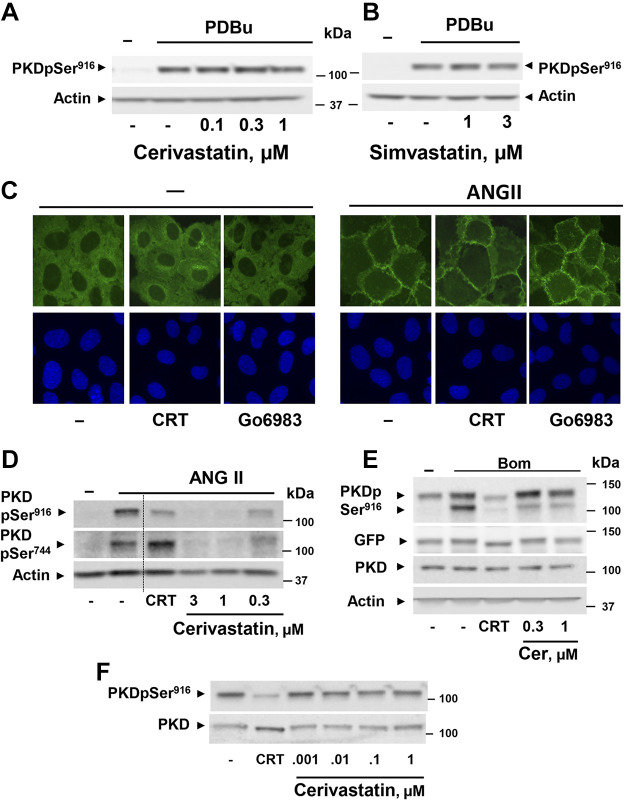
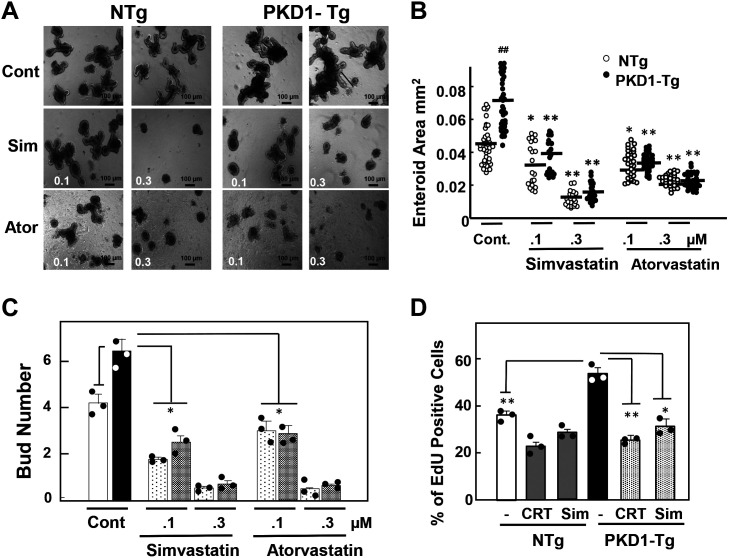
We examined the impact of statins on protein kinase D (PKD) activation by G protein-coupled receptor (GPCR) agonists. Treatment of intestinal IEC-18 cells with cerivastatin inhibited PKD autophosphorylation at Ser916 induced by angiotensin II (ANG II) or vasopressin in a dose-dependent manner with half-maximal inhibition at 0.2 µM. Cerivastatin treatment inhibited PKD activation stimulated by these agonists for different times (5-60 min) and blunted HDAC5 phosphorylation, a substrate of PKD. Other lipophilic statins, including simvastatin, atorvastatin, and fluvastatin also prevented PKD activation in a dose-dependent manner. Using IEC-18 cell lines expressing PKD1 tagged with EGFP (enhanced green fluorescent protein), cerivastatin or simvastatin blocked GPCR-mediated PKD1-EGFP translocation to the plasma membrane and its subsequent nuclear accumulation. Similar results were obtained in IEC-18 cells expressing PKD3-EGFP. Mechanistically, statins inhibited agonist-dependent PKD activation rather than acting directly on PKD catalytic activity since exposure to cerivastatin or simvastatin did not impair PKD autophosphorylation or PKD1-EGFP membrane translocation in response to phorbol dibutyrate, which bypasses GPCRs and directly stimulates PKC and PKD. Furthermore, cerivastatin did not inhibit recombinant PKD activity determined via an in vitro kinase assay. Using enteroids generated from intestinal crypt-derived epithelial cells from PKD1 transgenic mice as a model of intestinal regeneration, we show that statins oppose PKD1-mediated increase in enteroid area, complexity (number of crypt-like buds), and DNA synthesis. Our results revealed a previously unappreciated inhibitory effect of statins on receptor-mediated PKD activation and in opposing the growth-promoting effects of PKD1 on intestinal epithelial cells.

Keywords: CRT0066101; angiotensin II; atorvastatin; cerivastatin; intestinal IEC-18 cells.


Conflict of interest statement

No conflicts of interest, financial or otherwise, are declared by the authors.

Figures

None
Graphical abstract
Figure 1.
Figure 1.
Cerivastatin treatment prevents protein kinase D (PKD) activation induced by angiotensin II (ANG II) in IEC-18 cells. A: cultures were treated for 24 h in the absence (0) or presence of increasing concentrations of cerivastatin before stimulation without (−) or with 10 nM ANG II for 60 min and lysed. The lysates were analyzed by Western blotting for phospho-PKD-Ser916, total PKD, and actin. B: quantification of three independent experiments similar to that shown in A are included and expressed as % of the maximal stimulation elicited by ANG II. C: cultures were treated for 24 h in the absence (−) or presence (+) of 1 µM cerivastatin before stimulation with 10 nM ANG II for different times (5–120 min) and lysed. The lysates were analyzed by Western blotting for phospho-PKD-Ser916, total PKD, and actin. D: quantification of three independent experiments similar to that shown in C are included and expressed as % of the maximal stimulation elicited by ANG II means ± SE, n = 3. E: cultures were treated for 24 h in the absence (0) or presence of cerivastatin (0.1 and 0.3 µM) before stimulation with 10 nM ANG II for 60 min and lysed. The lysates were analyzed by Western blotting for phospho-HDAC5-Ser498, HDAC5, and actin.
Figure 2.
Figure 2.
Cerivastatin treatment prevents protein kinase D (PKD) activation induced by vasopressin (VP) in IEC-18 cells. A: cultures were treated for 24 h in the absence (0) or presence of increasing concentrations of cerivastatin before stimulation with 10 nM vasopressin for 60 min and lysed. The lysates were analyzed by Western blotting for phospho-PKD-Ser916, total PKD, and actin. B: quantification of three independent experiments similar to that shown in A. C: cultures were treated for 24 h in the absence (−) or presence (+) of 1 µM cerivastatin before stimulation with 10 nM vasopressin for different times (5–120 min) and lysed. The lysates were analyzed by Western blotting for phospho-PKD-Ser916, total PKD, and actin. D: quantification of three independent experiments similar to that shown in C are included and expressed as % of the maximal stimulation elicited by vasopressin means ± SE, n = 3. E: cultures were treated for 24 h in the absence (0) or presence of cerivastatin (0.1 and 0.3 µM) before stimulation with 10 nM vasopressin for 60 min and lysed. The lysates were analyzed by Western blotting for phospho-HDAC5-Ser498, HDAC5, and actin.
Figure 3.
Figure 3.
Different lipophilic statins prevent protein kinase D (PKD) activation in IEC-18 cells and PANC-1 cells. Cultures of IEC-18 cells were treated for 24 h in the absence (0) or presence of increasing concentrations of simvastatin (A), atorvastatin (B), or fluvastatin (C) before stimulation with 10 nM ANG II for 60 min and lysed. The lysates were analyzed by Western blotting for phospho-PKD-Ser916, total PKD, and actin. D: IEC-18 cells were treated for 24 h in the absence (0) or presence of increasing concentrations of simvastatin before stimulation with 10 nM vasopressin for 60 min and lysed. The lysates were analyzed by Western blotting for phospho-PKD-Ser916, total PKD, and actin. E: cultures of pancreatic cancer PANC-1 cells were treated for 24 h in the absence (0) or presence of increasing concentrations of simvastatin before stimulation with 5 nM neurotensin and 10 ng/mL insulin for 10 min and lysed. The lysates were analyzed by Western blotting for phospho-PKD-Ser916, total PKD, and actin.
Figure 4.
Figure 4.
A: ANG II stimulation induces rapid spatiotemporal changes in EGFP-PKD1 in IEC-18 cells. IEC-18 cells that express PKD1 tagged with EGFP in an inducible manner (EGFP-PKD1.IEC-18) were treated with 1 µM doxycycline for 18 h and then stimulated with 10 nM ANG II for various times (3–60 min), as indicated. ANG II stimulation induced rapid spatiotemporal changes of PKD1, i.e., membrane translocation within 3 min and subsequent dissociation from the membrane and accumulation in the nucleus at 60 min. Nuclei were visualized by staining with Hoechst 33258. EGFP, enhanced green fluorescent protein. B: bars represent the ratio of membrane/cytoplasm, mean ± SE, n = 40 to 50 cells.
Figure 5.
Figure 5.
Cerivastatin inhibits PKD1 translocation to the membrane in response to ANG II in IEC-18 cells. A: doxycycline-induced EGFP-PKD1.IEC-18 cells were treated for 24 h without (−) or with 1 µM cerivastatin (Cer) before stimulation with either 10 nM ANG II for different times or 100 nM PDBu for 5 min, as indicated. B and C: quantification of three independent experiments at 5 min similar to that shown in A are included. Note that statin treatment prevented the membrane translocation of PKD1 (B) and subsequent accumulation in the nucleus at 60 min (C). Statistical significance was determined by one-way ANOVA followed by Tukey’s multiple comparison with ANG II (**P < 0.01). ANG II, angiotensin II; EGFP, enhanced green fluorescent protein; PDBu, phorbol 12, 13 dibutyrate.
Figure 6.
Figure 6.
Stains inhibits PKD1 and PKD3 translocation to the membrane in response to ANG II in IEC-18 cells. A: doxycycline-induced EGFP-PKD1.IEC-18 cells were treated for 24 h in the absence (−) or in the presence of 3 µM simvastatin (Sim) before stimulation without (−) or with either 10 nM ANG II or 100 nM PDBu for 5 min, as indicated. B: quantification of membrane/cytoplasm fluorescence in three independent experiments with EGFP-PKD1.IEC-18 cells similar to that shown in A. C: doxycycline-induced EGFP-PKD3.IEC-18 cells were treated for 24 h without (−) or with 1 µM cerivastatin (Cer) before stimulation either without (−) or with 10 nM ANG II, as indicated. D: quantification of membrane/cytoplasm fluorescence in three independent experiments with EGFP-PKD3.IEC-18 cells similar to that shown in C. Statistical significance in B and D was determined by one-way ANOVA followed by Tukey’s multiple comparison with ANG II. (**P < 0.01). E: doxycycline-induced EGFP-PKD3.IEC-18 cells were treated for 24 h in the absence (−) or presence of 1 µM cerivastatin (Cer) before stimulation without (−) or with 10 nM ANG II or 100 nM PDBu for 10 min and lysed. The lysates were analyzed by Western blotting for phosphorylated loop (PKD3 Ser731/735) and total PKD3. EGFP, enhanced green fluorescent protein.
Figure 7.
Figure 7.
Exposure to statins does not block protein kinase D (PKD) activation or PKD1 translocation to the membrane in response to PDBu and does not directly inhibit the PKD1 kinase activity. Cultures of IEC-18 cells were treated for 24 h in the absence (−) or presence of increasing concentrations of cerivastatin (A) or simvastatin (B) before stimulation with 100 nM PDBu for 60 min and lysed. The lysates were analyzed by Western blotting for phospho-PKD-Ser916 and actin. C: doxycycline-induced EGFP-PKD1.IEC-18 cells were treated for 1 h without (−) or with 3.5 µM CRT006101 or 3.5 µM Go6983 before stimulation without (−) or with 10 nM ANG II for 5 min. D: cultures of IEC-18 cells were treated for 24 h in the absence (−) or presence of increasing concentrations of cerivastatin (0.3-3 µM) or 3.5 µM CRT006101 for 1 h before stimulation with 10 ANG II for 60 min and lysed. The lysates were analyzed by Western blotting for phospho-PKD-Ser916, phospho-PKD-Ser744, and actin. E: COS cells cotransfected with a construct encoding a GFP-tagged PKD1 mutant lacking the PH domain and a GPCR encoding the bombesin receptor were treated with cerivastatin (Cer) for 24 h or 3.5 µM CRT006101 for 1 h. Then, the cultures were stimulated with bombesin for 10 min. The lysates were analyzed by Western blotting for phospho-PKD-Ser916, GFP, and total PKD. The upper band represents the GFP-tagged PKD1 mutant lacking the PH domain, whereas the lower band represents the endogenous PKD. F: recombinant PKD1 was incubated for 30 min in the absence or presence of 1 µM CRT006101 or increasing concentrations of cerivastatin, as indicated. Reactions were terminated by addition of 2× SDS-PAGE sample buffer and resolved by SDS-PAGE. PKD1 phosphorylation was determined by Western blotting with antibodies that detect phospho-PKD-Ser916 and total PKD. PDBu, phorbol 12, 13 dibutyrate; PH, pleckstrin homology.
Figure 8.
Figure 8.
Statins reduce the size, complexity, and DNA synthesis in enteroids derived from intestinal crypts of control and PKD1-transgenic mice. A: representative images of the size and bud number of enteroids derived from intestinal crypts from PKD1-Tg (Tg) or nontransgenic littermates (NTg) treated in the absence or presence of simvastatin (Sim) or atorvastatin (Ator) at the indicated concentrations. Scale bars = 100 µm. Quantification of the area (B) and number of buds per enteroid (C) derived from WT and PKD1-Tg crypts. Values are means ± SE of at least 30 enteroids. Similar results were obtained in three independent experiments. Statistical significance in B and C was determined by one-way ANOVA followed by Tukey’s multiple comparison. ##P < 0.01 (WT vs. PKD1-TG); *P < 0.05, **P < 0.01 (WT and PKD1-TG vs. simvastatin or atorvastatin). D: EdU incorporation in enteroids derived from WT and PKD1-Tg crypts in the absence or presence of 1.0 µM CRT0066101 (CRT) or 1.0 µM simvastatin (Sim) added 24 h before EdU. Values (percentage of EdU-positive cells in the crypt-like structures) are means ± SE; n = 10 buds. Similar results were obtained in three independent experiments. Statistical significance was determined by one-way ANOVA followed by Tukey’s multiple comparison. **P < 0.01 (WT vs. PKD1-TG) and **P < 0.01, *P < 0.05 (PKD1-TG vs. CRT or simvastatin).

Similar articles

References

    1. Rozengurt E, Rey O, Waldron RT. Protein kinase D signaling. J Biol Chem 280: 13205–13208, 2005. doi:10.1074/jbc.R500002200. - DOI - PubMed
    1. Rozengurt E. Protein kinase D signaling: multiple biological functions in health and disease. Physiology (Bethesda) 26: 23–33, 2011. doi:10.1152/physiol.00037.2010. - DOI - PMC - PubMed
    1. Valverde AM, Sinnett-Smith J, Van Lint J, Rozengurt E. Molecular cloning and characterization of protein kinase D: a target for diacylglycerol and phorbol esters with a distinctive catalytic domain. Proc Natl Acad Sci USA 91: 8572–8576, 1994. doi:10.1073/pnas.91.18.8572. - DOI - PMC - PubMed
    1. Zugaza JL, Sinnett-Smith J, Van Lint J, Rozengurt E. Protein kinase D (PKD) activation in intact cells through a protein kinase C-dependent signal transduction pathway. EMBO J 15: 6220–6230, 1996. doi:10.1002/j.1460-2075.1996.tb01012.x. - DOI - PMC - PubMed
    1. Rey O, Yuan J, Young SH, Rozengurt E. Protein kinase C nu/protein kinase D3 nuclear localization, catalytic activation, and intracellular redistribution in response to G protein-coupled receptor agonists. J Biol Chem 278: 23773–23785, 2003. doi:10.1074/jbc.M300226200. - DOI - PubMed

Publication types