. 2023 Apr 25;14(2):e0344922.
doi: 10.1128/mbio.03449-22. Epub 2023 Feb 13.

The Hypersaline Archaeal Histones HpyA and HstA Are DNA Binding Proteins That Defy Categorization According to Commonly Used Functional Criteria

Affiliations

The Hypersaline Archaeal Histones HpyA and HstA Are DNA Binding Proteins That Defy Categorization According to Commonly Used Functional Criteria

Saaz Sakrikar et al. mBio. .

Abstract

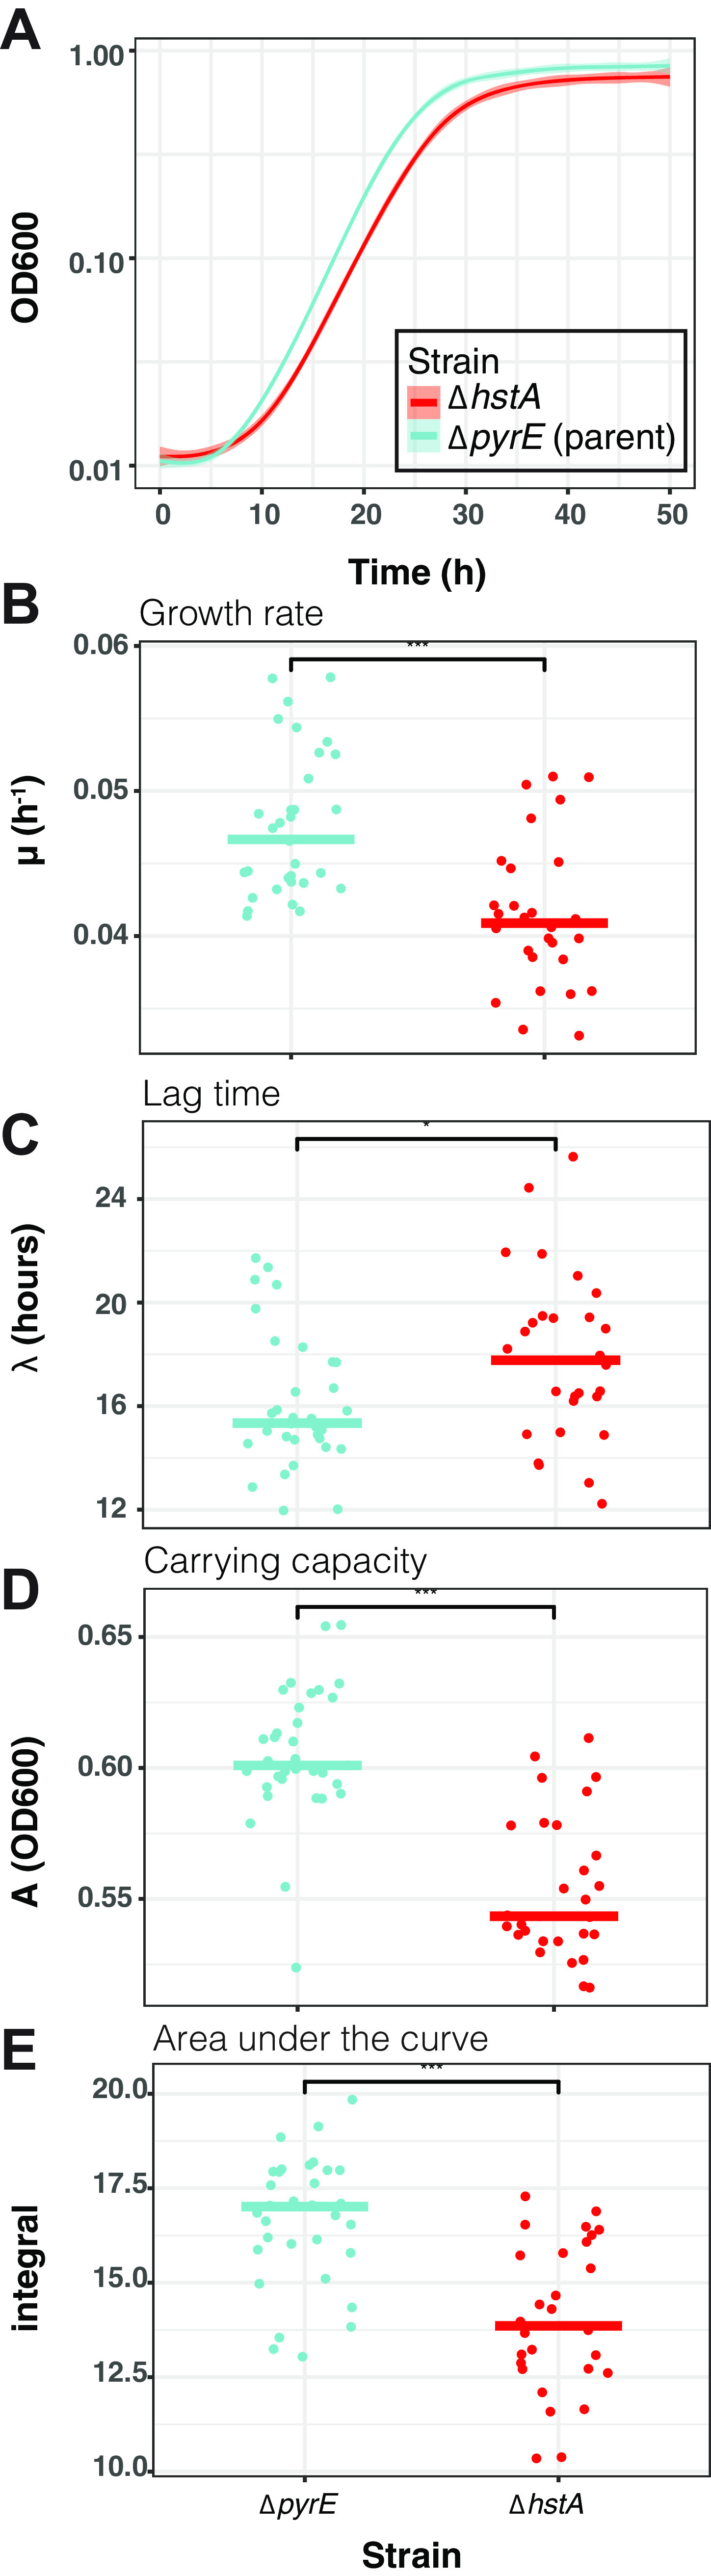
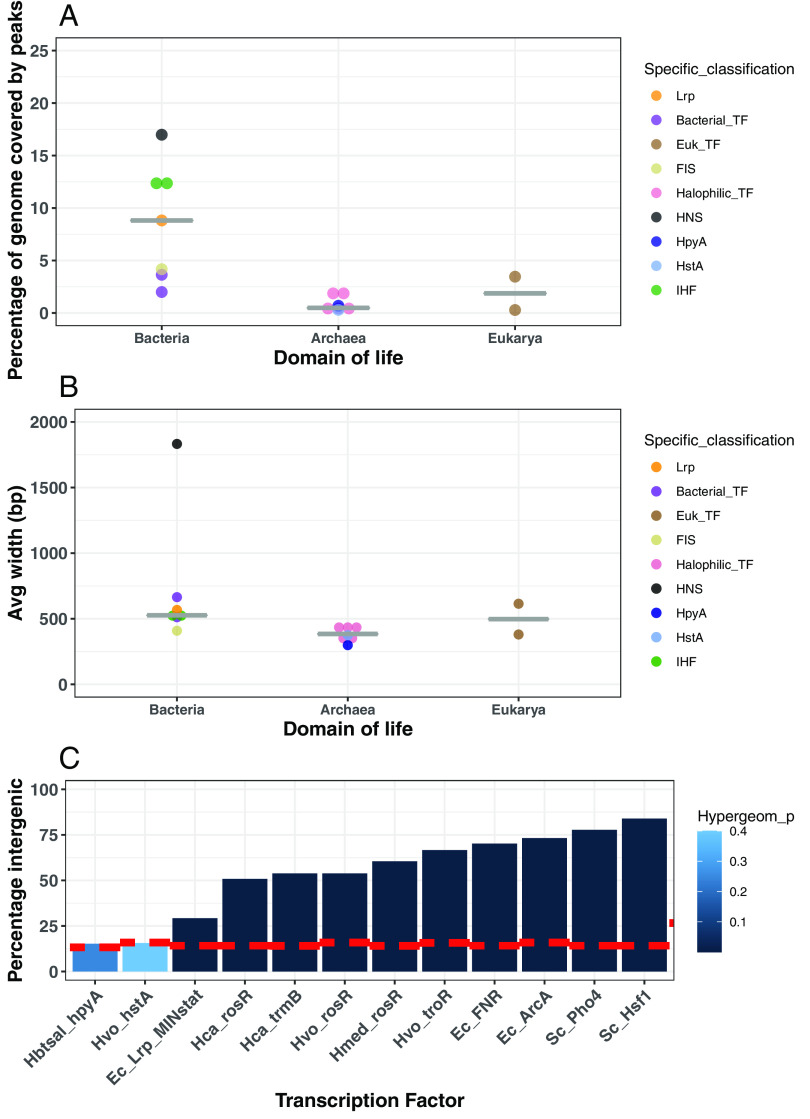
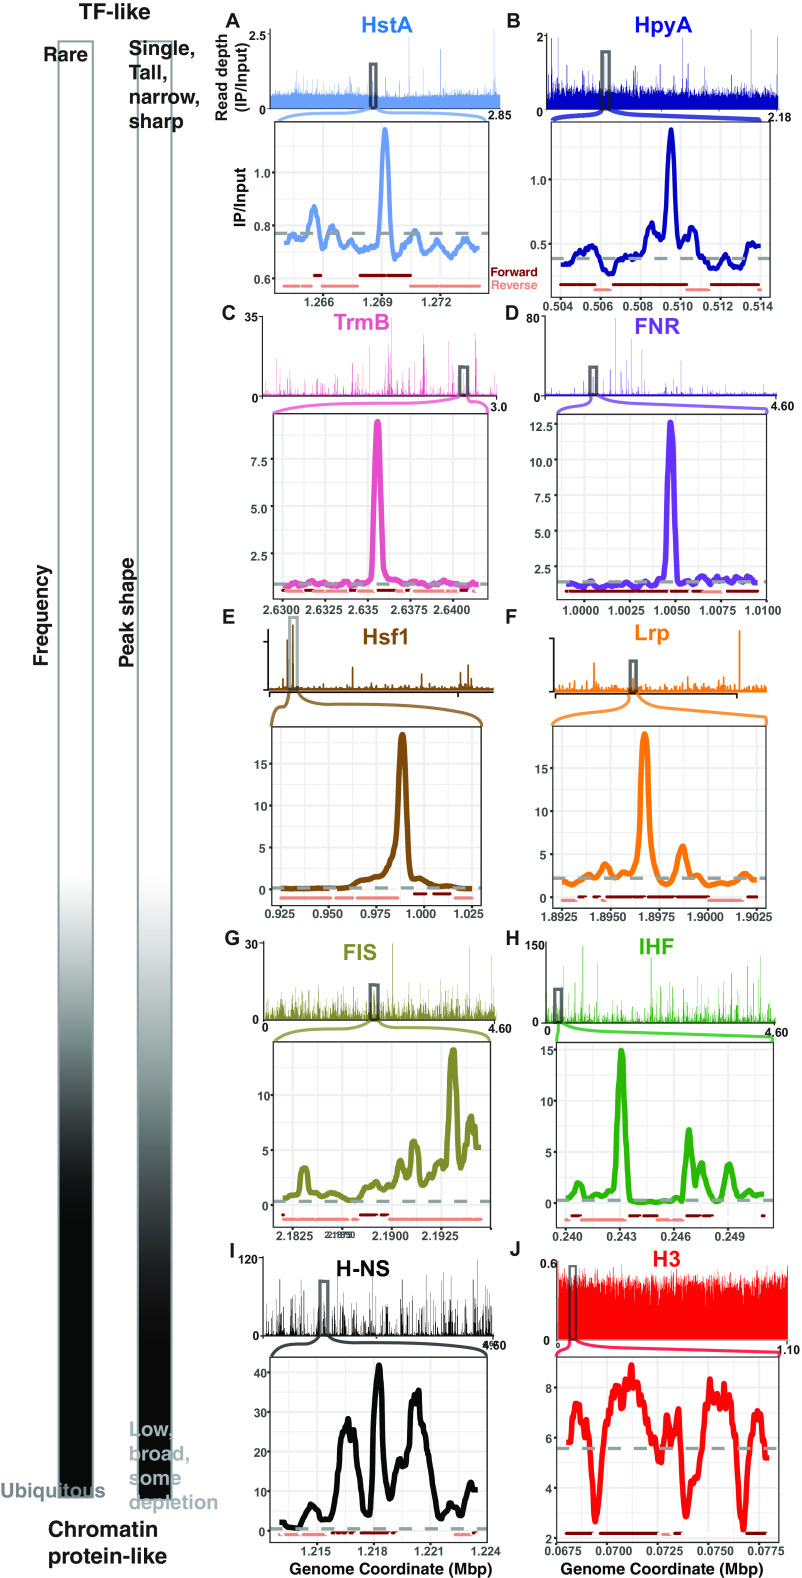
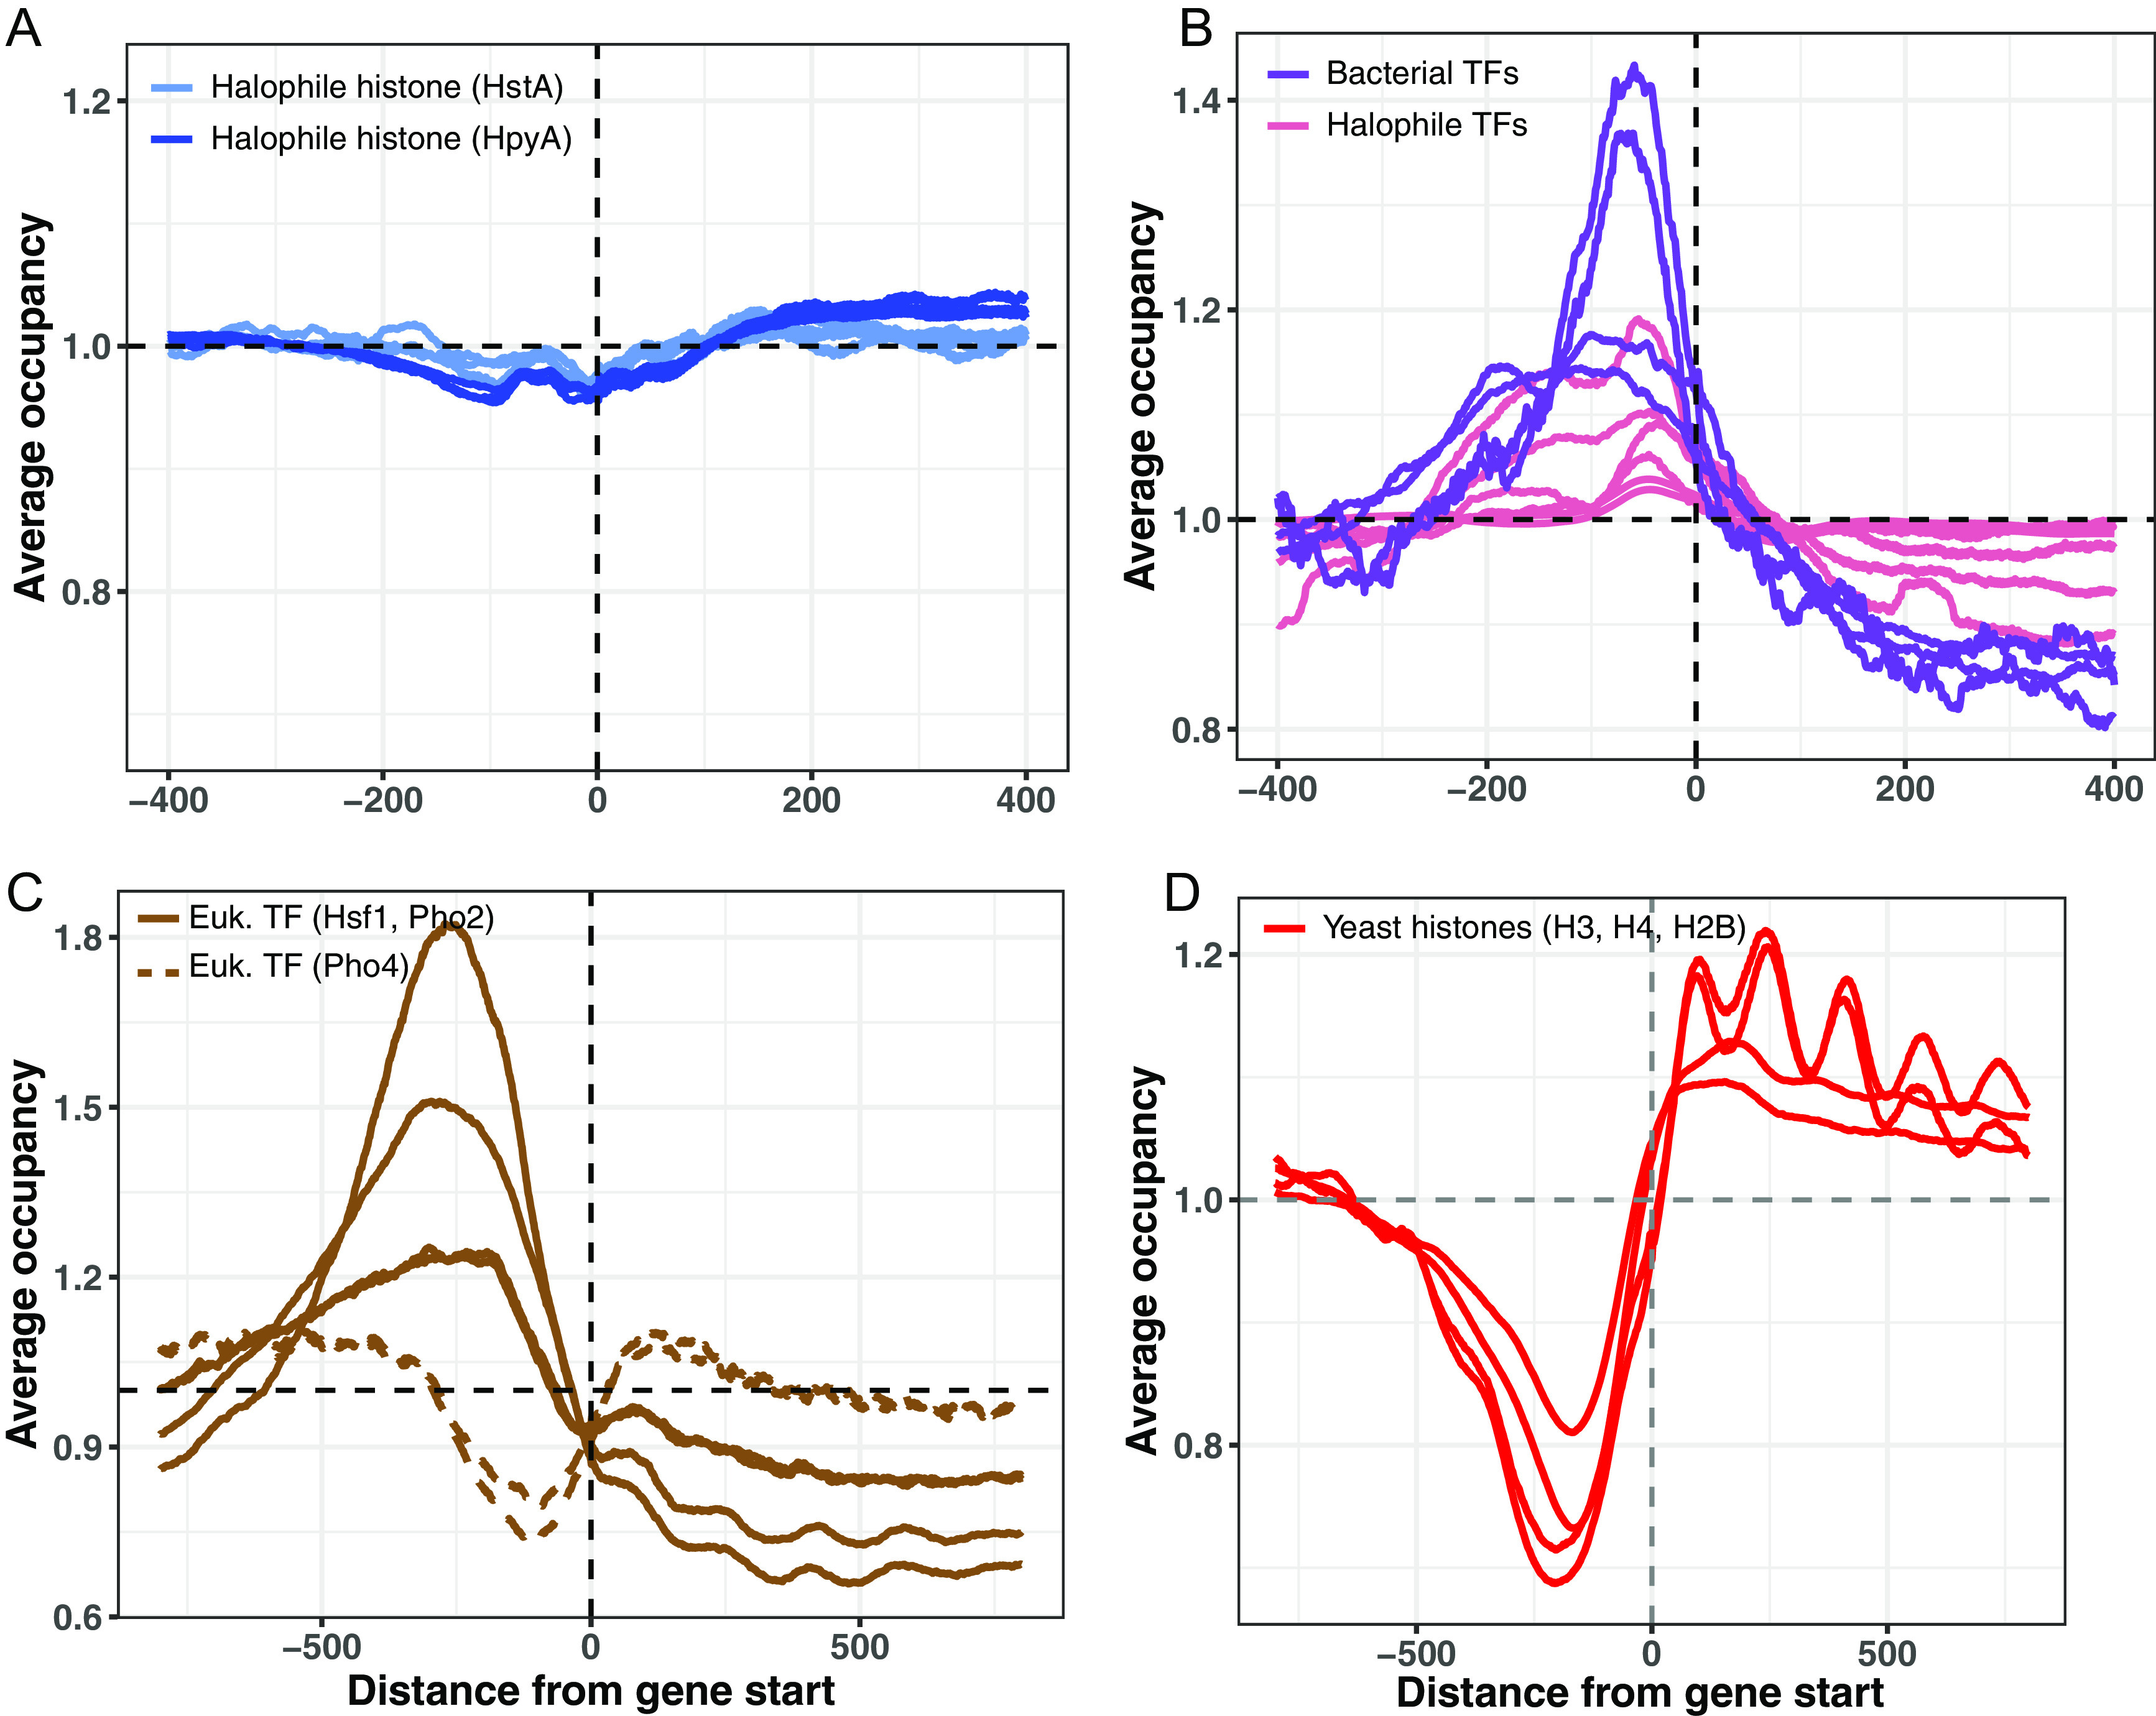
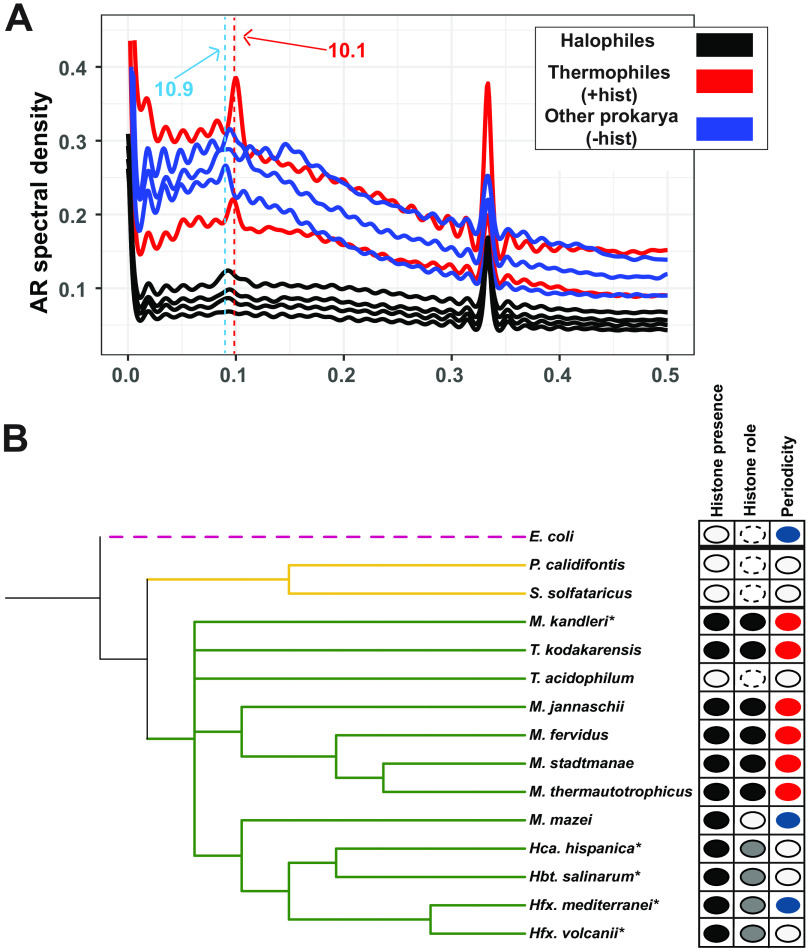
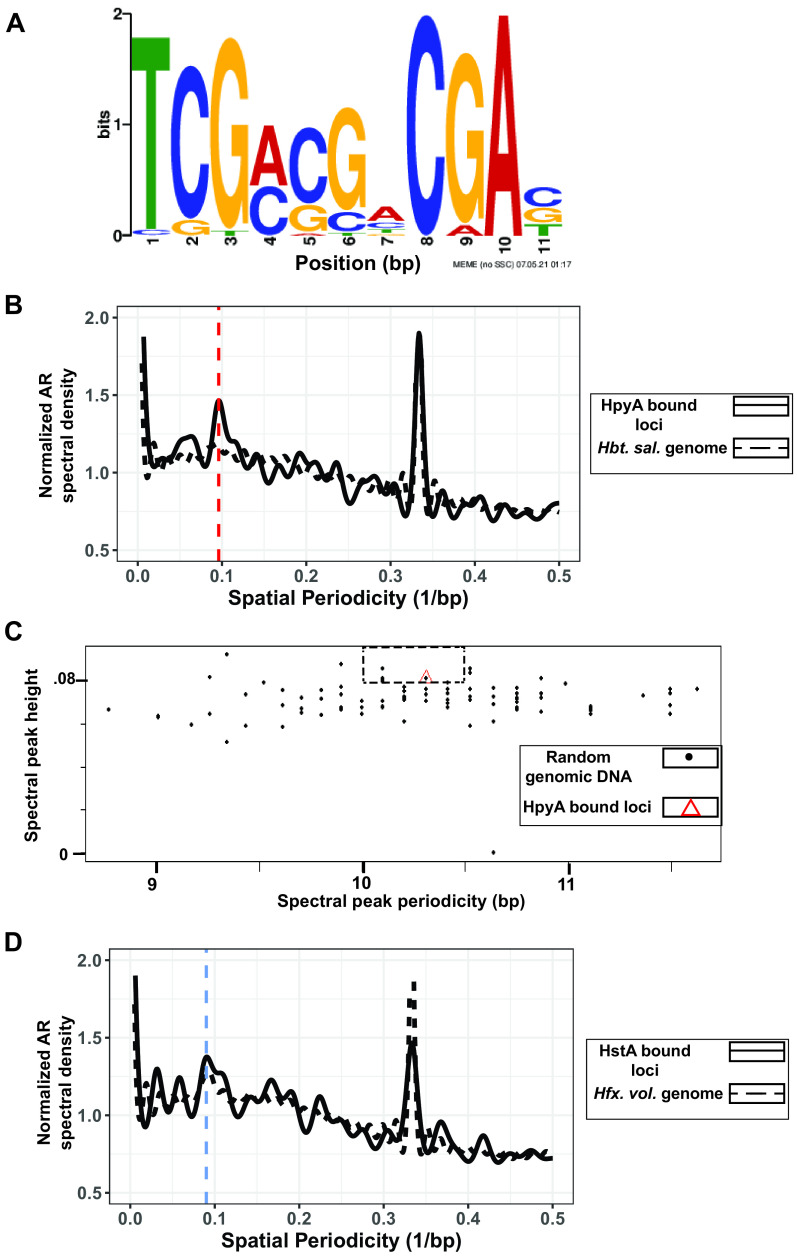
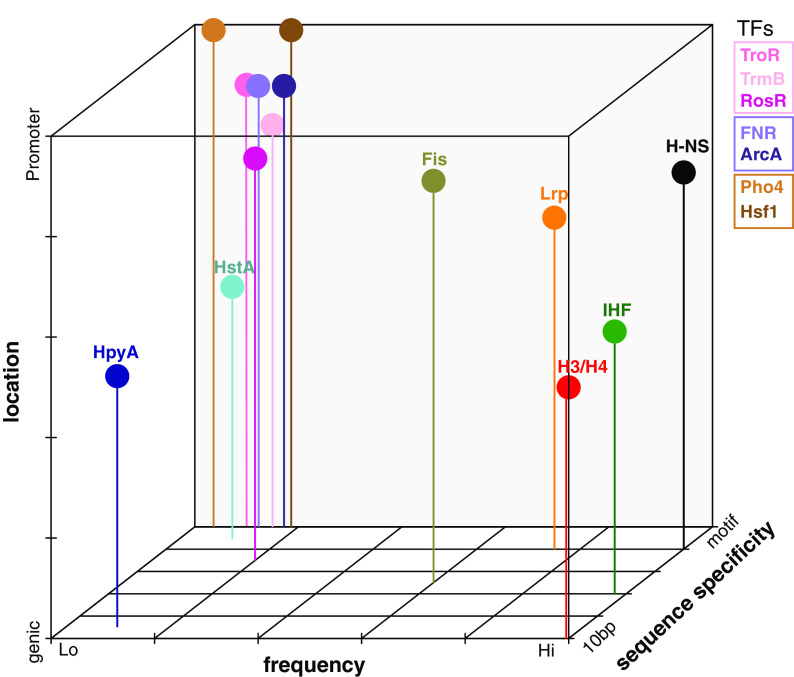
Histone proteins are found across diverse lineages of Archaea, many of which package DNA and form chromatin. However, previous research has led to the hypothesis that the histone-like proteins of high-salt-adapted archaea, or halophiles, function differently. The sole histone protein encoded by the model halophilic species Halobacterium salinarum, HpyA, is nonessential and expressed at levels too low to enable genome-wide DNA packaging. Instead, HpyA mediates the transcriptional response to salt stress. Here we compare the features of genome-wide binding of HpyA to those of HstA, the sole histone of another model halophile, Haloferax volcanii. hstA, like hpyA, is a nonessential gene. To better understand HpyA and HstA functions, protein-DNA binding data (chromatin immunoprecipitation sequencing [ChIP-seq]) of these halophilic histones are compared to publicly available ChIP-seq data from DNA binding proteins across all domains of life, including transcription factors (TFs), nucleoid-associated proteins (NAPs), and histones. These analyses demonstrate that HpyA and HstA bind the genome infrequently in discrete regions, which is similar to TFs but unlike NAPs, which bind a much larger genomic fraction. However, unlike TFs that typically bind in intergenic regions, HpyA and HstA binding sites are located in both coding and intergenic regions. The genome-wide dinucleotide periodicity known to facilitate histone binding was undetectable in the genomes of both species. Instead, TF-like and histone-like binding sequence preferences were detected for HstA and HpyA, respectively. Taken together, these data suggest that halophilic archaeal histones are unlikely to facilitate genome-wide chromatin formation and that their function defies categorization as a TF, NAP, or histone. IMPORTANCE Most cells in eukaryotic species-from yeast to humans-possess histone proteins that pack and unpack DNA in response to environmental cues. These essential proteins regulate genes necessary for important cellular processes, including development and stress protection. Although the histone fold domain originated in the domain of life Archaea, the function of archaeal histone-like proteins is not well understood relative to those of eukaryotes. We recently discovered that, unlike histones of eukaryotes, histones in hypersaline-adapted archaeal species do not package DNA and can act as transcription factors (TFs) to regulate stress response gene expression. However, the function of histones across species of hypersaline-adapted archaea still remains unclear. Here, we compare hypersaline histone function to a variety of DNA binding proteins across the tree of life, revealing histone-like behavior in some respects and specific transcriptional regulatory function in others.

Keywords: archaea; histones; regulation of gene expression.


Conflict of interest statement

The authors declare no conflict of interest.

Figures

FIG 1
FIG 1
HstA is important for growth under optimal conditions. (A) Growth of strains (ΔpyrE, blue; ΔhstA, red; 9 biological replicates with 2 to 3 technical replicates each) measured as optical density (OD600). The heavy lines represent the smoothed conditional mean growth curves; the shaded area surrounding each curve represents the error of the mean. Colors shown in the key are consistent throughout all panels. (B) Logistic growth rate (μ, per hour) of parent versus mutant strain. (C) Lag time (λ, hours). (D) Carrying capacity in stationary phase (OD600). (E) Area under the log-transformed curve (integral). In each graph, each dot represents one technical replicate growth curve. Horizontal lines represent the median of the distribution of points for each strain. Brackets with asterisks show the results of a Welch two-sample t test: ***, P < 0.001; *, P < 0.05.
FIG 2
FIG 2
Genomic features of HpyA and HstA binding sites according to ChIP-seq data. (A) Percentage of genome covered by all ChIP-seq peaks of a given DNA binding protein across domains of life, arranged into columns by domain of life. Dots are colored by protein type as shown in the key. (B) Average width of all ChIP-seq peaks for a given DNA binding protein, arranged into columns by domain of life. (C) Bar graph of ChIP-seq peaks for HpyA, HstA, and transcription factors TrmB, RosR, TroR, FNR, ArcA, Pho4, Hsf1, and Lrp (“Lrp_MINstat” indicates minimal medium stationary-phase conditions). Species names are abbreviated as follows: Hbtsal, Hbt. salinarum; Hvo, Hfx. volcanii; Hca, Hca. hispanica; Hmed, Hfx. mediterranei; Ec, Escherichia coli; Sc, S. cerevisiae. The height of each bar represents the percentage of peaks located in intergenic regions. The dashed red line indicates the percentage of each genome that is noncoding. The intensity of color of the bars represents hypergeometric test P values of significance for enrichment within promoter regions (see key for color scale).
FIG 3
FIG 3
ChIP-seq binding signal for HpyA and HstA compared with TFs, NAPs, and eukaryotic histone. In each panel, chromosome-wide binding patterns (measured as read depth of IP/input) are shown above, and zoomed-in regions of representative peaks are shown below. All archaeal and bacterial genome views depict the main chromosome of each species. (A) Hfx. volcanii HstA (light blue, NCBI accession NC_013967.1, zoom-in peak center located at 1.27 Mb). (B) Hbt. salinarum HpyA (dark blue, NC_002607.1, peak center at 0.51 Mb). (C) Halophilic TF Haloarcula hispanica TrmB (pink, NC_015948.1, peak center at 2.64 Mb). (D) Bacterial TF E. coli FNR (purple, NC_000913.3, peak center at 1.01 Mb). (E) Yeast Saccharomyces cerevisiae Hsf1 (brown, chromosome XVI, NC_01148.4, peak center at 0.988 Mbp). (F) E. coli Lrp (orange, NC_000913.3, peak center at 1.897 Mbp). (G) FIS (olive). (H) E. coli IHF (green). (I) E. coli H-NS (black, peak center at 1.22 Mb). (J) Yeast histone H3 (red, chromosome VII, NC_001139.9). For the TFs and H-NS, known to directly regulate target genes (31, 37, 78), peaks with a known functional role were chosen. For each genome-wide view and zoom-in, the x axis represents chromosomal coordinates in megabase pairs (Mbp), and the y axis represents the read depth ratio of IP to input control (i.e., binding enrichment). Gray dashed lines in the zoom-ins represent a baseline calculated from the average genome-wide IP/input signal; dark red and tan lines below each zoom-in plot represent genomic context (forward and reverse strand genes, respectively). The scale at left indicates the classification of each DNA binding protein pattern based on features of frequency and peak shape.
FIG 4
FIG 4
Binding occupancy at start sites of selected DNA binding proteins. (A) Average binding occupancy across all genes for HstA (light blue, 1 representative replicate from each condition tested) and HpyA (dark blue, 3 replicates, where each line is one replicate). In each panel, the x axis represents distance from start site (base pairs), and the y axis represents average occupancy, as measured by read depth in genomic positions around the start site, normalized to average depth across the genome. (B) Bacterial TFs E. coli ArcA and FlhD (purple) and archaeal TFs Hca. hispanica TrmB, Hfx. volcanii TroR, Hfx. mediterranei RosR (pink, 2 replicates each). (C) Eukaryotic TFs Hsf1 and Pho2 (solid lines) and Pho4 (dashed lines). (D) Yeast histones (red; each line represents a biological replicate experiment).
FIG 5
FIG 5
AA/TT/TA dinucleotide periodicity shows histone-linked pattern. (A) Autoregression (AR) spectra indicating genome-wide dinucleotide periodicity of thermophilic archaeal species with well-characterized histones (Methanothermus fervidus, Thermococcus kodakarensis; red lines), halophilic archaea that encode histones (Hbt. salinarum, Hfx. volcanii, Hfx. mediterranei, Hca. hispanica; black traces), and other prokaryotic species (blue traces) that lack histones (E. coli, Sulfolobus solfataricus) or with nonhistone chromatin (M. mazei). Dashed red line indicates ~10.1-bp periodicity present in histone-utilizing species (red traces); dashed blue line represents ~10.9-bp periodicity (i.e., from supercoiling) detected in some non-histone-utilizing species (blue traces). Note that the strong peak at 0.33 bp−1 (3 bp) seen in all these spectra is linked to codon usage; it is present in all species and is not linked to histone binding (75). (B) Phylogenetic tree of selected archaeal species (with the bacterium E. coli as the outgroup). The first column shows detectable (black) or undetected (white) histone-encoding genes. The second column documents experimental characterization of the function of the encoded histone based on previous publications: compaction (black), noncompaction (white), noncanonical histone function (gray), or not detected (dashed line). The third column indicates the genome-wide AA/TT/TA dinucleotide periodicity: ~10 bp (red), ~11 bp (blue), or no detectable periodicity (white). Species marked with an asterisk (*) indicate high GC content. Only the M. kandleri genome carries the GC periodicity signal (see Fig. S6 at https://doi.org/10.6084/m9.figshare.19391648 for GC periodicity graphs).
FIG 6
FIG 6
Sequence specificity of HpyA and HstA binding. (A) Motif logo of cis-regulatory sequence detected in HstA-bound sites. Bit scores are shown on the y axis and base pair positions on the x axis. Motif logo generated by the MEME suite output (46). (B) The 10.4-bp periodicity is present in HpyA-bound loci (solid black line) but absent in the Hbt. salinarum genome (dashed black line). The vertical red dashed line indicates 10 bp. (C) Comparing randomly chosen regions of the genome (black dots) with the periodicity of the HpyA-bound loci (red triangle). The dashed rectangle includes those randomly chosen sequences that show stronger periodicity than HpyA at relevant levels (10 to 10.5 bp). (D) The ~11-bp frequency of HstA-bound loci (black solid line) matches the periodicity of the entire genome of Hfx. volcanii (black dashed line). The blue dashed line indicates 11 bp.
FIG 7
FIG 7
Visual summary of binding characteristics of selected DNA binding proteins investigated in this study. Binding is classified based on sequence specificity, ranging from preference for 10 bp periodicity (10 bp) to strict cis sequence motif (motif); frequency as measured by genome-wide coverage and number of peaks, ranging from low (Lo) to high (Hi); and location preference, ranging from coding to promoter preference. Figure is qualitative; tick marks and gridlines are intended for visual clarity.

References

    1. Malik HS, Henikoff S. 2003. Phylogenomics of the nucleosome. Nat Struct Mol Biol 10:882–891. doi:10.1038/nsb996. - DOI - PubMed
    1. Laursen SP, Bowerman S, Luger K. 2021. Archaea: the final frontier of chromatin. J Mol Biol 433:166791. doi:10.1016/j.jmb.2020.166791. - DOI - PMC - PubMed
    1. Luger K, Mäder AW, Richmond RK, Sargent DF, Richmond TJ. 1997. Crystal structure of the nucleosome core particle at 2.8 Å resolution. Nature 389:251–260. doi:10.1038/38444. - DOI - PubMed
    1. Arents G, Moudrianakis EN. 1995. The histone fold: a ubiquitous architectural motif utilized in DNA compaction and protein dimerization. Proc Natl Acad Sci USA 92:11170–11174. doi:10.1073/pnas.92.24.11170. - DOI - PMC - PubMed
    1. McKnight JN, Boerma JW, Breeden LL, Tsukiyama T. 2015. Global promoter targeting of a conserved lysine deacetylase for transcriptional shutoff during quiescence entry. Mol Cell 59:732–743. doi:10.1016/j.molcel.2015.07.014. - DOI - PMC - PubMed

Publication types