. 2023 Apr 1;210(7):947-958.
doi: 10.4049/jimmunol.2200920.

Persons with HIV Develop Spike-Specific Lymph Node Germinal Center Responses following SARS-CoV-2 Vaccination

Affiliations

Persons with HIV Develop Spike-Specific Lymph Node Germinal Center Responses following SARS-CoV-2 Vaccination

Michael Quinn et al. J Immunol. .

Abstract

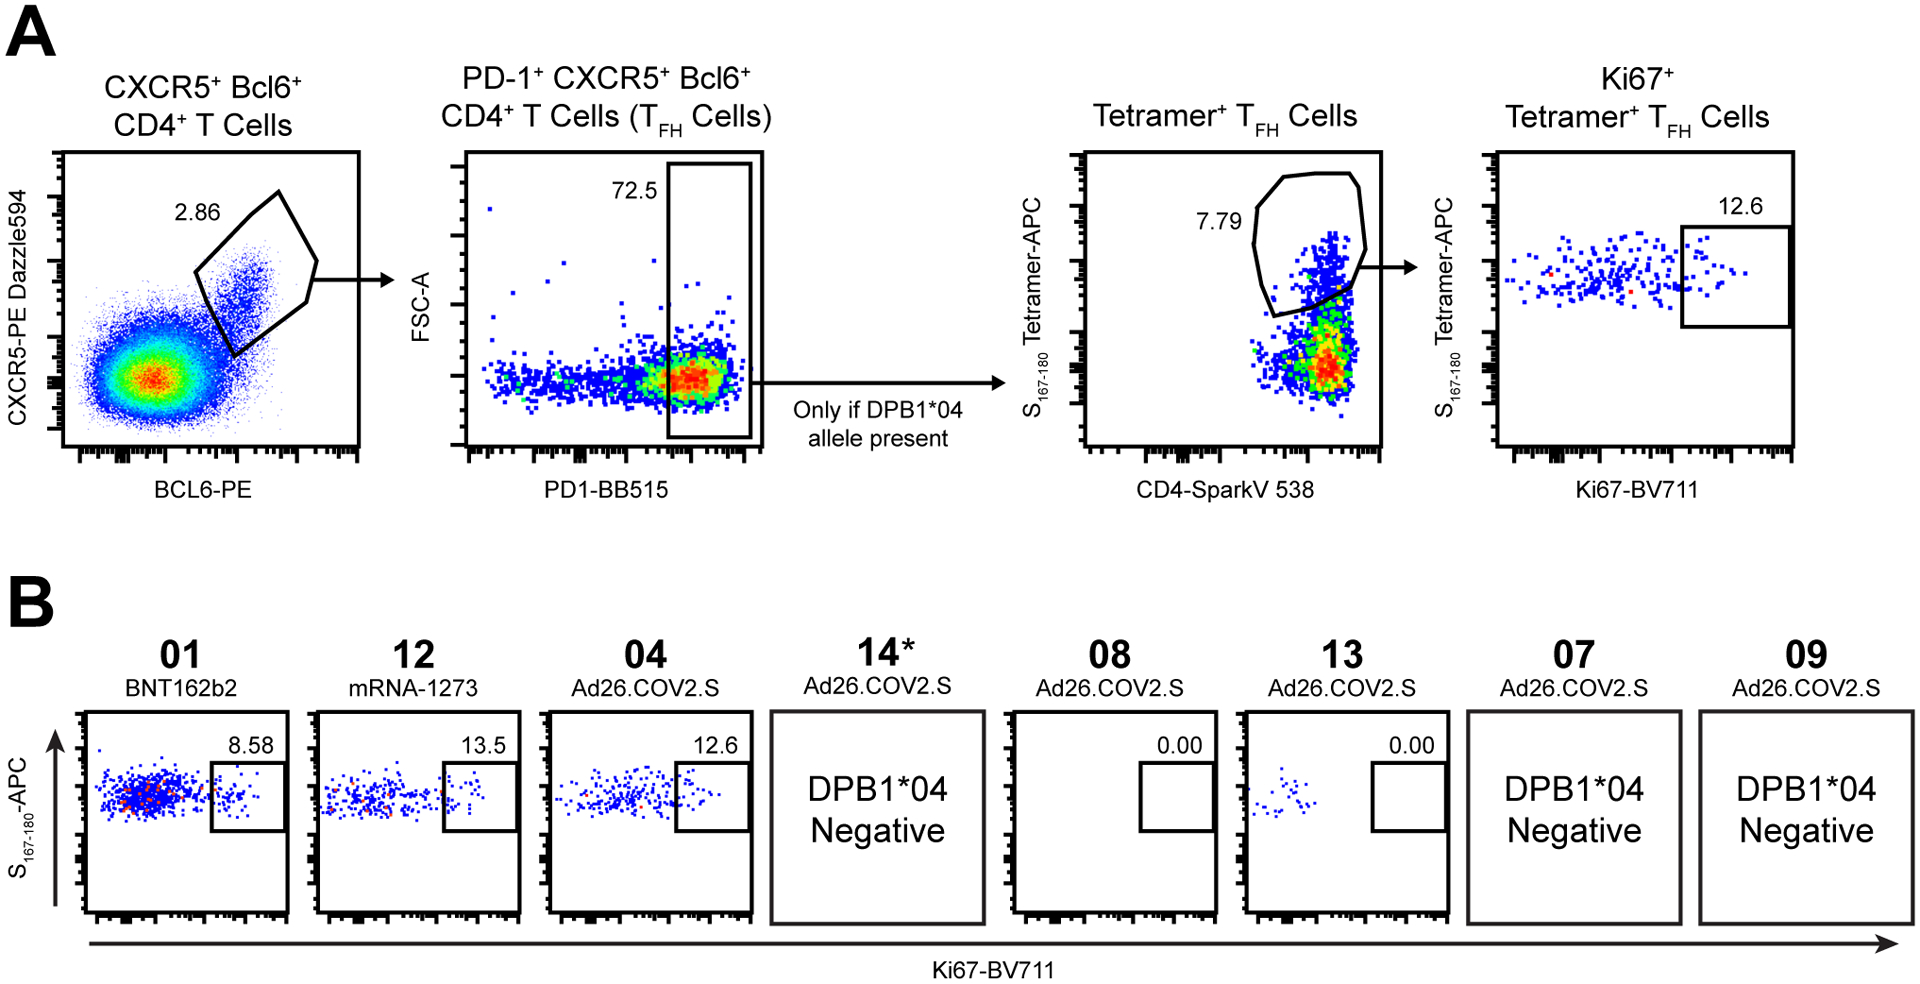
COVID-19 disproportionately affects persons with HIV (PWH) in worldwide locations with limited access to SARS-CoV-2 vaccines. PWH exhibit impaired immune responses to some, but not all, vaccines. Lymph node (LN) biopsies from PWH demonstrate abnormal LN structure, including dysregulated germinal center (GC) architecture. It is not clear whether LN dysregulation prevents PWH from mounting Ag-specific GC responses in the draining LN following vaccination. To address this issue, we longitudinally collected blood and draining LN fine needle aspiration samples before and after SARS-CoV-2 vaccination from a prospective, observational cohort of 11 PWH on antiretroviral therapy: 2 who received a two-dose mRNA vaccine series and 9 who received a single dose of the Ad26.COV2.S vaccine. Following vaccination, we observed spike-specific Abs, spike-specific B and T cells in the blood, and spike-specific GC B cell and T follicular helper cell responses in the LN of both mRNA vaccine recipients. We detected spike-specific Abs in the blood of all Ad26.COV2.S recipients, and one of six sampled Ad26.COV2.S recipients developed a detectable spike-specific GC B and T follicular helper cell response in the draining LN. Our data show that PWH can mount Ag-specific GC immune responses in the draining LN following SARS-CoV-2 vaccination. Due to the small and diverse nature of this cohort and the limited number of available controls, we are unable to elucidate all potential factors contributing to the infrequent vaccine-induced GC response observed in the Ad26.COV2.S recipients. Our preliminary findings suggest this is a necessary area of future research.


Conflict of interest statement

All other authors declare no conflicts of interest exist.

Figures

Figure 1:
Figure 1:. Serologic response to SARS-CoV-2 following vaccination.
(A) Plasma IgG titers against spike protein from WA1/2020 measured by ELISA and (B) Serum neutralization activity against WA1/2020 D614G, B.1.351 or B.1.617.2 measured by Focus Reduction Neutralization Testing (FRNT) were performed on longitudinally collected sera from PWH after SARS-COV-2 vaccination. Dotted line indicated level of detection (LOD). For ELISA, LOD was defined at 15 (1/[starting serum dilution]). For FRNT, LOD was defined at 20 (1/[starting serum dilution]). Open symbols indicate the two participants who received mRNA-based vaccine series. Neutralization assays were only performed on Ad26.COV2.S vaccine recipients. Red symbols indicate evidence of SARS-CoV-2 infection prior to vaccination.
Figure 2:
Figure 2:. Spike (S)-specific B cell response in blood following vaccination.
Longitudinal graphs showing spike-specific (A) plasmablasts or (B) memory B cell responses as a percentage of the total B cell population in the blood of PWH following SARS-CoV-2 vaccination. Cellular populations defined by flow cytometry gating in Supplemental Figure 1. Open symbols indicate the two participants who received mRNA-based vaccine series. Red symbols indicate evidence of SARS-CoV-2 infection prior to vaccination.
Figure 3:
Figure 3:. Spike (S)-specific CD4+ T cell response in blood following vaccination.
(A-top row) Representative flow cytometry plots showing the longitudinal CD4+ T cell tetramer response of two HLA-DPB1*04-restricted tetramers, S167–180 and S816–830, in one participant who expresses HLA-DPB1*04 following SARS-CoV-2 vaccination. Frequency displayed is percent of CD3+CD4+ live single lymphocytes. (A-bottom row) Representative flow cytometry plots of CCR7 and CD45RO expression of either S167–180 (pink) or S816–830 (blue) tetramer-specific CD4+ T cells (each gated on total CD4+ T cells) compared to the total CD4+ T cell population (gray) over time following SARS-CoV-2 vaccination. Longitudinal graphs show (B) S167–180-specific or (C) S816–830-specific CD4+ T cell responses as a percentage of the total CD4+ T cell population in the blood of PWH following SARS-CoV-2 vaccination. Cellular populations defined by flow cytometry gating in Supplemental Figure 1. Open symbols indicate the two participants who received mRNA-based vaccine series. Red symbols indicate evidence of SARS-CoV-2 infection prior to vaccination.
Figure 4:
Figure 4:. Spike (S)-specific GC B cell response in the draining LN following vaccination.
(A) Flow cytometry plots of total GC B cell (frequency displayed is percent of CD19+IgD live single lymphocytes) and spike-specific GC B cell (frequency displayed is percent of total GC B cells) populations before (row 1 and 2, respectively) and after (row 3 and 4, respectively) SARS-CoV-2 vaccination. Post-vaccination responses are from 2 weeks after the final vaccine dose except for participant 14* for whom the shown plots are from 4 weeks post-vaccination. Cellular populations defined by flow cytometry gating in Supplemental Figure 3. An HIV-negative participant received a single dose of Ad26.COV2.S as part of another study that did not include pre-vaccination sampling. (B) Longitudinal graphs for each participant showing total GC (solid) and spike-specific GC (open) B cell responses, both as a percentage of total B cells within the LN of PWH following SARS-CoV-2 vaccination.
Figure 5:
Figure 5:. Spike (S)-specific activated memory B cells in the draining LN following vaccination.
(A) Representative flow cytometry plots from a single participant showing the gating strategy for Ki67 expression within the spike-specific activated memory B cell population following SARS-CoV-2 vaccination. CD20+CD38 B cells gated on CD19+IgD live single lymphocytes, as illustrated in Supplemental Figure 3. Ki67 expression overlayed on spike-specific staining using Heatmap Statistic in FlowJo v.10 (Treestar). (B) Flow cytometry plots of Ki67 expression by Heatmap Statistic overlayed on spike-specific memory B cells following SARS-CoV-2 vaccination. Post-vaccination responses are from 2 weeks after the final vaccine dose except for participant 14* for whom the shown plots are from 4 weeks post-vaccination. An HIV-negative participant received a single dose of Ad26.COV2.S as part of another study that did not include pre-vaccination sampling. Frequency displayed is total spike-specific memory B cell response as percent of total memory B cell population in the LN.
Figure 6:
Figure 6:. Spike (S)-specific TFH response in the draining LN following vaccination.
(A) Row 1 – pre-vaccination CXCR5+Bcl6+CD4+ T cell populations (gated on CD4+CD3+ live single lymphocytes, frequency displayed is percent of CD4+CD3+ live single lymphocytes). Row 2 – pre-vaccination total TFH populations (defined as CXCR5+Bcl6+PD-1+CD4+ T cells, frequency displayed is percent of CXCR5+Bcl6+ population). Row 3 - pre-vaccination S167–180 tetramer+ TFH responses in participants with DPB1*04 (frequency displayed is percent of TFH population). Row 4 – post-vaccination CXCR5+Bcl6+CD4+ T cell populations (frequency same as row 1). Row 5 – post-vaccination total TFH populations (frequency same as row 2). Row 6 - post-vaccination S167–180 tetramer+ TFH responses in participants with DPB1*04 (frequency same as row 3). Cellular populations defined by flow cytometry gating in Supplemental Figure 3. Post-vaccination responses are from 2 weeks after the final vaccine dose except for participant 14* for whom the shown plots are from 4 weeks post-vaccination. (B) Longitudinal graphs for each participant showing total TFH (solid) and S167–180 tetramer-specific TFH (open) cellular responses, both as a percentage of total CD4+ T cells within the LN of PWH following SARS-CoV-2 vaccination.
Figure 7:
Figure 7:. Ki67 expression of spike (S)-specific TFH cells in the draining LN following vaccination.
(A) Representative flow cytometry plots from a single participant showing the gating strategy for Ki67 expression within the S167–180 tetramer+ TFH cell population following SARS-CoV-2 vaccination. CXCR5+Bcl6+ CD4+ T cells gated on CD4+CD3+ live single lymphocytes, as illustrated in Supplemental Figure 3. (B) Flow cytometry plots of Ki67 expression within the S167–180 tetramer response following SARS-CoV-2 vaccination. Post-vaccination responses are from 2 weeks after the final vaccine dose except for participant 14* for whom the shown plots are from 4 weeks post-vaccination. Frequency displayed is percent of tetramer+ TFH cells.

Similar articles

Cited by

References

    1. Polack FP, Thomas SJ, Kitchin N, Absalon J, Gurtman A, Lockhart S, Perez JL, Pérez Marc G, Moreira ED, Zerbini C, Bailey R, Swanson KA, Roychoudhury S, Koury K, Li P, Kalina WV, Cooper D, Frenck RW, Hammitt LL, Türeci Ö, Nell H, Schaefer A, Ünal S, Tresnan DB, Mather S, Dormitzer PR, Şahin U, Jansen KU, Gruber WC, and C. T. G. C4591001. 2020. Safety and Efficacy of the BNT162b2 mRNA Covid-19 Vaccine. N Engl J Med 383: 2603–2615. - PMC - PubMed
    1. Baden LR, El Sahly HM, Essink B, Kotloff K, Frey S, Novak R, Diemert D, Spector SA, Rouphael N, Creech CB, McGettigan J, Khetan S, Segall N, Solis J, Brosz A, Fierro C, Schwartz H, Neuzil K, Corey L, Gilbert P, Janes H, Follmann D, Marovich M, Mascola J, Polakowski L, Ledgerwood J, Graham BS, Bennett H, Pajon R, Knightly C, Leav B, Deng W, Zhou H, Han S, Ivarsson M, Miller J, Zaks T, and COVE SG. 2021. Efficacy and Safety of the mRNA-1273 SARS-CoV-2 Vaccine. N Engl J Med 384: 403–416. - PMC - PubMed
    1. Sadoff J, Gray G, Vandebosch A, Cárdenas V, Shukarev G, Grinsztejn B, Goepfert PA, Truyers C, Fennema H, Spiessens B, Offergeld K, Scheper G, Taylor KL, Robb ML, Treanor J, Barouch DH, Stoddard J, Ryser MF, Marovich MA, Neuzil KM, Corey L, Cauwenberghs N, Tanner T, Hardt K, Ruiz-Guiñazú J, Le Gars M, Schuitemaker H, Van Hoof J, Struyf F, Douoguih M, and ENSEMBLE SG. 2021. Safety and Efficacy of Single-Dose Ad26.COV2.S Vaccine against Covid-19. N Engl J Med 384: 2187–2201. - PMC - PubMed
    1. Ambrosioni J, Blanco JL, Reyes-Urueña JM, Davies MA, Sued O, Marcos MA, Martínez E, Bertagnolio S, Alcamí J, Miro JM, and I. H. I. V. I. COVID-19. 2021. Overview of SARS-CoV-2 infection in adults living with HIV. Lancet HIV 8: e294–e305. - PMC - PubMed
    1. Dandachi D, Geiger G, Montgomery MW, Karmen-Tuohy S, Golzy M, Antar AAR, Llibre JM, Camazine M, Díaz-De Santiago A, Carlucci PM, Zacharioudakis IM, Rahimian J, Wanjalla CN, Slim J, Arinze F, Kratz AMP, Jones JL, Patel SM, Kitchell E, Francis A, Ray M, Koren DE, Baddley JW, Hill B, Sax PE, and Chow J. 2021. Characteristics, Comorbidities, and Outcomes in a Multicenter Registry of Patients With Human Immunodeficiency Virus and Coronavirus Disease 2019. Clin Infect Dis 73: e1964–e1972. - PMC - PubMed

Publication types