. 2023 Apr 14;83(8):1214-1233.
doi: 10.1158/0008-5472.CAN-22-1769.

Single-Cell Discovery and Multiomic Characterization of Therapeutic Targets in Multiple Myeloma

Affiliations

Single-Cell Discovery and Multiomic Characterization of Therapeutic Targets in Multiple Myeloma

Lijun Yao et al. Cancer Res. .

Abstract

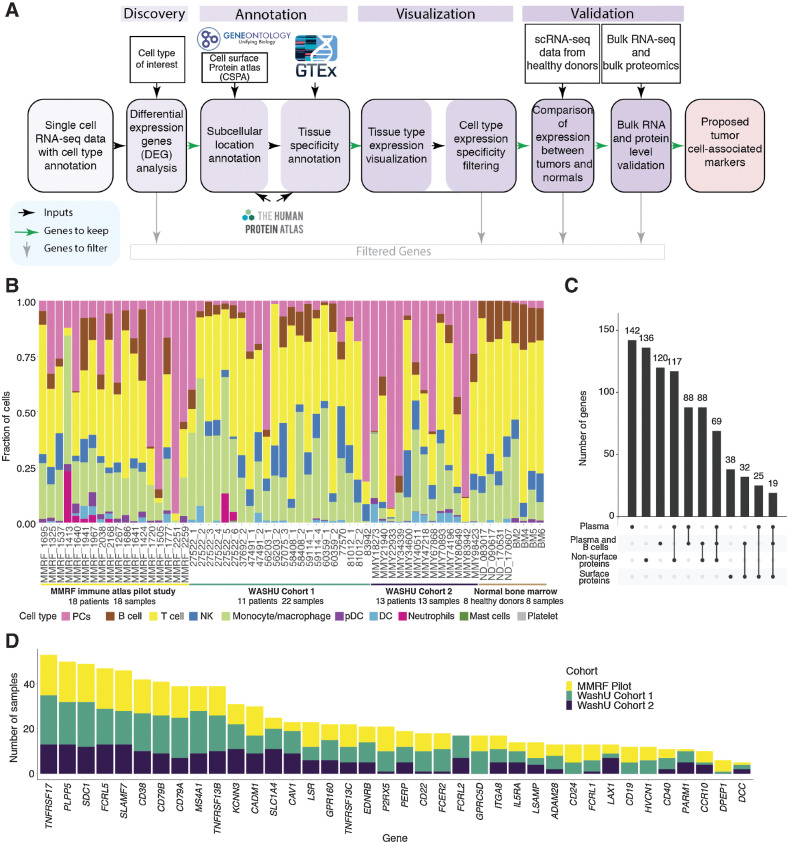
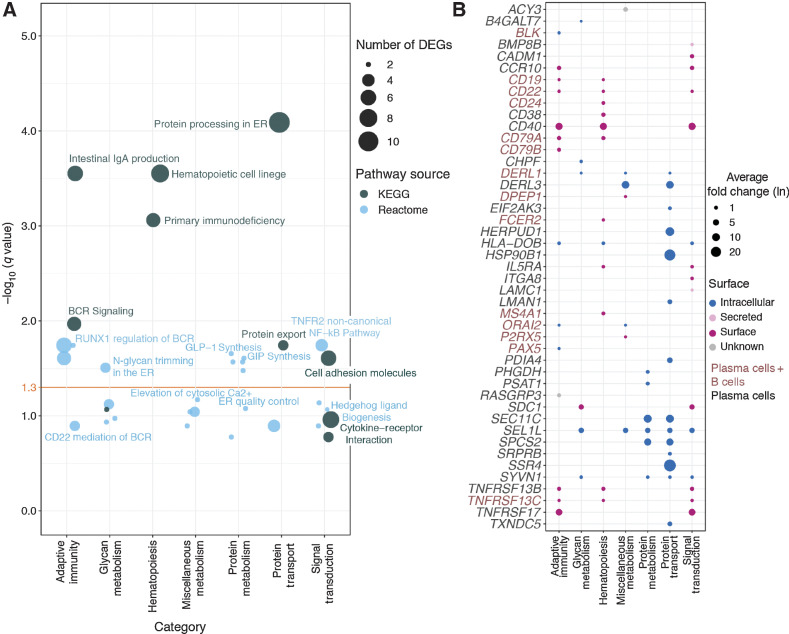
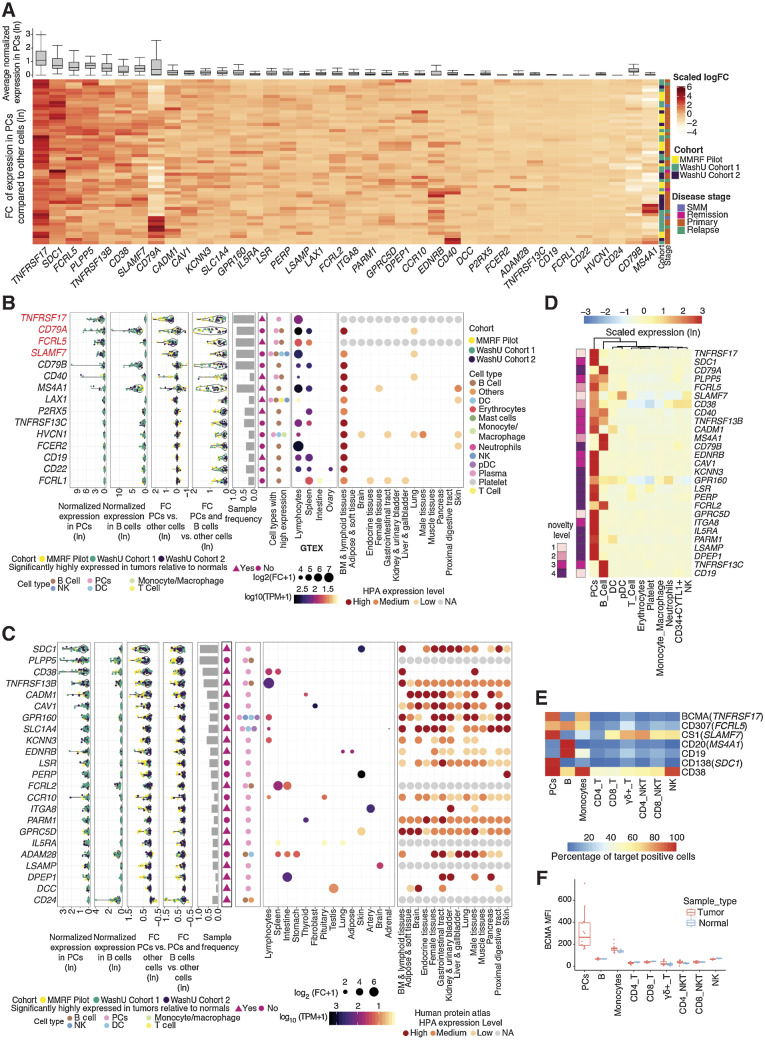
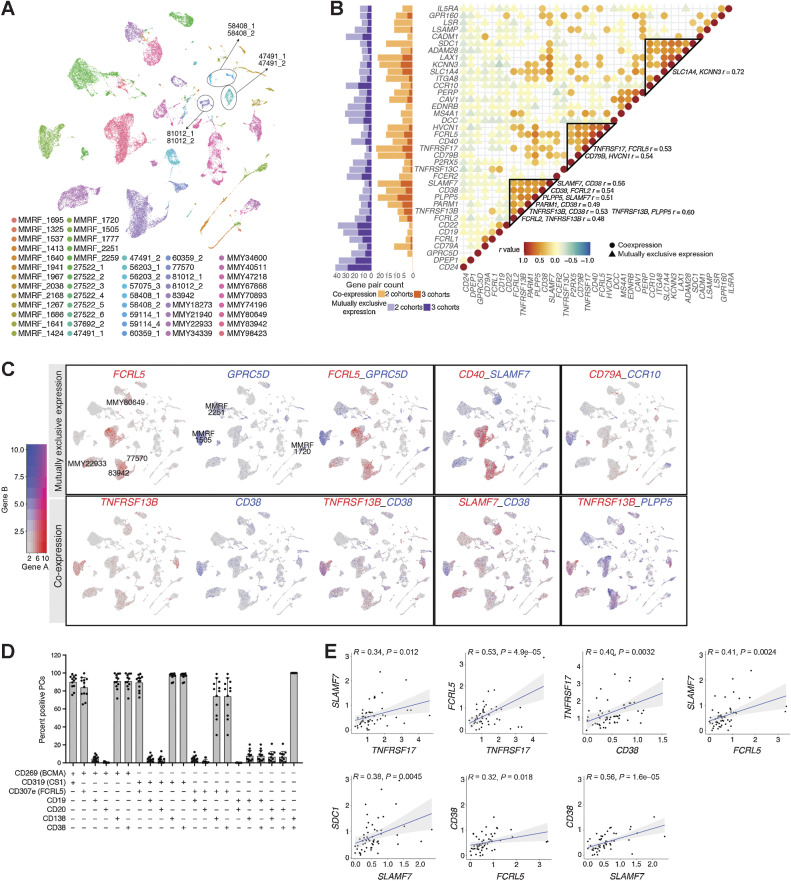
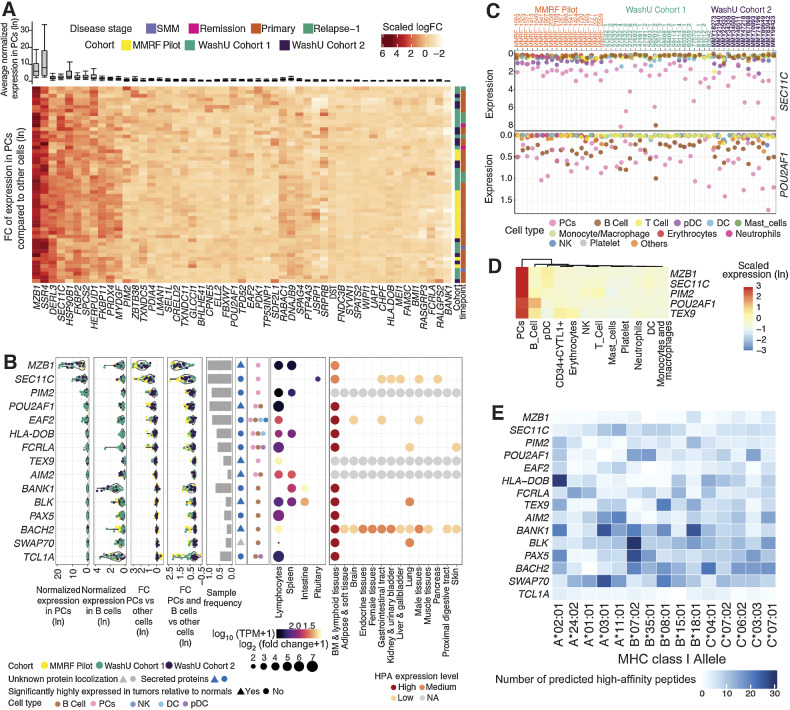
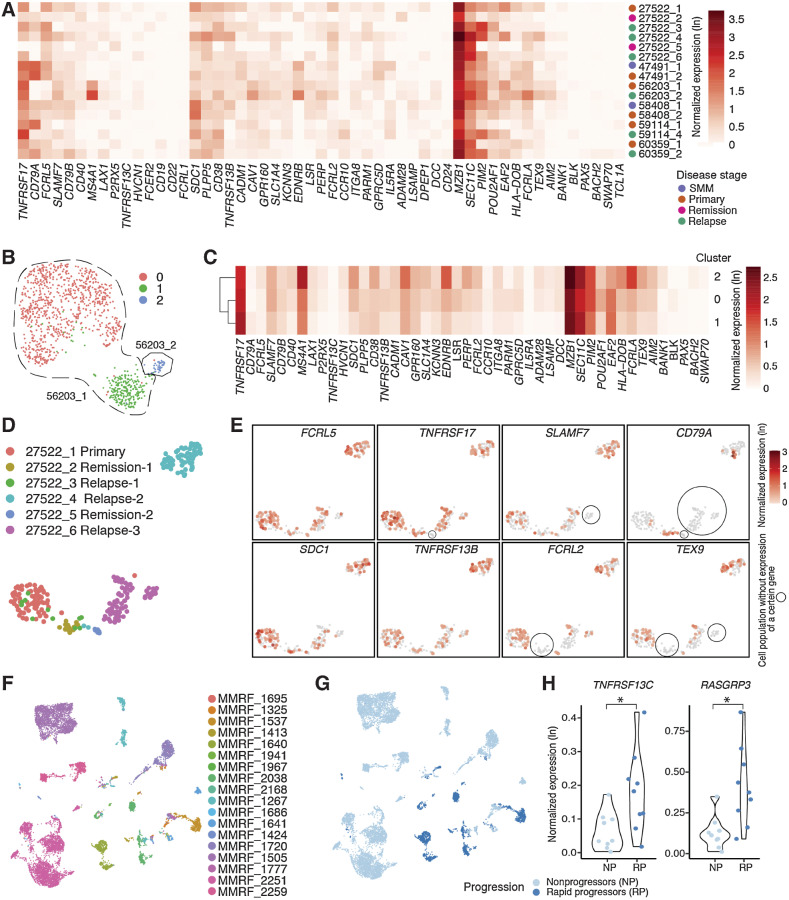
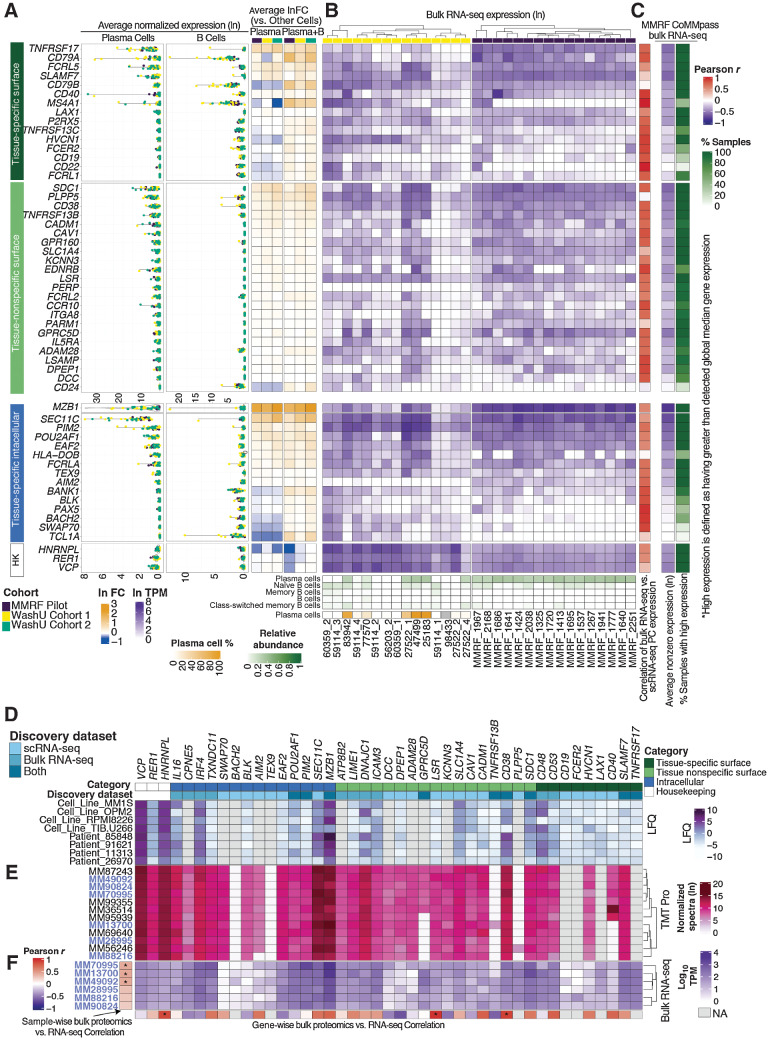
Multiple myeloma (MM) is a highly refractory hematologic cancer. Targeted immunotherapy has shown promise in MM but remains hindered by the challenge of identifying specific yet broadly representative tumor markers. We analyzed 53 bone marrow (BM) aspirates from 41 MM patients using an unbiased, high-throughput pipeline for therapeutic target discovery via single-cell transcriptomic profiling, yielding 38 MM marker genes encoding cell-surface proteins and 15 encoding intracellular proteins. Of these, 20 candidate genes were highlighted that are not yet under clinical study, 11 of which were previously uncharacterized as therapeutic targets. The findings were cross-validated using bulk RNA sequencing, flow cytometry, and proteomic mass spectrometry of MM cell lines and patient BM, demonstrating high overall concordance across data types. Independent discovery using bulk RNA sequencing reiterated top candidates, further affirming the ability of single-cell transcriptomics to accurately capture marker expression despite limitations in sample size or sequencing depth. Target dynamics and heterogeneity were further examined using both transcriptomic and immuno-imaging methods. In summary, this study presents a robust and broadly applicable strategy for identifying tumor markers to better inform the development of targeted cancer therapy.

Significance: Single-cell transcriptomic profiling and multiomic cross-validation to uncover therapeutic targets identifies 38 myeloma marker genes, including 11 transcribing surface proteins with previously uncharacterized potential for targeted antitumor therapy.


Figures

Figure 1. Myeloma cell–associated therapeutic protein discovery workflow, data sets, and overview. A, Tumor cell–associated therapeutic protein discovery pipeline. B, Stacked bar plot of cell type fractions for each sample, including both tumor BM samples for discovery and normal BM samples for validation. Bar segments are colored by cell types, grouped by data sets. C, Overview of plasma-specific genes and combined plasma and B specific genes, intersections of the two as well as their cellular localization. D, Stacked bar charts showing number of samples with differentially expressed surface proteins in plasma and/or B cells compared with other cell types, colored by data sets.
Figure 1.
Myeloma cell–associated therapeutic protein discovery workflow, data sets, and overview. A, Tumor cell–associated therapeutic protein discovery pipeline. B, Stacked bar plot of cell type fractions for each sample, including both tumor BM samples for discovery and normal BM samples for validation. Bar segments are colored by cell types, grouped by data sets. C, Overview of plasma-specific genes and combined plasma and B-specific genes, intersections of the two as well as their cellular localization. D, Stacked bar charts showing number of samples with differentially expressed surface proteins in plasma and/or B cells compared with other cell types, colored by data sets.
Figure 2. Pathway overrepresentation analysis of plasma and B cell marker genes using the Kegg and Reactome databases. A, Bubble plot of significantly enriched pathways identified via overrepresentation analysis. Pathways are binned into functional categories and plotted by significance (−log10 of FDR, q); bubble size indicates the number of genes called in the enrichment result. Yellow horizontal line indicates a 5% significance threshold. DEG = differentially expressed genes; ER = endoplasmic reticulum; GIP = gastric inhibitory polypeptide; GLP = glucagon-like peptide; BCR = B-cell receptor. B, Bubble plot of fold change and cellular localization of differentially expressed plasma and B cell genes identified as functionally relevant by pathway enrichment. Bubble size indicates fold change (ln) of gene expression in either plasma cells or combined plasma and B cells (as indicated by gene name color) relative to other BM cells; color denotes predicted cellular localization of the encoded protein.
Figure 2.
Pathway overrepresentation analysis of plasma and B-cell marker genes using the KEGG and Reactome databases. A, Bubble plot of significantly enriched pathways identified via overrepresentation analysis. Pathways are binned into functional categories and plotted by significance (−log10 of FDR, q); bubble size indicates the number of genes called in the enrichment result. Yellow horizontal line indicates a 5% significance threshold. DEG, differentially expressed genes; ER, endoplasmic reticulum; GIP, gastric inhibitory polypeptide; GLP, glucagon-like peptide; BCR, B-cell receptor. B, Bubble plot of fold change and cellular localization of differentially expressed plasma and B-cell genes identified as functionally relevant by pathway enrichment. Bubble size indicates fold change (ln) of gene expression in either plasma cells or combined plasma and B cells (as indicated by gene name color) relative to other BM cells; color denotes predicted cellular localization of the encoded protein.
Figure 3. Characterization of myeloma cell–associated surface proteins. A, Average gene expression in plasma cells (top: box and whisker plot) and hierarchical clustering of z-score scaled log fold change between plasma and nonplasma cells across samples (bottom: heat map). B, Summarized characterization of primary candidate targets expressed on the cell surface with specific expression in lymphoid tissues. Genes are ordered by average expression in PCs. Top 4 genes are top-tier primary targets, highlighted in red. Average normalized expression in plasma and B cells are shown in the first 2 sections, respectively. Average expression log fold change between PCs and other cells is shown in the third section followed by expression log fold change of combined plasma and B cells compared with other cells shown in the fourth section (FC: fold change). Each dot represents a sample, colored by its corresponding cohort. Sample frequency is the proportion of samples having genes differentially expressed in PCs or in combined plasma and B-cell population if the gene is only expressed in B cells. In the sixth section, triangle and circle denote whether genes are significantly highly expressed in tumors relative to normal BMs. Cell types with target expression are annotated in the seventh section. In the GTEx tissue expression specificity analysis section, only gene-tissue type relationships with a significant FDR are plotted. Size corresponds to fold difference and colored by expression. HPA protein expression was shown in the last section with color indicating expression level. NA = not available; TPM = transcript per million; BM = bone marrow. C, Summarized characterization of secondary candidate targets expressed on the cell surface without specific expression in lymphoid tissues. Figure layout is the same as B. D, Heat map showing the z-score scaled average expression of known and novel targets across cell populations in scRNA-seq. Columns are ordered based on the hierarchical clustering of target expressions; rows are ordered by average normalized expression in plasma cells. Left annotation indicates novelty level: (1) currently under clinical study as CAR-based therapy; (2) currently under clinical study as antibody-based therapy; (3) potential therapeutic utility is supported by existing literature; (4) previously uncharacterized in its capacity as a myeloma marker. Further details for novelty ranking are included in Supplementary Table S2. E, Heat map showing the average percentage of cells with positive expression of surface antigens across cell populations from 12 patient samples (11 MM and 1 SMM patients) in flow cytometry. F, Box plot showing mean fluorescence intensity (MFI) of BCMA in patient BMMC (n = 12, including 11 MM and 1 SMM) or PBMC from healthy donors (n = 3) across cell populations in flow cytometry.
Figure 3.
Characterization of myeloma cell–associated surface proteins. A, Average gene expression in plasma cells (top, box and whisker plot) and hierarchical clustering of z-score scaled log-fold change between plasma and nonplasma cells across samples (bottom, heat map). B, Summarized characterization of primary candidate targets expressed on the cell surface with specific expression in lymphoid tissues. Genes are ordered by average expression in PCs. Top four genes are top-tier primary targets, highlighted in red. Average normalized expression in plasma and B cells are shown in the first two sections, respectively. Average expression log-fold change between PCs and other cells is shown in the third section, followed by expression log-fold change of combined plasma and B cells compared with other cells shown in the fourth section (FC, fold change). Each dot represents a sample, colored by its corresponding cohort. Sample frequency is the proportion of samples having genes differentially expressed in PCs or in combined plasma and B-cell population if the gene is only expressed in B cells. In the sixth section, triangle and circle denote whether genes are significantly highly expressed in tumors relative to normal BMs. Cell types with target expression are annotated in the seventh section. In the GTEx tissue expression specificity analysis section, only gene-tissue type relationships with a significant FDR are plotted. Size corresponds to fold difference and is colored by expression. HPA protein expression was shown in the last section, with color indicating expression level. NA, not available. C, Summarized characterization of secondary candidate targets expressed on the cell surface without specific expression in lymphoid tissues. Figure layout is the same as B. D, Heat map showing the z-score scaled average expression of known and novel targets across cell populations in scRNA-seq. Columns are ordered based on the hierarchical clustering of target expressions; rows are ordered by average normalized expression in plasma cells. Left annotation indicates novelty level: 1, currently under clinical study as CAR-based therapy; 2, currently under clinical study as antibody-based therapy; 3, potential therapeutic utility is supported by existing literature; 4, previously uncharacterized in its capacity as a myeloma marker. Further details for novelty ranking are included in Supplementary Table S2. E, Heat map showing the average percentage of cells with positive expression of surface antigens across cell populations from 12 patient samples (11 MM and 1 SMM patients) in flow cytometry. F, Box plot showing mean fluorescence intensity (MFI) of BCMA in patient BMMC (n = 12, including 11 MM and 1 SMM) or PBMC from healthy donors (n = 3) across cell populations in flow cytometry.
Figure 4. Expression correlation of myeloma cell–associated genes encoding surface proteins. A, UMAP showing plasma cells from 53 patients reveal tumor-specific clusters, colored by patient. B, Dot plots showing correlation of gene expression averaged by sample in all 53 samples, colored by Pearson correlation coefficient (r value). Only predicted coexpressed gene pairs (r>0.30) and mutually exclusively expressed gene pairs (r<0.05) are shown. Coexpressed gene groups are highlighted in triangles with visually confirmed ones listed on the right. Bar charts showing the number of predicted gene pairs (r<0.05 or r>0.30) in 2 data sets or 3 data sets. C, Gene pairs showing mutually exclusive expressions (top row) or coexpressions (bottom row). The first box of each row shows an example of expression of gene A (first UMAP), expression of gene B (second UMAP), and dual expression of gene A and gene B (third UMAP). D, Bar chart showing the percentage of plasma cells from 12 patient samples (11 MM and 1 SMM) with coexpression of surface proteins detected by flow cytometry. E, Pearson correlation plots of gene pair (same genes shown in D) expression in scRNA-seq.
Figure 4.
Expression correlation of myeloma cell–associated genes encoding surface proteins. A, UMAP showing plasma cells from 53 patients reveals tumor-specific clusters, colored by patient. B, Dot plots showing correlation of gene expression averaged by sample in all 53 samples, colored by Pearson correlation coefficient (r value). Only predicted coexpressed gene pairs (r > 0.30) and mutually exclusively expressed gene pairs (r < 0.05) are shown. Coexpressed gene groups are highlighted in triangles, with visually confirmed ones listed on the right. Bar charts showing the number of predicted gene pairs (r < 0.05 or r > 0.30) in two data sets or three data sets. C, Gene pairs showing mutually exclusive expressions (top row) or coexpressions (bottom row). The first box of each row shows an example of expression of gene A (first UMAP), expression of gene B (second UMAP), and dual expression of gene A and gene B (third UMAP). D, Bar chart showing the percentage of plasma cells from 12 patient samples (11 MM and 1 SMM), with coexpression of surface proteins detected by flow cytometry. E, Pearson correlation plots of gene pair (same genes shown in D) expression in scRNA-seq.
Figure 5. Characterization of myeloma cell–associated intracellular proteins. A, Average gene expression in plasma cells (PC) shown in box and whisker plot (top) and hierarchical clustering of z-score scaled log fold change (bottom) between plasma and nonplasma cells across samples shown in heat map. B, Summarized characterization of intracellular targets specifically expressed in lymphoid tissues. Genes are ordered by average expression in PCs. Average normalized expression in plasma and B cells is shown in the first 2 sections, respectively. Average expression log fold change between PCs and other cells is shown in the third section followed by expression log fold change of combined plasma and B cells compared with other cells shown in the fourth section (FC: fold change). Each dot represents a sample, colored by its corresponding cohort. Sample frequency is the proportion of samples having genes differentially expressed in PCs or in combined plasma and B-cell population if the gene is only expressed in B cells. In the sixth section, triangle and circle denote whether genes are significantly highly expressed in tumors relative to normal BMs. Secreted proteins in blue. Unknown protein localization in gray. Cell types with target expression are annotated in the seventh section. In the GTEx tissue expression specificity analysis section, only gene–tissue type relationships with a significant FDR are plotted. Size corresponds to fold difference and colored by expression. HPA protein expression was shown in the last section with color indicating expression level. NA = not available; TPM = transcript per million; BM = bone marrow. C, Bubble plots showing the normalized expression of SEC11C and POU2AF1 averaged by sample and cell type. D, Heat map showing the z-score scaled average expression of promising intracellular targets across cell populations in scRNA-seq. Columns are ordered based on the hierarchical clustering of target expressions. E, Number of peptides for each candidate gene product predicted to have high-affinity binding to common MHC class I alleles in the US population as determined by NetMHC.
Figure 5.
Characterization of myeloma cell–associated intracellular proteins. A, Average gene expression in PCs shown in box and whisker plot (top) and hierarchical clustering of z-score scaled log-fold change (bottom) between plasma and nonplasma cells across samples shown in heat map. B, Summarized characterization of intracellular targets specifically expressed in lymphoid tissues. Genes are ordered by average expression in PCs. Average normalized expression in plasma and B cells is shown in the first two sections, respectively. Average expression log-fold change between PCs and other cells is shown in the third section, followed by expression log-fold change of combined plasma and B cells compared with other cells shown in the fourth section. FC, fold change. Each dot represents a sample, colored by its corresponding cohort. Sample frequency is the proportion of samples having genes differentially expressed in PCs or in combined plasma and B-cell population if the gene is only expressed in B cells. In the sixth section, triangle and circle denote whether genes are significantly highly expressed in tumors relative to normal BMs. Blue, secreted proteins. Gray, unknown protein localization. Cell types with target expression are annotated in the seventh section. In the GTEx tissue expression specificity analysis section, only gene–tissue type relationships with a significant FDR are plotted. Size corresponds to fold difference and is colored by expression. HPA protein expression is shown in the last section, with color indicating expression level. NA, not available. C, Bubble plots showing the normalized expression of SEC11C and POU2AF1 averaged by sample and cell type. D, Heat map showing the z-score scaled average expression of promising intracellular targets across cell populations in scRNA-seq. Columns are ordered based on the hierarchical clustering of target expressions. E, Number of peptides for each candidate gene product predicted to have high-affinity binding to common MHC class I alleles in the US population as determined by NetMHC.
Figure 6. Expression of myeloma cell–associated therapeutic targets in relation to clinical features. A, Heat map showing normalized expression of candidate targets across longitudinal samples. Different disease stages are annotated in different colors on the right of the heat map. B, UMAP showing plasma cells from samples taken at two different stages of patient 56203, colored by seurat clusters. C, Heat map showing normalized expression of candidate targets across three plasma populations in patient 56203. Genes detected in fewer than 5 cells are not considered during normalization and thus were not included in the heat map. D, UMAP showing plasma cells from samples taken at six different time points of patient 27522, colored by sample. E, Expression of typical myeloma cell–associated therapeutic targets reveals diverse and dynamic change of gene expression along the disease progression in the same patient. F, UMAP showing plasma cells from samples in MMRF Immune Atlas Pilot study, colored by patient. G, UMAP showing plasma cells from samples in MMRF Immune Atlas Pilot study, colored by patients’ progression features. H, Violin plots showing expression of TNFRSF13C and RASGRP3 are significantly elevated in rapid progressors compared with nonprogressors (P < 0.05).
Figure 6.
Expression of myeloma cell–associated therapeutic targets in relation to clinical features. A, Heat map showing normalized expression of candidate targets across longitudinal samples. Different disease stages are annotated in different colors on the right of the heat map. B, UMAP showing plasma cells from samples taken at two different stages of patient 56203, colored by seurat clusters. C, Heat map showing normalized expression of candidate targets across three plasma populations in patient 56203. Genes detected in fewer than five cells were not considered during normalization and thus were not included in the heat map. D, UMAP showing plasma cells from samples taken at six different time points of patient 27522, colored by sample. E, Expression of typical myeloma cell–associated therapeutic targets reveals diverse and dynamic change of gene expression along the disease progression in the same patient. F, UMAP showing plasma cells from samples in MMRF Immune Atlas Pilot study, colored by patient. G, UMAP showing plasma cells from samples in MMRF Immune Atlas Pilot study, colored by patients’ progression features. H, Violin plots showing expression of TNFRSF13C and RASGRP3 is significantly elevated in rapid progressors compared with nonprogressors (P < 0.05).
Figure 7. Comparison of scRNA-seq, bulk RNA-seq, and bulk proteomic expression of candidate targets. A, Average normalized expression (ln) and average fold change (ln) of target genes across scRNA-seq discovery cohorts. HK: Housekeeping genes. B, Unsorted bulk RNA-seq expression of WashU Cohort 1 and CD138+ sorted bulk RNA-seq of the MMRF Immune Atlas Pilot Cohort. XCell deconvolution of plasma and B cell relative abundance is shown along the bottom. Plasma cell percentages from matching scRNA-seq data is shown for WashU Cohort 1. Correlations between plasma cell expression (scRNA) and bulk CD138+ expression of each gene for MMRF Pilot samples are shown in the rightmost column. C, Average nonzero expression and expression prevalence across MMRF CoMMpass bulk RNA-seq. Expression prevalence is defined as a percentage of all samples wherein target expression is higher than global median nonzero gene expression. D, Bulk protein expression of target gene products assayed via label-free proteome; LFQ values were analyzed by MaxQuant, Log2 transformed and subsequently internally normalized with missing values imputed. E, Bulk protein expression of target gene products assayed via TMT Pro; TMT intensities were analyzed by MaxQuant, Ln transformed, and internally normalized. F, Bulk RNA expression of 6 samples (names identified in purple) concurrently processed via TMT Pro. Sample-wise RNA-vs.-protein correlations across all target genes shown is displayed along the Y-axis; gene-wise RNA-vs.-protein correlations across samples is displayed along the X-axis.
Figure 7.
Comparison of scRNA-seq, bulk RNA-seq, and bulk proteomic expression of candidate targets. A, Average normalized expression (ln) and average fold change (ln) of target genes across scRNA-seq discovery cohorts. HK, housekeeping genes. B, Unsorted bulk RNA-seq expression of WashU Cohort 1 and CD138+-sorted bulk RNA-seq of the MMRF Immune Atlas Pilot Cohort. XCell deconvolution of plasma and B-cell relative abundance is shown along the bottom. Plasma cell percentages from matching scRNA-seq data is shown for WashU Cohort 1. Correlations between plasma cell expression (scRNA) and bulk CD138+ expression of each gene for MMRF Pilot samples are shown in the rightmost column. C, Average nonzero expression and expression prevalence across MMRF CoMMpass bulk RNA-seq. Expression prevalence is defined as a percentage of all samples wherein target expression is higher than global median nonzero gene expression. D, Bulk protein expression of target gene products assayed via label-free proteome; LFQ values were analyzed by MaxQuant, Log2 transformed, and subsequently internally normalized with missing values imputed. E, Bulk protein expression of target gene products assayed via TMT Pro; TMT intensities were analyzed by MaxQuant, Ln transformed, and internally normalized. F, Bulk RNA expression of 6 samples (names identified in purple) concurrently processed via TMT Pro. Sample-wise RNA-vs.-protein correlations across all target genes shown is displayed along the y-axis; gene-wise RNA vs. protein correlations across samples is displayed along the x-axis.

References

    1. June CH, Sadelain M. Chimeric antigen receptor therapy. N Engl J Med 2018;379:64–73. - PMC - PubMed
    1. Franssen LE, Mutis T, Lokhorst HM, van de Donk NWCJ. Immunotherapy in myeloma: how far have we come? Ther Adv Hematol 2019;10:2040620718822660. - PMC - PubMed
    1. Filley AC, Henriquez M, Dey M. CART immunotherapy: development, success, and translation to malignant gliomas and other solid tumors. Front Oncol 2018;8:453. - PMC - PubMed
    1. Drent E, Poels R, Mulders MJ, van de Donk NWCJ, Themeli M, Lokhorst HM, et al. . Feasibility of controlling CD38-CAR T cell activity with a Tet-on inducible CAR design. PLoS One 2018;13:e0197349. - PMC - PubMed
    1. Gogishvili T, Danhof S, Prommersberger S, Rydzek J, Schreder M, Brede C, et al. . SLAMF7-CAR T cells eliminate myeloma and confer selective fratricide of SLAMF7+ normal lymphocytes. Blood 2017;130:2838–47. - PubMed

Publication types

Substances