. 2023 Feb 13:12:e82112.
doi: 10.7554/eLife.82112.

Csf1 from marrow adipogenic precursors is required for osteoclast formation and hematopoiesis in bone

Affiliations

Csf1 from marrow adipogenic precursors is required for osteoclast formation and hematopoiesis in bone

Leilei Zhong et al. Elife. .

Abstract

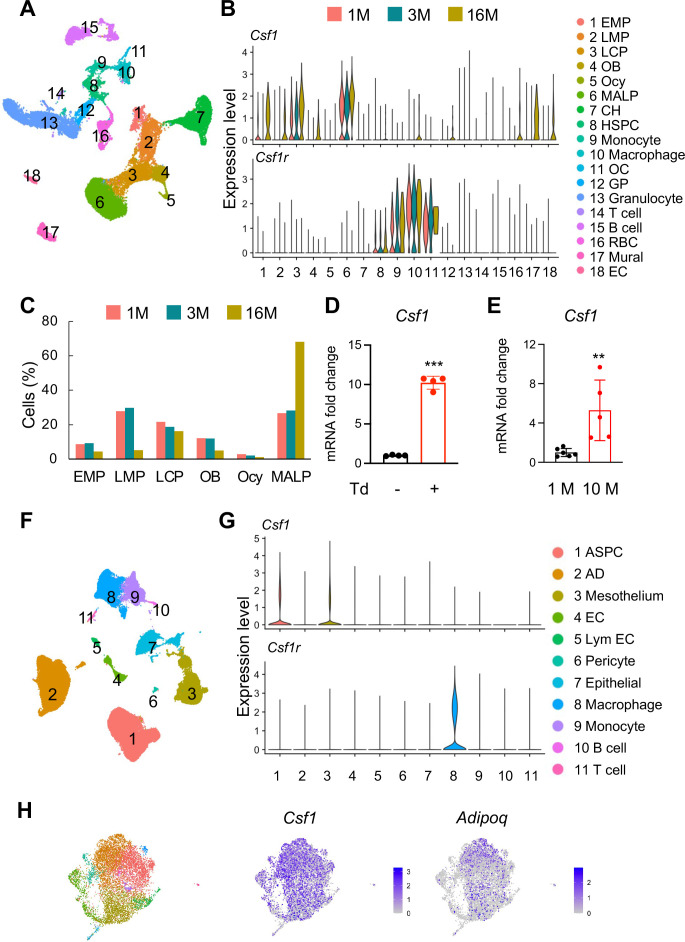
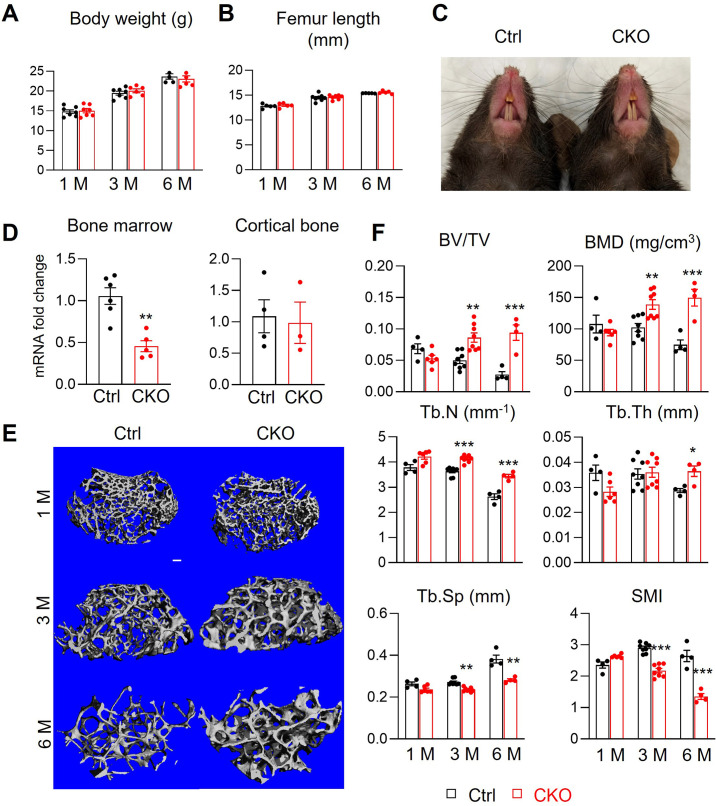
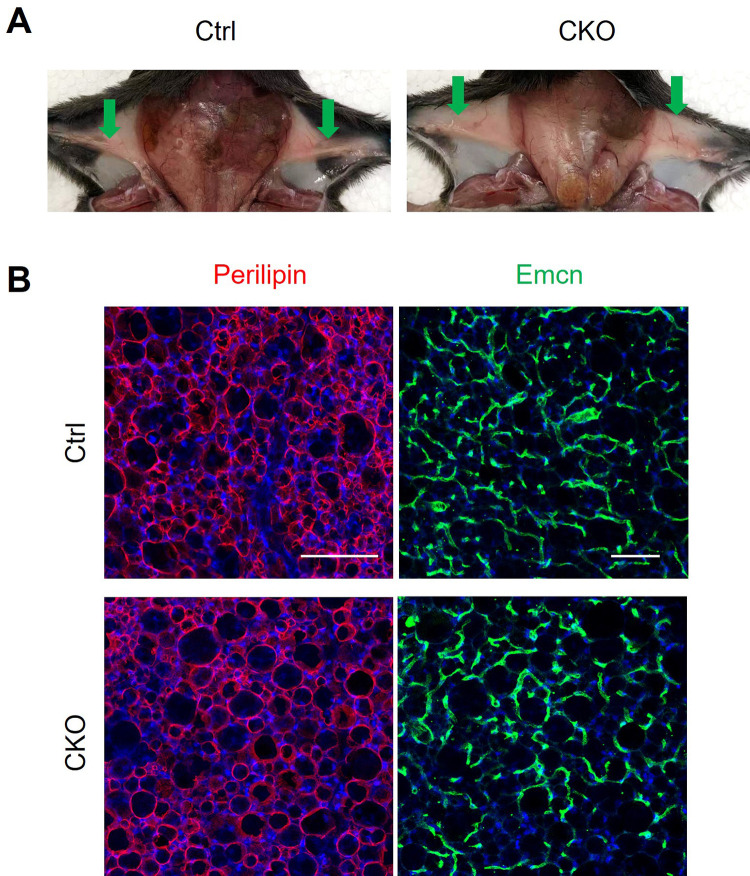
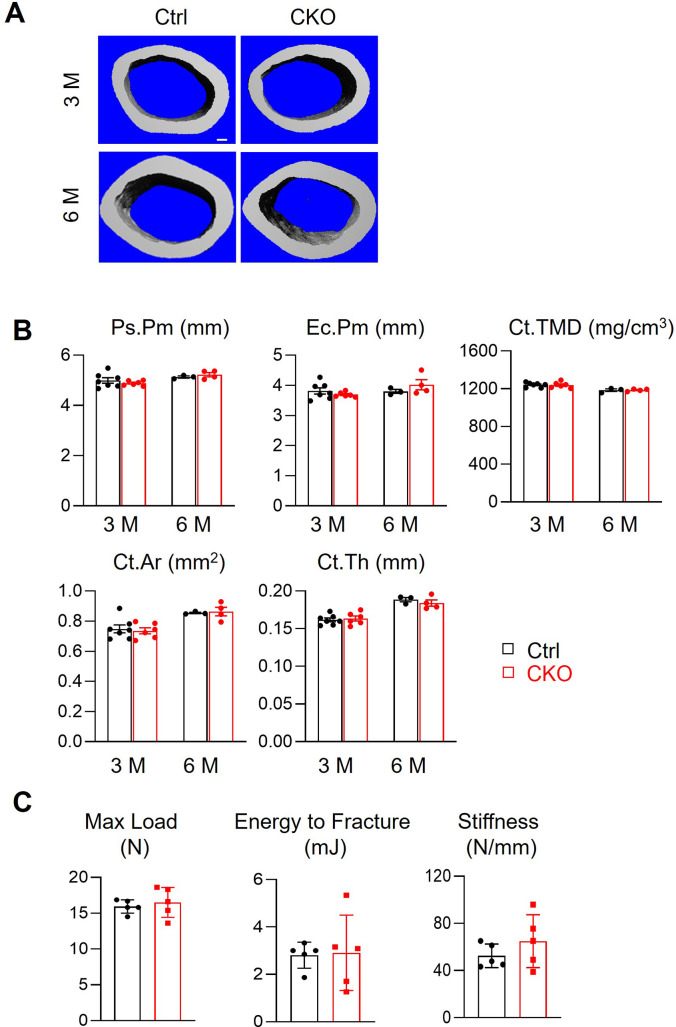
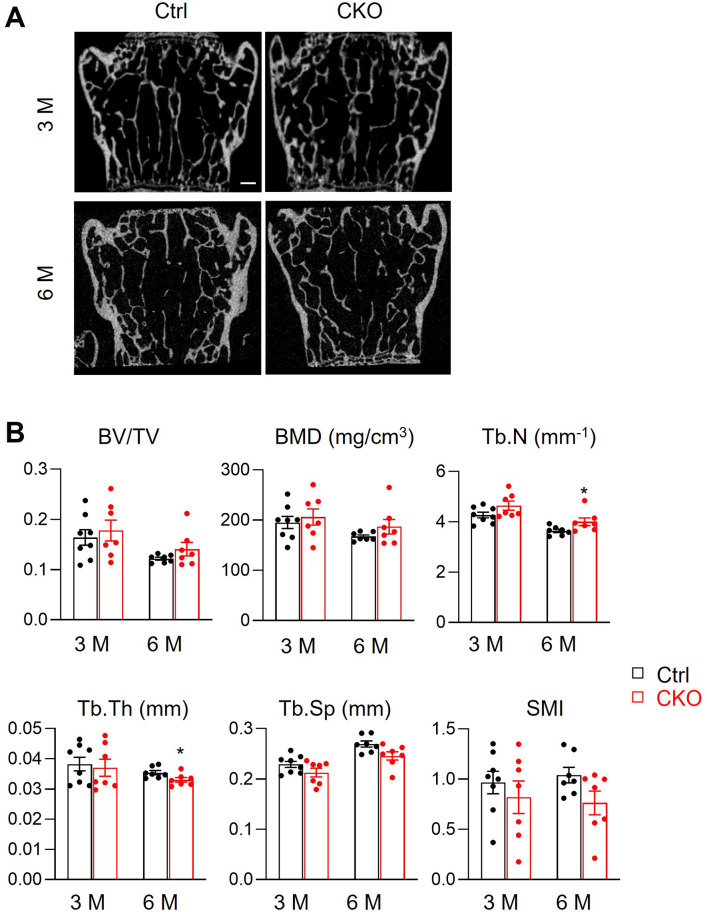
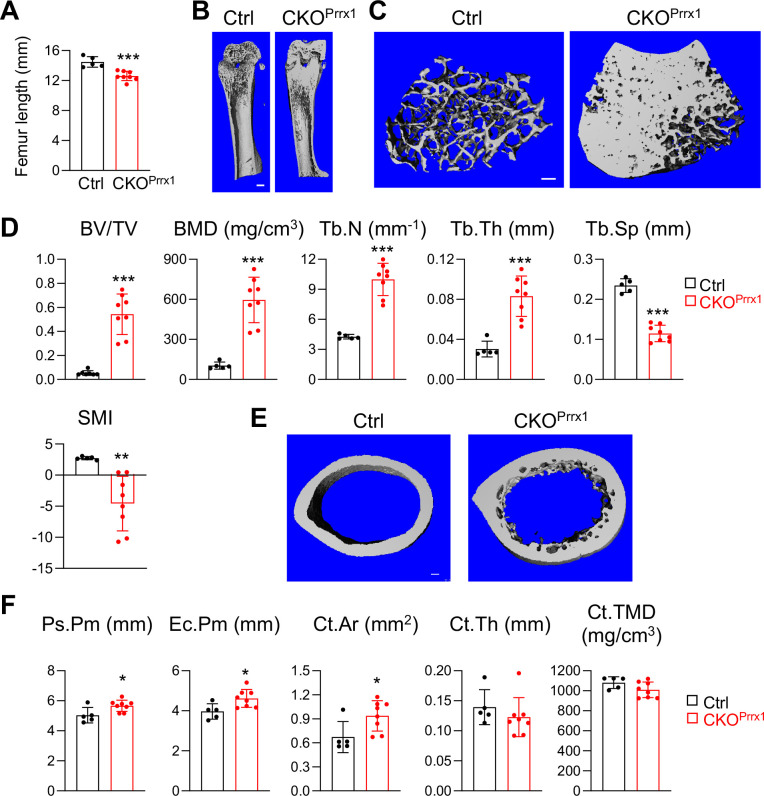
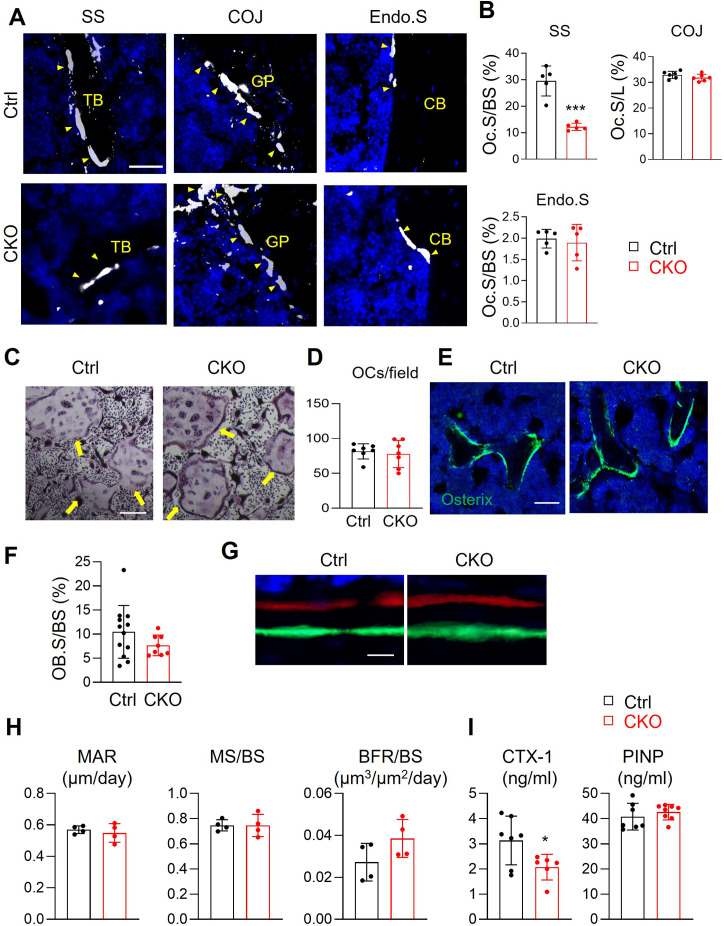
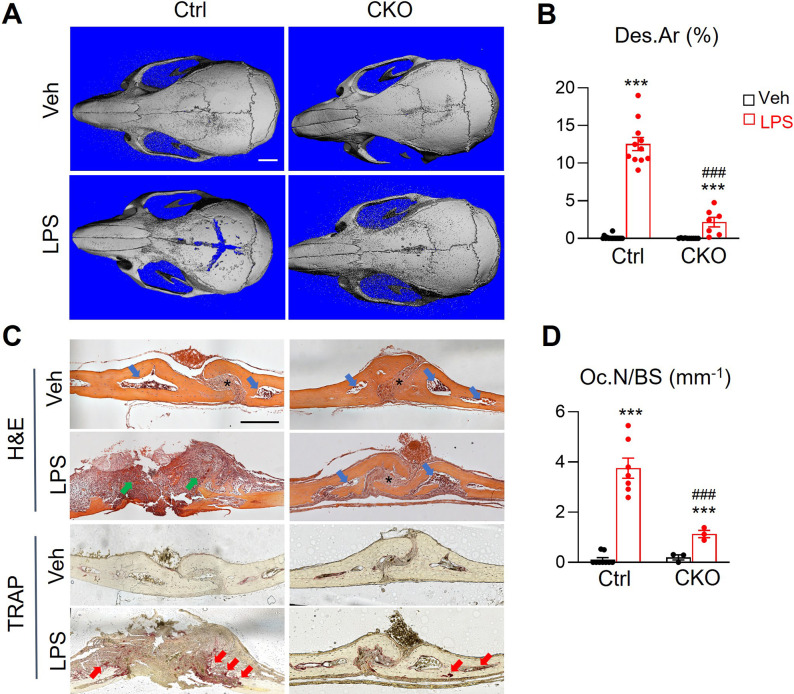
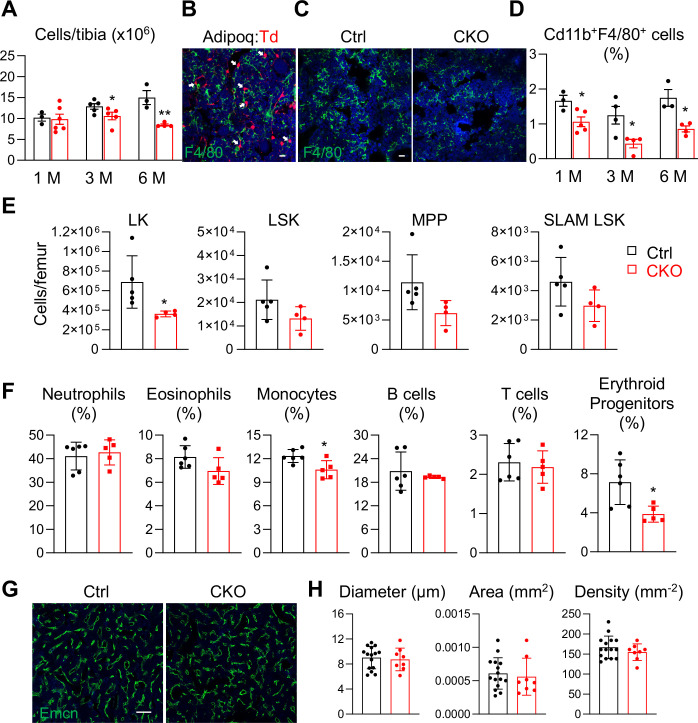
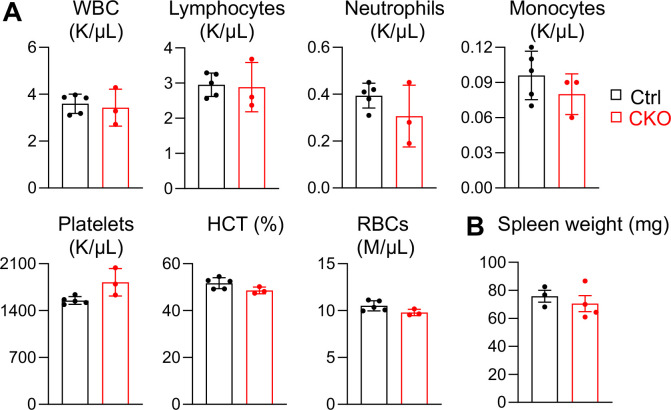
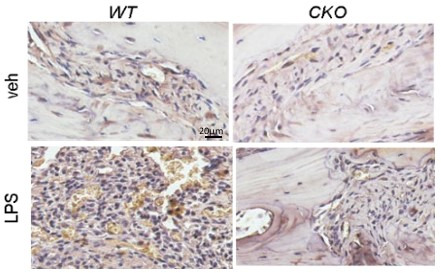
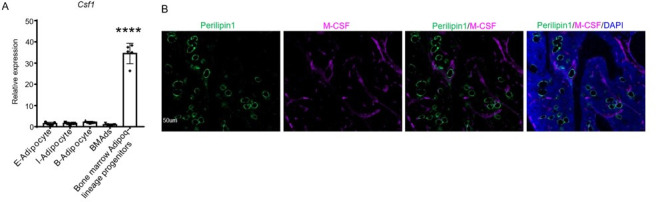
Colony-stimulating factor 1 (Csf1) is an essential growth factor for osteoclast progenitors and an important regulator for bone resorption. It remains elusive which mesenchymal cells synthesize Csf1 to stimulate osteoclastogenesis. We recently identified a novel mesenchymal cell population, marrow adipogenic lineage precursors (MALPs), in bone. Compared to other mesenchymal subpopulations, MALPs expressed Csf1 at a much higher level and this expression was further increased during aging. To investigate its role, we constructed MALP-deficient Csf1 CKO mice using AdipoqCre. These mice had increased femoral trabecular bone mass, but their cortical bone appeared normal. In comparison, depletion of Csf1 in the entire mesenchymal lineage using Prrx1Cre led to a more striking high bone mass phenotype, suggesting that additional mesenchymal subpopulations secrete Csf1. TRAP staining revealed diminished osteoclasts in the femoral secondary spongiosa region of Csf1 CKOAdipoq mice, but not at the chondral-osseous junction nor at the endosteal surface of cortical bone. Moreover, Csf1 CKOAdipoq mice were resistant to LPS-induced calvarial osteolysis. Bone marrow cellularity, hematopoietic progenitors, and macrophages were also reduced in these mice. Taken together, our studies demonstrate that MALPs synthesize Csf1 to control bone remodeling and hematopoiesis.

Keywords: Csf1; bone; cell biology; hematopoiesis; marrow adipogenic lineage precursors; medicine; mouse; osteoclasts.


Conflict of interest statement

LZ, JL, JF, LY, WY, TG, MD, NH, CB, XH, SB, KT, CC, YC, SY, WT, ND, LQ No competing interests declared, JJ Reviewing editor, eLife

Figures

Figure 1.
Figure 1.. Csf1 expression in bone is mainly contributed by MALPs in an age-dependent manner.
(A) The integrated scRNA-seq dataset of sorted bone marrow Td+ cells from 1, 3, and 16-month-old Col2a1Cre:Rosa26LSL-tdTomato (Col2:Td) mice mice (n=11 mice). The UMAP plot is presented to show cell clustering. (B) Violin plots of Csf1 and its receptor Csf1r in bone marrow cells at different ages. EMP: early mesenchymal progenitor; LMP: late mesenchymal progenitor; LCP: lineage committed progenitor; OB: osteoblast; Ocy: osteocyte; CH: chondrocyte; EC: endothelial cell; HSPC: hematopoietic stem and progenitor cell; OC: osteoclast; GP: granulocyte progenitor; RBC: red blood cell; EC: endothelial cell. (C) The percentages of bone marrow mesenchymal subpopulations are quantified based on UMAP distribution. (D) qRT-PCR analysis of Csf1 expression in sorted Td+ and Td- bone marrow cells from Adipoq:Td mice mice at 3 months of age. ***, p<0.001 Td+ vs Td- cells. (E) qRT-PCR analysis of Csf1 expression in bone marrow from young (1 month of age) and aged (10 months of age) control mice. **, p<0.01 10 M vs 1 M. (F) SnRNA-seq analysis of inguinal and perigonadal adipose tissues from 16-week-old mice. The UMAP plot is presented to show cell clustering. (G) Violin plots of Csf1 and its receptor Csf1r in individual cell subpopulation from peripheral adipose tissue. ASPC: adipose stem and progenitor cell; AD: adipocyte; EC: endothelial cell; Lym EC: lymphatic endothelial cell. (H) ScRNA-seq analysis of mesenchymal cells from human control bone marrow. These bone marrow samples were obtained by either sternal aspiration from donors undergoing cardiothoracic surgery or by manual bone marrow collection from femur heads collected after hip replacement surgery. The UMAP plots are presented to show cell clustering on the left and Csf1 and Adipoq expression on the right.
Figure 2.
Figure 2.. Csf1 CKOAdipoq mice have high trabecular bone mass in long bone.
(A, B) Csf1 CKOAdipoq mice have normal body weight (A) and femoral length (B) at 1, 3, and 6 months of age. n=5–7 mice/group. (C) Tooth eruption is also normal in CKO mice at 1 month of age. (D) qRT-PCR analysis of Csf1 mRNA in bone marrow and cortical bone of control (Ctrl) and Csf1 CKOAdipoq mice at 3 months of age. n=3–6 mice/group. (E) 3D microCT reconstruction of femoral secondary spongiosa region from 1-, 3-, and 6-month-old mice reveals a drastic increase of trabecular bone in female Csf1 CKOAdipoq mice compared to control mice. Scale bar = 100 µm. (F) MicroCT measurement of trabecular bone structural parameters. BV/TV: bone volume fraction; BMD: bone mineral density; Tb.N: trabecular number; Tb.Th: trabecular thickness; Tb.Sp: trabecular separation; SMI: structural model index. n=4–8 mice/group. *, p<0.05; **, p,0.01; ***, p<0.001 CKO vs control.
Figure 2—figure supplement 1.
Figure 2—figure supplement 1.. Csf1 CKOAdipoq mice have normal subcutaneous fat pad.
(A) Representative photographs showing subcutaneous fat pad tissues (pointed by arrows) in control and Csf1 CKOAdipoq mice. (B) Representative adipocyte (Perilipin) and vessel (Emcn) staining images in subcutaneous fat. Scale bar = 100 µm (Perilipin) or 200 µm (Emcn).
Figure 2—figure supplement 2.
Figure 2—figure supplement 2.. Csf1 CKOAdipoq mice have normal cortical bone structure and mechanical properties.
(A) 3D microCT reconstruction of femoral midshaft region from 3- and 6-month-old female control and Csf1 CKOAdipoq mice. Scale bar = 100 µm. (B) MicroCT measurement of cortical bone structural parameters of 6-month-old mice. Ps.Pm: periosteal perimeter; Ec.Pm: endosteal perimeter; Ct.TMD: cortical tissue mineral density. Ct.Ar: cortical area; Ct.Th: cortical thickness. n=3–7 mice/group. (C) Three-point bending test was performed on mouse femurs. n=5 mice/group.
Figure 2—figure supplement 3.
Figure 2—figure supplement 3.. Csf1 deficiency in MALPs does not affects vertebral bone.
(A) 2D microCT reconstruction of vertebrae from control and Csf1 CKOAdipoq mice at 3 and 6 months of age. Scale bar = 250 µm. (B) MicroCT measurement of trabecular bone structural parameters in vertebrae. BV/TV: bone volume fraction; BMD: bone mineral density; Tb.N: trabecular number; Tb.Th: trabecular thickness; Tb.Sp: trabecular separation; SMI: structural model index. n=6–7 mice/group. *, p<0.05 CKO vs control.
Figure 3.
Figure 3.. Csf1 depletion in all mesenchymal cells using Prrx1Cre affects bone growth and causes severe osteopetrosis.
(A) Femur length measurement in Csf1 CKOPrrx1 mice at 2–3 months of age (n=5–8 mice/group). (B) 3D microCT reconstruction of whole femurs from control and Csf1 CKOPrrx1 mice. Scale bar = 1 mm. (C) 3D microCT reconstruction of femoral secondary spongiosa region from control and Csf1 CKOPrrx1 mice. Scale bar = 100 µm. (D) MicroCT measurement of trabecular bone structural parameters. BV/TV: bone volume fraction; BMD: bone mineral density; Tb.N: trabecular number; Tb.Th: trabecular thickness; Tb.Sp: trabecular separation; SMI: structural model index. n=5–8 mice/group. (E) 3D microCT reconstruction of femoral cortical bone. Scale bar = 100 µm. (F) MicroCT measurement of cortical bone structural parameters. Ps.Pm: periosteal perimeter; Ec.Pm: endosteal perimeter; Ct.TMD: cortical tissue mineral density. Ct.Ar: cortical area; Ct.Th: cortical thickness. n=5–8 mice/group. *, p<0.05; ***, p<0.001 CKOPrrx1 vs control.
Figure 4.
Figure 4.. Csf1 deletion in MALPs suppresses bone resorption but not bone formation.
(A) Representative fluorescent TRAP staining images of femoral long bones from control and Csf1 CKOAdipoq mice at 3 months of age show TRAP+ osteoclasts at different skeletal sites: secondary spongiosa (SS), chondro-osseous junction (COJ), and endosteal surface (Endo.S). TB: trabecular bone; CB: cortical bone. Scale bar = 50 μm. (B) Quantification of osteoclast surface (Oc.S) at three skeletal sites. BS: bone surface. L: COJ length. n=5 mice/group. ***, p<0.001 CKO vs control. (C) Representative TRAP staining images of osteoclast culture derived from control and Csf1 CKOAdipoq BMMs at 7 days after addition of RANKL and Csf1. Arrows point to mature osteoclasts. Scale bar = 200 μm. (D) Quantification of TRAP+ multinucleated cells (>3 nuclei/cell) per field. n=7 mice/group. (E) Representative Osterix staining of trabecular bone from control and Csf1 CKOAdipoq femurs. Scale bar = 50 μm. (F) Quantification of osteoblast surface (OB.S). BS, bone surface. n=8–12 mice/group. (G) Representative double labeling of trabecular bone from control and Csf1 CKOAdipoq femurs. (H) Bone formation activity is quantified. MAR: mineral apposition rate; MS: mineralizing surface; BFR: bone formation rate. n=4 mice/group. (I) Serum ELISA analysis of bone resorption marker (CTX-1) and formation marker (PINP) in control and CKO mice. n=6–8 mice/group. *, p<0.05 CKO vs control.
Figure 5.
Figure 5.. Csf1 CKOAdipoq mice are protected from LPS-induced calvarial bone lesions.
(A) Representative 3D microCT reconstruction of mouse calvaria after 1 week of vehicle (veh, PBS) or LPS injection. Scale bar = 2 mm. (B) The percentage of bone destruction area (Des.Ar) in calvaria was quantified. n=7–16 mice/group. (C) Representative images of H&E and TRAP-stained coronal sections. In the H&E-stained images, * indicates suture position and blue arrows point to calvarial bone marrow region. Green arrows are inflammatory cells in the eroded calvariae after LPS injection in control mice. In the TRAP-stained images, red arrows point to TRAP+ osteoclasts. Scale bar = 200 µm. (D) Quantification of osteoclast number (Oc.N) in calvaria. n=3–9 mice/group. ***, p<0.001 LPS vs Veh; ###, p<0.001 CKO vs control.
Figure 6.
Figure 6.. Bone marrow cellularity, hematopoietic progenitors, and macrophages are reduced in Csf1 CKOAdipoq mice.
(A) Bone marrow cellularity was quantified in control and Csf1 CKOAdipoq mice at 1, 3, and 6 months of age. *, p<0.05; **, p<0.01 CKO vs control. (B) Fluorescent staining of F4/80 was performed on the long bones of Adipoq:Td mice. White arrows point to Adipoq+ cells (MALPs) directly contact with F4/80+ macrophages in the bone marrow. Scale bar = 20 µm. (C) Representative fluorescent images of F4/80 staining in control and Csf1 CKOAdipoq bone marrow. Scale bar = 20 µm. (D) Flow analysis of Cd11b+F4/80+bone marrow macrophages at 1, 3, and 6 months of age. *, p<0.05 CKO vs control. (E) Cell counts of hematopoietic stem and progenitor cells. LK = Lineage-cKit+, LSK = Lineage-Sca1+cKit+, MPP = Lineage-Sca1+cKit+CD48+CD150-, SLAM LSK = Lineage-Sca1+cKit+CD48-CD150+. n=4–5 mice/group. *, P<0.05 CKO vs control. (F) Flow analysis of bone marrow hematopoietic subpopulations. Neutrophil = CD45+CD11b+Ly6G+; estrophil = CD45+CD11b+Ly6 G-CD170+; monocyte = CD45+CD11b+Ly6G-CD170-Ly6C+; B cell = CD45+Ter119 CD3-CD45R/B220+; T cell = CD45+Ter119 CD3+; erythroid progenitors = CD45+Ter119+. n=5–6 mice/group. *, p<0.05 CKO vs control. (G) Representative fluorescent images of bone marrow vasculature stained by Endomucin (Emcn). Scale bar = 100 µm. (H) Quantification of bone marrow vessel diameter, density, and area. n=8–15 mice/group.
Figure 6—figure supplement 1.
Figure 6—figure supplement 1.. Peripheral blood and spleen appear normal in 3-month-old Csf1 CKOAdipoq mice.
(A) Flow analysis of peripheral blood components, including white blood cells (WBCs), lymphocytes, neutrophils, monocytes, platelets, hematocrit (HCT), and red blood cells (RBCs). n=3–5 mice/group. (B) Spleen weight was measured at 3 months of age. n=3–4 mice/group.
Author response image 1.
Author response image 1.. Adipoq+ cells in mouse bone marrow express Csf1 at the protein level.
Fluorescent staining of Csf1 was performed on the long bones of Adipoq-Cre mTmG mice. Arrows point to GFP+Csf1+ cells. It was observed that the majority of bone marrow AdipoQ-expressing progenitor cells express Csf1 (1865 cells out of 2001 cells counted, n=3 mice, 93.2%). Adopted from ref (4).
Author response image 2.
Author response image 2.. Csf1 depletion in MALPs does not alter bone marrow cytokine expression.
Bone marrow from 3-5-month-old WT and Csf1 CKOAdipoq mice (n=5/group) were centrifuged out from long bones, lysed by RIPA buffer, and subjected to cytokine array analysis using Mouse XL Cytokine Array Kit (Cat# ARY028, R&D Systems). Bone marrow from 2-3 mice was pooled for one membrane as indicated.
Author response image 3.
Author response image 3.. 4/80 staining (brown) of mouse calvarial bone marrow at day 7 post a vehicle or an LPS injection.
Author response image 4.
Author response image 4.. Csf1 is expressed in MALPs but not LiLAs in bone marrow.
(A) qRT-PCR analysis of Csf1 expression in bone marrow adipocytes BMAds, which are LiLAs in our terminology, and bone marrow Adipoq-lineage progenitors, which are MALPs in our terminology, sorted from the bone marrow of Adipoq-Cre mTmG mice. (B) Fluorescent staining of Perillipin and Csf1 was performed on mouse long bones. Csf1 expression was not detected in mature bone marrow adipocytes (Perilipin1+) (0 cells out of 115 cells counted, n=3 mice, 0%). Adopted from ref (4).

Update of

  • doi: 10.1101/2022.07.27.501742

References

    1. Abboud SL, Woodruff K, Liu C, Shen V, Ghosh-Choudhury N. Rescue of the osteopetrotic defect in op/op mice by osteoblast-specific targeting of soluble colony-stimulating factor-1. Endocrinology. 2002;143:1942–1949. doi: 10.1210/endo.143.5.8775. - DOI - PubMed
    1. Arai F, Miyamoto T, Ohneda O, Inada T, Sudo T, Brasel K, Miyata T, Anderson DM, Suda T. Commitment and differentiation of osteoclast precursor cells by the sequential expression of c-fms and receptor activator of nuclear factor kappaB (RANK) receptors. The Journal of Experimental Medicine. 1999;190:1741–1754. doi: 10.1084/jem.190.12.1741. - DOI - PMC - PubMed
    1. Baryawno N, Przybylski D, Kowalczyk MS, Kfoury Y, Severe N, Gustafsson K, Kokkaliaris KD, Mercier F, Tabaka M, Hofree M, Dionne D, Papazian A, Lee D, Ashenberg O, Subramanian A, Vaishnav ED, Rozenblatt-Rosen O, Regev A, Scadden DT. A cellular taxonomy of the bone marrow stroma in homeostasis and leukemia. Cell. 2019;177:1915–1932. doi: 10.1016/j.cell.2019.04.040. - DOI - PMC - PubMed
    1. Begg SK, Radley JM, Pollard JW, Chisholm OT, Stanley ER, Bertoncello I. Delayed hematopoietic development in osteopetrotic (op/op) mice. The Journal of Experimental Medicine. 1993;177:237–242. doi: 10.1084/jem.177.1.237. - DOI - PMC - PubMed
    1. Bianco P, Robey PG, Saggio I, Riminucci M. “ mesenchymal ” stem cells in human bone marrow (skeletal stem cells): a critical discussion of their nature, identity, and significance in incurable skeletal disease. Human Gene Therapy. 2010;21:1057–1066. doi: 10.1089/hum.2010.136. - DOI - PMC - PubMed

Publication types

Substances

Associated data