. 2023 Mar 1;150(5):dev201090.
doi: 10.1242/dev.201090. Epub 2023 Mar 6.

A distinct transcriptome characterizes neural crest-derived cells at the migratory wavefront during enteric nervous system development

Affiliations

A distinct transcriptome characterizes neural crest-derived cells at the migratory wavefront during enteric nervous system development

Rhian Stavely et al. Development. .

Abstract

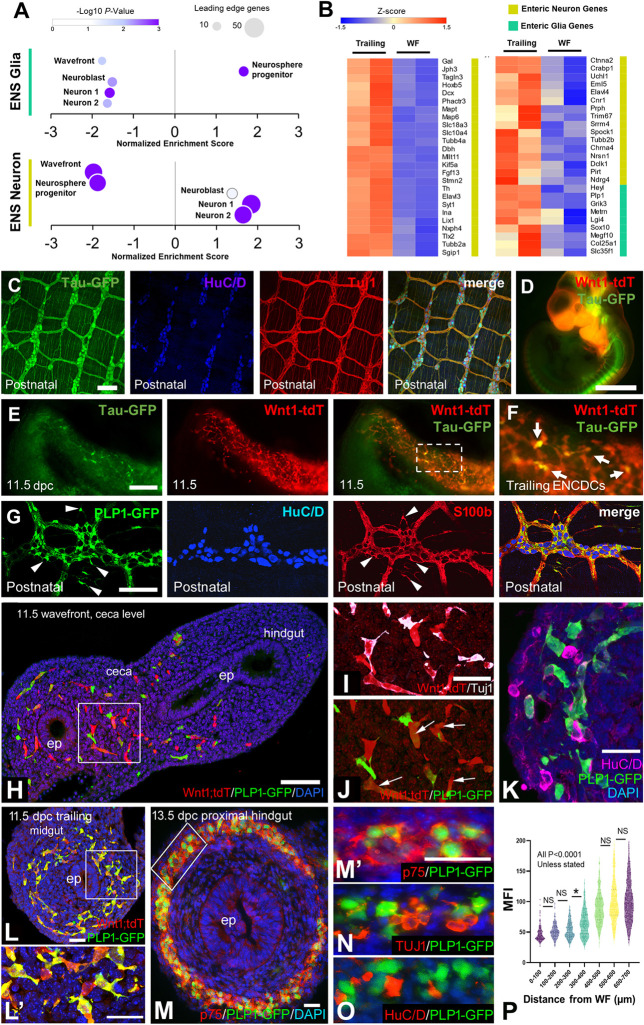
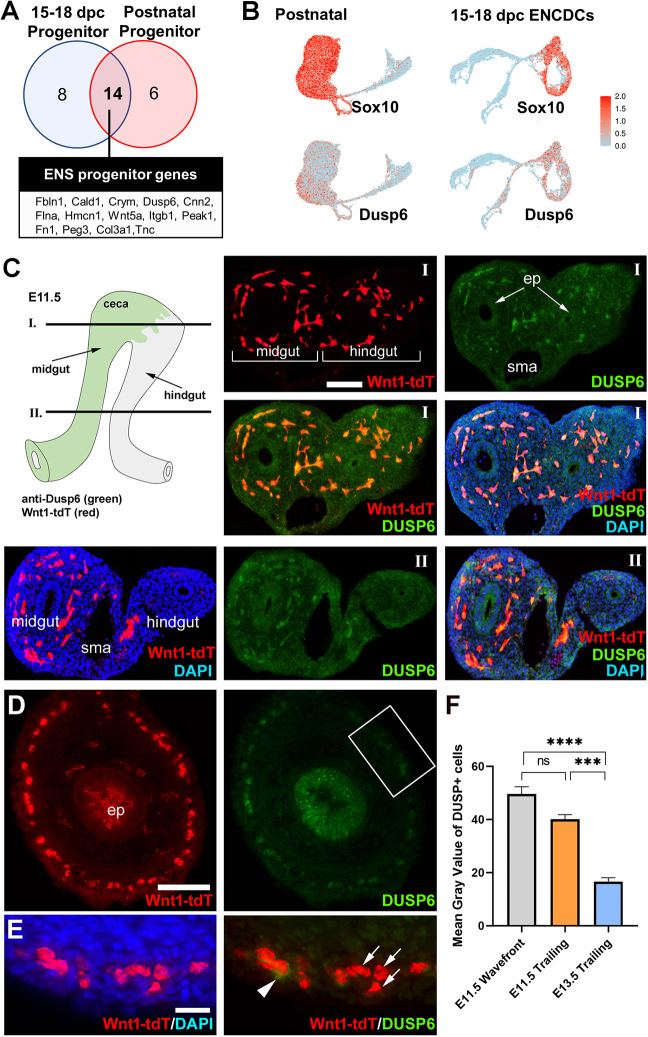
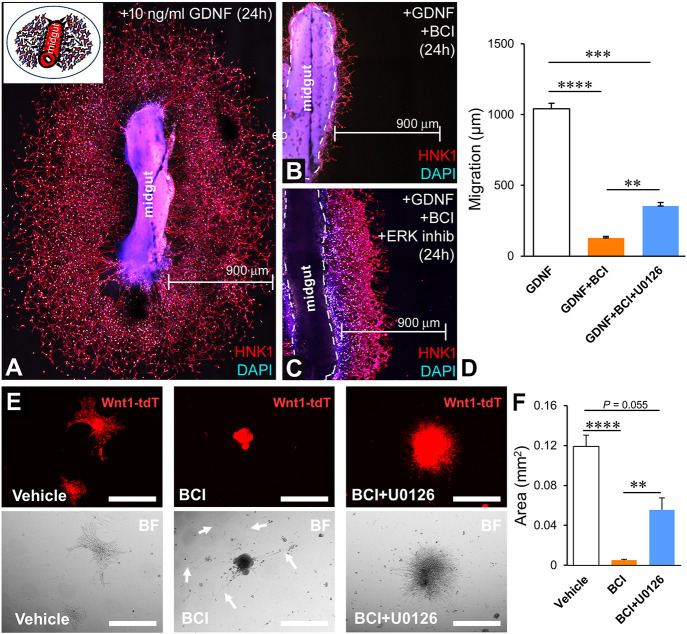
Enteric nervous system development relies on intestinal colonization by enteric neural crest-derived cells (ENCDCs). This is driven by a population of highly migratory and proliferative ENCDCs at the wavefront, but the molecular characteristics of these cells are unknown. ENCDCs from the wavefront and the trailing region were isolated and subjected to RNA-seq. Wavefront-ENCDCs were transcriptionally distinct from trailing ENCDCs, and temporal modelling confirmed their relative immaturity. This population of ENCDCs exhibited altered expression of ECM and cytoskeletal genes, consistent with a migratory phenotype. Unlike trailing ENCDCs, the wavefront lacked expression of genes related to neuronal or glial maturation. As wavefront ENCDC genes were associated with migration and developmental immaturity, the genes that remain expressed in later progenitor populations may be particularly pertinent to understanding the maintenance of ENCDC progenitor characteristics. Dusp6 expression was specifically upregulated at the wavefront. Inhibiting DUSP6 activity prevented wavefront colonization of the hindgut, and inhibited the migratory ability of post-colonized ENCDCs from midgut and postnatal neurospheres. These effects were reversed by simultaneous inhibition of ERK signaling, indicating that DUSP6-mediated ERK inhibition is required for ENCDC migration in mouse and chick.

Keywords: Enteric nervous system; Hindgut; Hirschsprung disease; Neural crest cells; Wavefront.


Conflict of interest statement

Competing interests The authors declare no competing or financial interests.

Figures

Fig. 1.
Fig. 1.
Wavefront ENCDCs are transcriptionally unique and exhibit a gene expression profile associated with promigratory pathways. (A) Whole mouse embryo at 11.5 dpc expressing Wnt1-tdT. Scale bar: 2 mm. (B) Partially dissected mouse embryo revealing the hairpin-loop structure of the developing gut. ENCDCs migrating in a caudal direction characteristically reach the ileocecal junction (arrow). Scale bar: 100 µm. (C-Cʹʹʹ) Dissected gut at 11.5 dpc from NestinGFP;Wnt1-tdT embryos. (C) Wnt1-tdT expression in ENCDCs is observed caudally up to the ileocecal junction (IC) with wavefront ENCDCs considered to be within 0.5 mm proximal to the wavefront and ENCDCs 1.0-1.5 mm posterior to the migrating wavefront referred to as trailing ENCDCs. (C′-C′′′) NestinGFP expression is observed in cells of the mesenteric blood vessel (C′) and colocalized with Wnt1-tdT, which is characteristic of enteric neural progenitor cells (C′′,C′′′) in the wavefront and trailing ENCDCs. Scale bars: 100 µm. (D) FACS plots of Wnt1-tdT and DAPI (dead cell) expression in single-cell suspensions generated from regions of intestine containing the wavefront and trailing ENCDCs. (E) Principal component plot of gene expression data from individual samples of wavefront and trailing ENCDCs. (F) Volcano plot of differentially expressed genes between wavefront (WF) and trailing ENCDCs from RNA-sequencing of purified ENCDC populations. (G) Node-edge network of protein-protein interactions and clustering between differentially expressed genes in wavefront and trailing ENCDCs. Interacting clusters are annotated for top associated gene ontology terms.
Fig. 2.
Fig. 2.
Genes associated with epithelial-mesenchymal transition are upregulated in wavefront ENCDCs. (A) GSEA analysis of wavefront versus trailing ENCDC gene expression against the HALLMARK pathway database. EMT, epithelial-mesenchymal transition. Data are presented as normalized enrichment scores (NES, y axis), leading edge genes (size) and -Log10 P value (color). (B-D) Representative images of (B) cadherin 11 (CDH11), (C) fibrillin 2 (FBN2) and (D) syndecan 4 (SYND4) expression by immunohistochemistry in Wnt1-tdT-expressing mouse ENCDCs at the wavefront at 11.5 dpc. Areas outlined in B and D are shown at higher magnification on the right. Scale bars: 100 μm in B and D; 20 μm in B (inset), C and D (inset).
Fig. 3.
Fig. 3.
Assessment of wavefront-trailing ENCDC developmental maturity and conserved transcriptomic features in migrating NCCs. (A) UMAP plot of peripheral nervous system (PNS) neural crest cells at developmental timepoints 9.5 to 13.5 dpc from single-cell RNA-seq data originally generated by Cao et al. (2019). (B) Unsupervised clustering of the Cao et al. dataset represented on UMAP. (C) UMAP representation of enteric neuron and enteric glial developmental trajectories from the Cao et al. dataset integrated with single cell RNA-seq data of ENCDCs at 15.1-18.5 dpc generated by Morarach et al. (2021). (D) Original location of enteric neuron (blue) and enteric glia (red) developmental trajectories in the Cao et al. dataset. (E) Overlay of enteric neuron (blue) and enteric glia (red) developmental trajectories from Cao et al. after integration with the Morarach et al. dataset. (F) UMAP representation of the Cao et al. PNS neural crest cell dataset highlighting clusters associated with enteric neuron (dark blue) and enteric glia (dark red) developmental trajectories and clusters of their closest associated neural crest cell progenitors (neuron, light blue; glia, light red) enriched at 9.5 dpc. (G) UMAP plots of subclusters comprising the enteric neuron trajectory and neural crest cell progenitors (top panel), and the enteric glia trajectory and neural crest cell progenitors (bottom panel). (H) Bar chart representations of average wavefront and trailing ENCDC gene set signature scores generated by the AddModuleScore function of Seurat in cells from the enteric neuron and enteric glial development subclusters. Data are presented as average±s.e.m. per actual developmental staging of cells. Kruskal–Wallis ANOVA test with a post-hoc Dunn's multiple comparison test. *P<0.05, **P<0.01 and ****P<0.0001. (I) Developmental pseudotime estimation of cell maturation in the enteric neuron and enteric glia development subclusters. (J,K) Heatmap representations of significant changes in gene expression over developmental pseudotime for (J, left panel) wavefront ENCDC-associated genes declining over pseudotime maturation in enteric neuron trajectories, (J, right panel) trailing ENCDC-associated genes increasing over pseudotime maturation in enteric neuron trajectories and (K) wavefront and trailing ENCDC-associated genes changing over pseudotime maturation in enteric glial trajectories. Annotations above heatmaps reflect modelled pseudotime, original cell clusters and actual developmental stage when cells were collected. (L) Developmental pseudotime estimation of cell maturation in enteric neuron and enteric glial trajectory clusters from the Cao et al. dataset after integration with the Morarach et al. data to improve developmental modelling. (M) Heatmap representations of significant changes in gene expression over developmental pseudotime for (left panel) wavefront ENCDC-associated genes declining over pseudotime and (right panel) trailing ENCDC-associated genes increasing over pseudotime. Annotations above heatmaps reflect modelled pseudotime, cell identity of clusters derived from Morarach et al., and actual developmental stage when cells were collected.
Fig. 4.
Fig. 4.
Wavefront ENCDCs are transcriptionally distinct from developing neurons and glia. (A) Enrichment of enteric neuron and enteric glia signature genes from MSigDB by GSEA in 11.5 dpc wavefront versus trailing ENCDC gene expression and postnatal ENCDC progenitors. Data are presented as normalized enrichment scores (NES, y-axis), leading-edge genes (size) and -Log10 P value (color). (B) Heatmap of leading-edge genes (GSEA) of enteric neuron and enteric glia signatures from MSigDB annotations in 11.5 dpc wavefront versus trailing ENCDC gene expression profiles presented as Z-scores. (C) Validation of TauGFP specificity to enteric neurons in the myenteric plexus of postnatal mice by labeling with the neuronal markers HuC/D and Tuj1. (D) Whole-embryo expression of TauGFP; Wnt1-tdT. Scale bar: 2 mm. (E) Representative images of Wnt1-tdT, TauGFP and merged images at 11.5 dpc. (F) Higher magnification of the area outlined in E showing trailing ENCDCs expressing TauGFP. Arrows indicate TauGFP/Wnt1;tdT+ cells. (G) Validation of Plp1GFP specificity to enteric glia in the myenteric plexus of postnatal mice by labeling with the neuronal marker HuC/D and glial marker S100B. Arrowheads indicate Plp1GFP/S100B+ cells. (H-K) Representative images of cross-sections of the embryonic gut of Wnt1-tdT; Plp1GFP mice at 11.5 dpc at the level of the migrating wavefront ENCDCs (J) and high-magnification images of Tuj1 (I) and Plp1GFP (K). Area outlined in H is shown at higher magnification in I and J. Arrows indicate Wnt1;tdT+ cells. (L) Cross-section from the 11.5 dpc gut of Wnt1-tdT; Plp1-GFP mice showing trailing ENCDCs in the colonized midgut. Area outlined in L is magnified in L′, demonstrating the glial marker Plp1-GFP in trailing ENCCs. (M) Hindgut at 13.5 dpc from a Plp1GFP mouse embryo stained for p75 to mark the ENCDCs. Area outlined in M is shown at higher magnification in M′. (N,O) Consecutive transverse sections of 13.5 dpc Plp1GFP mouse mid-hindgut stained using Tuj1 (N) and Hu (O) antibodies to detect early neuronal differentiation. (P) Quantification of the mean fluorescence intensity of Plp1GFP expression in Wnt1-tdT ENCDCs in the mouse embryonic gut at 11.5 dpc split by distance from the most caudally migrated wavefront ENCDCs in 100 µm increments. All pairwise comparisons are statistically significant at P<0.0001 unless indicated otherwise in the graph. *P<0.05; NS, not significant. Scale bars: 100 μm in C and H; 200 μm in E; 40 μm in G and I-O.
Fig. 5.
Fig. 5.
Features of the wavefront-trailing axis of ENCDC maturation are conserved in progenitors at 15.5-18.5 dpc. (A) Unsupervised clustering of the Morarach et al. (2021) dataset containing Wnt1-tdT expressing ENCDCs at 15.5 and 18.5 dpc represented as UMAP. (B,B′) UMAP plot with individual cells colored by module scores generated by the AddModuleScore function of Seurat of the 11.5 dpc wavefront ENCDC (B) and 11.5 dpc trailing ENCDC (B′) gene signature. (C,C′) Violin plots with median values of module scores for wavefront ENCDC genes (C) and trailing ENCDC genes (C′) in ENCDCs at 15.5-18.5 dpc. (D,E) Heatmap representations of differentially expressed genes between clusters associated with (D) wavefront ENCDCs and (E) trailing ENCDCs. Annotations above heatmaps reflect general cell identity annotations. (F) Dot plot visualization of the normalized gene expression and percentage of expressing cells in the postnatal mouse colon. Data were acquired from the mouse colon atlas and were originally produced by Drokhlyansky et al. (2020), who identified genes highly expressed in postnatal enteric glia that are associated with trailing ENCDCs and the glial/progenitor population at 15.5-18.5 dpc.
Fig. 6.
Fig. 6.
Dusp6 is expressed by ENCDC progenitors. (A) Venn diagram of wavefront ENCDC-associated genes that are upregulated in ENCDC progenitors from neurospheres derived from the postnatal small bowel produced by Guyer et al. (2023) and ENCDC progenitors at 15.5-18.5 dpc from Morarach et al. (2021). (B) UMAP visualization of Sox10 and Dusp6 expression in ENCDC progenitors from mouse postnatal neurospheres and ENCDCs at 15.5-18.5 dpc. (C) Cross-sections from the gut of Wnt1-tdT mice at 11.5 dpc at the level of the (I) wavefront ENCDCs showing Wnt1-tdT expression, DUSP6 immunostaining, merged images of Wnt1-tdT and DUSP6, and merged images with DAPI. (C) Cross-sections from the gut of Wnt1-tdT mice at 11.5 dpc at the level of the (I) ceca and (II) trailing ENCDCs showing Wnt1-tdT and DAPI, DUSP6 immunostaining, and merged images of Wnt1-tdT and DUSP6 with DAPI. (D) Representative images at 13.5 dpc of cross-sections from the mouse proximal hindgut showing SOX10 and DUSP6 immunostaining. Area outlined in D is shown at higher magnification in E, demonstrating overlapping expression between SOX10+ cells and DUSP6+ cells. Arrowhead indicates a DUSP6+/Wnt1;tdT+ cell; arrows are DUSP6/Wnt1;tfT+ ENCDCs. (F) Quantification of mean intensity value in the particle expressed in gray-level units of SOX10+/DUSP6+ immunoreactive cells. ***P<0.001, ****P<0.0001 (Kruskal-Wallis test with a post-hoc Dunn's test). Scale bars: 100 μm in C and D; 20 μm in E.
Fig. 7.
Fig. 7.
DUSP6 is necessary for ENCDC colonization of the hindgut via suppression of ERK. (A) Cultured mouse gut explants excised from Wnt1-tdT-expressing 11.5 dpc embryos at 48 h post-culture. Explants were treated with a DMSO vehicle as a control or the DUSP6 inhibitor BCI. Scale bars: 1 mm. Arrows indicate the direction of migration. (B) Quantification of the distance of the most distally migrated ENCDCs from the ileocecal junction at 48 h post-culture in the presence of BCI or its DMSO vehicle. Mann–Whitney test, *P<0.05. n=5 gut explants/group. (C,D) Tuj1 immunohistochemistry in 11.5 dpc mouse embryonic gut explants 48 h post-culture visualizing neurons and fiber projections in the ENCDC wavefront (C) and trailing ENCDC regions (D). Arrows indicate the direction of migration. Scale bars: 50 µm. (E) Schematic diagram of chick hindgut colonization assays. (F) Longitudinal sections from organ cultures of the E6 chick gut immunolabelled for SOX10 and stained with DAPI after being cultured in the presence of DMSO (left), the DUSP inhibitor BCI (middle) and BCI+ERK inhibitor (right). Dotted lines indicate the beginning of the hindgut at the ceca. NoR, nerve of Remak; ep, epithelium. (G) Quantification of the length of SOX10+ ENCDC colonization of the hindgut from the ceca. Kruskal–Wallis test with a post-hoc Dunn's multiple comparison test performed. **P<0.01, ****P<0.0001, NS, not significant. n=9 gut explants/group. (H) Longitudinal sections of the E6 chick gut immunolabelled for SOX10 and with anti-phosphohistone H3. mp, myenteric plexus; smp, submucosal plexus. (I) Quantification of the percentage of SOX10+ ENCDCs expressing the phosphohistone H3. Statistical analysis was performed by ANOVA with a post-hoc Tukey test (R Core Team). The P-value was adjusted with Bonferroni's correction. P<0.05 was considered significant and the following further levels of significance were found: **P<0.01; ***P<0.001; ****P<0.0001. Data are mean±s.e.m. n=7 gut explants/group. Scale bars: 100 μm in F and H; 20 μm in H (inset).
Fig. 8.
Fig. 8.
DUSP6-mediated ERK suppression promotes cell migration in post-colonized and postnatal ENCDC progenitors. (A-C) Chick ENCDCs immunolabeled for HNK1 from midgut explants migrating on fibronectin in response to GDNF (A) and after exposure to BCI (B) or BCI and the ERK inhibitor U0126 (C). (D) Quantification of the distance of ENCDC migration from midgut explants after 24 h in culture in the presence of GDNF, GDNF+BCI, and GDNF+BCI and U0126. Statistical analysis was performed using Kruskal–Wallis test with a post-hoc Dunn's test (R Core Team). P<0.05 was considered significant and the following further levels of significance were found: **P<0.01; ***P<0.001; ****P<0.0001. Data are mean±s.e.m. n=15 gut explants/group. (E) Postnatal neurospheres from Wnt1-tdT mice cultured on fibronectin for 48 h. Neurospheres were treated with DMSO (vehicle), BCI or BCI in combination with U0126. Arrows indicate the migration of non-NCC derived cells. Scale bars: 500 µm. (F) Quantification of the area (mm2) of spread of postnatal ENCDCs from neurospheres after 48 h in culture in the presence of DMSO (vehicle), BCI or BCI and U0126. **P<0.01, ****P<0.0001. n=15 images/group.

References

    1. Afgan, E., Baker, D., Batut, B., Van Den Beek, M., Bouvier, D., Cech, M., Chilton, J., Clements, D., Coraor, N., Grüning, B. A.et al. (2018). The Galaxy platform for accessible, reproducible and collaborative biomedical analyses: 2018 update. Nucleic Acids Res. 46, W537-W544. 10.1093/nar/gky379 - DOI - PMC - PubMed
    1. Akbareian, S. E., Nagy, N., Steiger, C. E., Mably, J. D., Miller, S. A., Hotta, R., Molnar, D. and Goldstein, A. M. (2013). Enteric neural crest-derived cells promote their migration by modifying their microenvironment through tenascin-C production. Dev. Biol. 382, 446-456. 10.1016/j.ydbio.2013.08.006 - DOI - PMC - PubMed
    1. Andrews, S. (2010). FastQC: A Quality Control Tool for High Throughput Sequence Data. Cambridge, United Kingdom: Babraham Bioinformatics, Babraham Institute.
    1. Belkind-Gerson, J., Graham, H. K., Reynolds, J., Hotta, R., Nagy, N., Cheng, L., Kamionek, M., Shi, H. N., Aherne, C. M. and Goldstein, A. M. (2017). Colitis promotes neuronal differentiation of Sox2+ and PLP1+ enteric cells. Sci. Rep. 7, 2525. 10.1038/s41598-017-02890-y - DOI - PMC - PubMed
    1. Bhave, S., Arciero, E., Baker, C., Ho, W. L., Stavely, R., Goldstein, A. M. and Hotta, R. (2019). Enteric neuronal cell therapy reverses architectural changes in a novel diphtheria toxin-mediated model of colonic aganglionosis. Sci. Rep. 9, 18756. 10.1038/s41598-019-55128-4 - DOI - PMC - PubMed

Publication types