. 2023 Feb 21;120(8):e2205247120.
doi: 10.1073/pnas.2205247120. Epub 2023 Feb 13.

An HLA-G/SPAG9/STAT3 axis promotes brain metastases

Affiliations

An HLA-G/SPAG9/STAT3 axis promotes brain metastases

Blessing Iquo Bassey-Archibong et al. Proc Natl Acad Sci U S A. .

Abstract

Brain metastases (BM) are the most common brain neoplasm in adults. Current BM therapies still offer limited efficacy and reduced survival outcomes, emphasizing the need for a better understanding of the disease. Herein, we analyzed the transcriptional profile of brain metastasis initiating cells (BMICs) at two distinct stages of the brain metastatic cascade-the "premetastatic" or early stage when they first colonize the brain and the established macrometastatic stage. RNA sequencing was used to obtain the transcriptional profiles of premetastatic and macrometastatic (non-premetastatic) lung, breast, and melanoma BMICs. We identified that lung, breast, and melanoma premetastatic BMICs share a common transcriptomic signature that is distinct from their non-premetastatic counterparts. Importantly, we show that premetastatic BMICs exhibit increased expression of HLA-G, which we further demonstrate functions in an HLA-G/SPAG9/STAT3 axis to promote the establishment of brain metastatic lesions. Our findings suggest that unraveling the molecular landscape of premetastatic BMICs allows for the identification of clinically relevant targets that can possibly inform the development of preventive and/or more efficacious BM therapies.

Keywords: HLA-G; SPAG9; STAT3; brain metastases.


Conflict of interest statement

The authors declare no competing interest.

Figures

Fig. 1.
Fig. 1.
Lung, breast, and melanoma BMICs exhibit a common distinct transcriptomic signature: (A) Schematic illustration of premetastatic BMIC model—brain metastatic tumors surgically removed from lung-, breast-, and melanoma-BM patients were processed and cultured in tumorsphere-enriching (NCC- or SCM-supplemented) media (Methods) to establish respective patient-derived parental BMICs. Parental BMICs were then tagged with a GFP-expressing vector containing a puromycin-resistant cassette. GFP-tagged parental lung, breast, and melanoma BMICs were subsequently injected into NSG mice via the respective orthotopic routes (lung, fat pad, and subcutaneous). At orthotopic tumor end points, respectively, injected mice were killed, and brains were harvested, processed, and minimally cultured for 2 wk to enrich for premetastatic lung (BMIT), breast (BMFP), and melanoma (BMSC) BMICs, which were then sorted by flow cytometry for GFP positivity. GFP-positive premetastatic and parental BMICs were then subjected to total mRNA isolation and bulk RNA sequencing. Heat map showing the mean expression profile of deregulated genes associated with parental and premetastatic breast, melanoma (B), and lung (C) BMICs. (D) Venn diagram of commonly differentially expressed genes (DEGs) in premetastatic versus parental BMICs. (E) Volcano plots showing the commonly up-regulated and down-regulated DEGs in premetastatic breast, melanoma, and lung BMICs. (F) Bubble plots showing significantly up- and down-regulated biological processes associated with the differentially expressed gene signature of premetastatic lung, breast, and melanoma BMICs. (G) Pathway network showing the different signaling pathways up-regulated and down-regulated in premetastatic lung, breast, and melanoma BMICs. NES – normalized enrichment score.
Fig. 2.
Fig. 2.
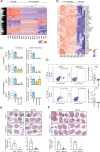
HLA-G knockdown attenuates the establishment of BM: (A) Heat map depicting expression of the top commonly up-regulated genes in premetastatic compared to parental BMICs. (B) Heat map depicting expression of the top 45 commonly up-regulated genes in premetastatic BMICs. (C) Quantitative RT-PCR analysis of HLA-G expression in control (shCtrl) and HLA-G knockdown (shHLA-G1 and shHLA-G2) lung (BT478; BT530) and melanoma (BT917; BT673) BMICs and analysis of HLA-G depletion effects on secondary (20) sphere formation assays in parental lung BMICs. BT478 P values for qRT-PCR ****<0.0001 and 20 sphere formation *0.03; BT530 P values for qRT-PCR **0.004 and 0.006 and 20 sphere formation **0.002 and 0.002; BT917 P values for qRT-PCR **** <0.0001 and 20 sphere formation **0.0040 and ns >0.9999; BT673 P values for qRT-PCR **0.0093 and * 0.0126 and 20 sphere formation P value **** <0.0001. All experiments were conducted in either duplicate or triplicate. (D) Flow cytometry analysis of human Tra-1-85 expression in BMICs enriched from minimally (2 wk) cultured brains of mice intrathoracically (IT) injected with BT478 shCtrl and the most efficient HLA-G knockdown (shHLA-G) BMICs (n = 6 mice each) and subcutaneously (SC) injected with BT917 shCtrl and shHLA-G BMICs (n = 4 mice each). P values are shown. To the right are bar graphs depicting % Tra-1-85-positive BMICs captured from the respective brains. (E) Hematoxylin and eosin (H&E)-stained images of brain tissues of mice intracranially injected with shCtrl and shHLA-G lung (BT478; BT530) and (F) melanoma (BT917; BT673) BMICs at matched time end points. (Scale bar, 500 µm.) Representative images are shown. Below are bar graphs depicting relative tumor areas (mm2) of each mouse group. P values of shHLA-G tumors with respect to shCtrl tumors are indicated here for BT478 (***0.0003; n = 5 mice), BT530 (*0.049; n = 3 mice), BT917 (*0.02; n = 3 mice), and BT673 (***0.0002; n = 4 mice) mice cohorts. Emboldened black broken lines enclose tumor lesions in each respective mouse brain slice.
Fig. 3.
Fig. 3.
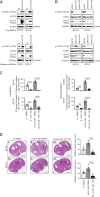
HLA-G promotes BMICs’ secondary sphere formation and growth in the brain parenchyma via STAT3 signaling: (A) Western blot analysis of HLA-G (low exposure), pSTAT3 (Y705) and STAT3 expression in control (E), and HLA-G OE lung (BT478; BT530) and melanoma (BT673; BT917) BMICs; 6 µg of protein was used, and (B) control (shCtrl) and HLA-G knockdown (shHLA-G1 and shHLA-G2) lung and melanoma BMICs; 15 µg of protein was used with GAPDH, β-actin, and β-tubulin serving as loading controls. (C) In vitro characterization (20 sphere formation assays) of vehicle-treated (DMSO) and DR-1-55-treated E and HLA-G OE lung (BT478; BT530) and melanoma (BT673; BT917) BMICs. P values are shown in bar graphs. All experiments were conducted in either duplicate or triplicate. (D) Hematoxylin and eosin (H&E)-stained images of brain tissues of mice intracranially injected with vehicle (DMSO)-treated control (E-DMSO and HLA-G OE-DMSO) and DR-1-55-treated HLA-G OE (HLA-G OE DR-1-55) lung (BT478) and melanoma (BT673) BMICs at matched time end points. Emboldened black broken lines enclose tumor lesions in each respective mouse’s brain. To the right are bar graphs depicting the relative tumor areas (mm2) of each mouse group. P values are indicated. Representative images are shown. (Scale bar, 2 mm.)
Fig. 4.
Fig. 4.
HLA-G stimulates STAT3 signaling via SPAG9 in BMICs and targeting SPAG9 in brain-tropic cells attenuates BM: (A) Bubble plot showing HLA-G-interacting proteome in parental lung (BT478) BMICs. (B) Immunoprecipitation (IP) experiments demonstrating that HLA-G binds SPAG9 in control (E) and HLA-G OE lung (BT478) and melanoma (BT673) BMICs. WB – Western blot; NC – Negative control. Western blot analysis of SPAG9 and HLA-G expression in E and HLA-G OE lung (BT478; BT530) and melanoma (BT673; BT917) BMICs – 6 µg of protein was used and HLA-G shown is at a low exposure (C) and control (shCtrl) as well as HLA-G knockdown (shHLA-G1 and shHLA-G2) lung and melanoma BMICs—~15 µg or 20 µg of protein was used and the exposure of HLA-G here is higher. (D) STAT3 and AKT serve as loading controls in the respective western blots. (E) Western blot analysis of SPAG9, pSTAT3 (Y705), STAT3, and HLA-G expression in control (E-AAVS and HLA-G OE-AAVS) and HLA-G OE pooled SPAG9 knockout (HLA-G OE SKO-1 and SKO-2) lung and melanoma BMICs, with GAPDH and β-tubulin serving as loading controls. 8 µg of protein was used and HLA-G shown is at a low exposure. All experiments were conducted in either duplicate or triplicate. (F) Western blot analysis of SPAG9 and HLA-G expression in a patient-derived primary lung cancer cell line (CRUK0748-XCL) derived from a subcutaneous xenograft (PDX) of the lung tumor. 10 µg of protein was used. BT917 HLA-G OE BMICs serves as a positive control for HLA-G expression, while β-tubulin serves as a loading control. HLA-G ~63 kDa and ~75 kDa represents the dimeric form, while HLA-G 43 kDa represents the monomeric form of the membrane HLA-G isoform 1 (HLA-G1) expressed in the respective cells as indicated, see ref. for reference. (G) Western blot analysis of SPAG9 expression in control (CRUK0748-XCL-AAVS) and the most efficient pooled SPAG9 knockout (CRUK0748-XCL-SKO) in patient-derived primary lung cancer cells (CRUK0748-XCL). β-tubulin serves as a loading control. Beneath is in vivo imaging system (PerkinElmer) used to acquire bioluminescence images of lung tumors formed by CRUK0748-XCL-AAVS and CRUK0748-XCL-SKO cells injected into the lung [intrathoracically (IT)] of NSG mice (n = 4 each). To the right is a bar graph depicting the radiance values of the lung tumor lesions. P value is indicated. (H) Flow cytometry analysis of GFP-positive CRUK0748-XCL cells isolated from minimally (2 wk) cultured brains of mice IT injected with CRUK0748-XCL-AAVS and CRUK0748-XCL-SKO cells (n = 4 mice each). To the right is the bar graph depicting % GFP-positive cells captured from the respective brains. P value is shown. (I) Bioluminescence images of brain lesions formed by CRUK0748-XCL-AAVS and CRUK0748-XCL-SKO cells injected into NSG mice IT (n = 3; no signal was obtained from the 4th mice brain set, which corresponds to the least % of cells captured from the respective mice brains—see E). To the right is a bar graph depicting the radiance values of the brain lesions. The P value is indicated. (J) Schematic illustration of the potential role of HLA-G and SPAG9 in STAT3 signaling. HLA-G interacts with SPAG9 either on the same tumor cell or an adjacent tumor cell. This interaction leads to the phosphorylation of STAT3 by a yet unidentified kinase, which then promotes BMICs’ self-renewal (secondary sphere formation) abilities and growth. Created with BioRender.com.

References

    1. Achrol A. S., et al. , Brain metastases. Nat. Rev. Dis. Primers. 5, 5 (2019), 10.1038/s41572-018-0055-y. - DOI - PubMed
    1. Fidler I. J., The biology of brain metastasis: Challenges for therapy. Cancer J. 21, 284–293 (2015), 10.1097/PPO.0000000000000126. - DOI - PubMed
    1. Stelzer K. J., Epidemiology and prognosis of brain metastases. Surg. Neurol. Int. 4 (suppl. 4), S192–S202 (2013), 10.4103/2152-7806.111296. - DOI - PMC - PubMed
    1. Quint L. E., et al. , Distribution of distant metastases from newly diagnosed non-small cell lung cancer. Ann. Thorac. Surg. 62, 246–250 (1996), 10.1016/0003-4975(96)00220-2. - DOI - PubMed
    1. Rastogi K., et al. , Palliation of brain metastases: Analysis of prognostic factors affecting overall survival. Ind. J. Palliat Care 24, 308–312 (2018), 10.4103/IJPC.IJPC_1_18. - DOI - PMC - PubMed

Publication types