. 2023 Jun;68(6):638-650.
doi: 10.1165/rcmb.2022-0264OC.

Targeting ATP12A, a Nongastric Proton Pump α Subunit, for Idiopathic Pulmonary Fibrosis Treatment

Affiliations

Targeting ATP12A, a Nongastric Proton Pump α Subunit, for Idiopathic Pulmonary Fibrosis Treatment

Mohamed Abdelgied et al. Am J Respir Cell Mol Biol. 2023 Jun.

Abstract

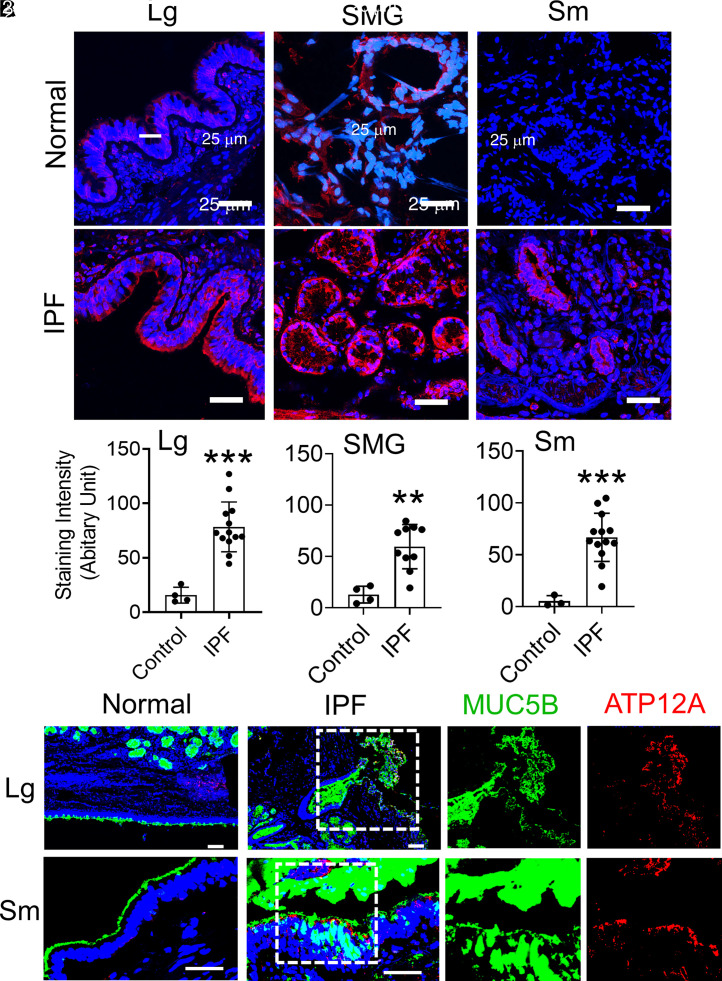
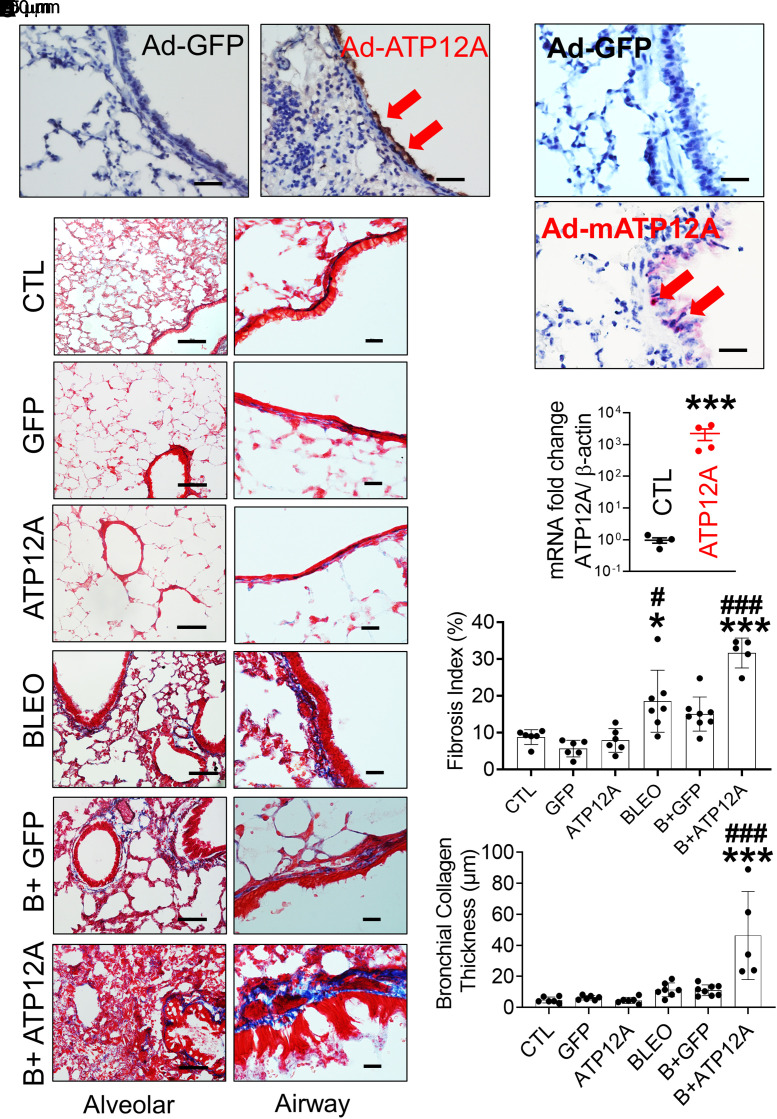
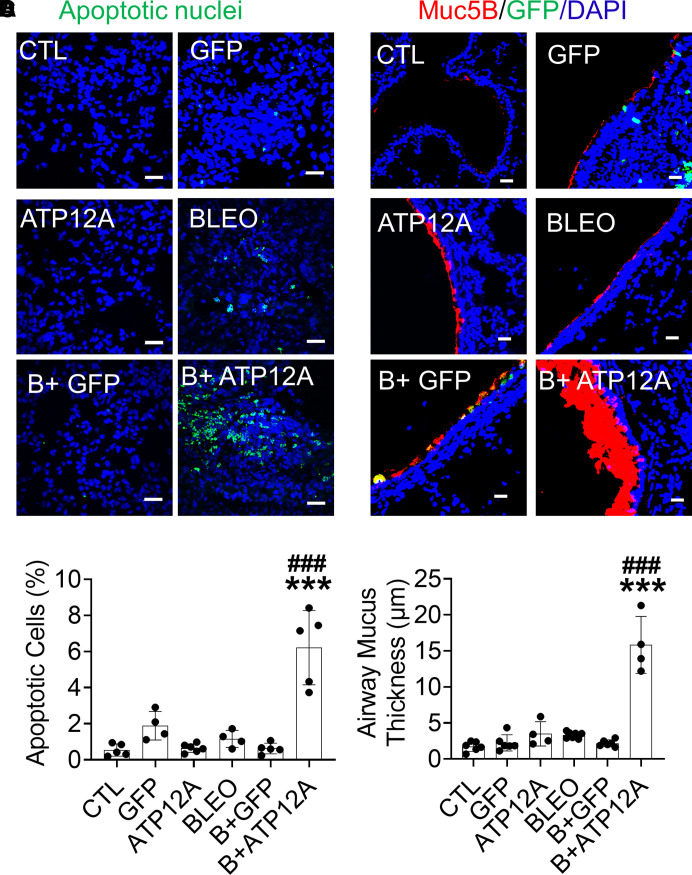
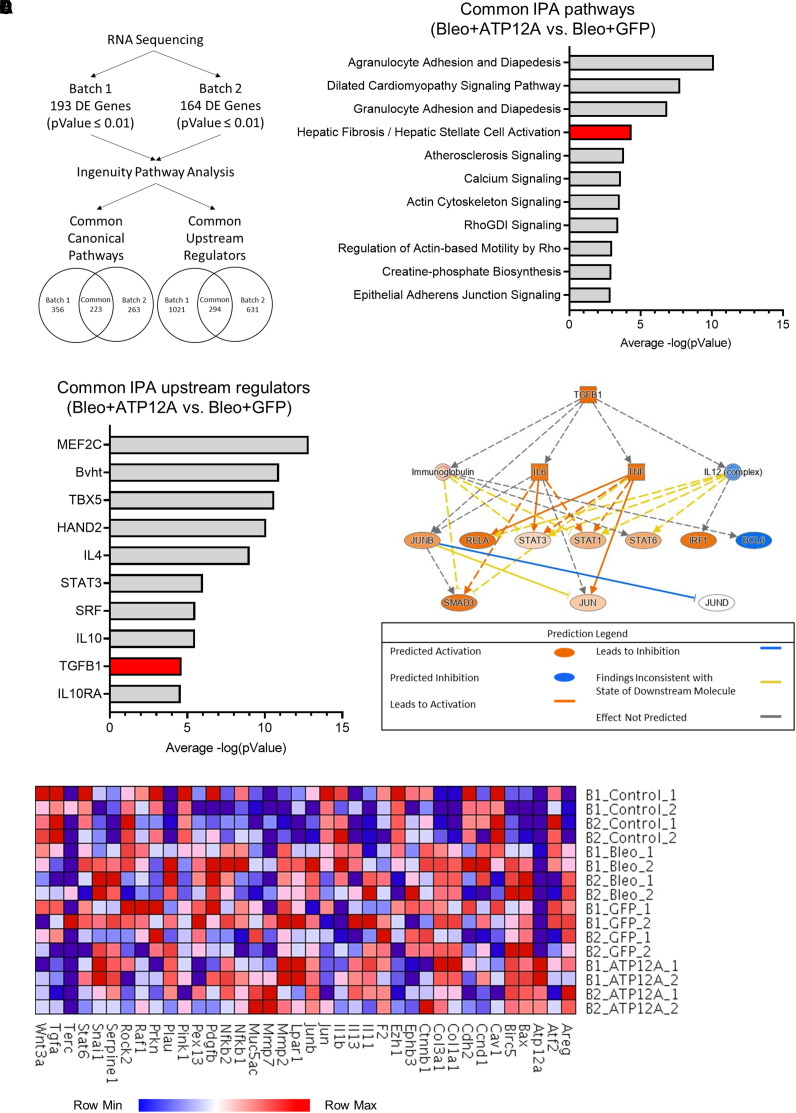
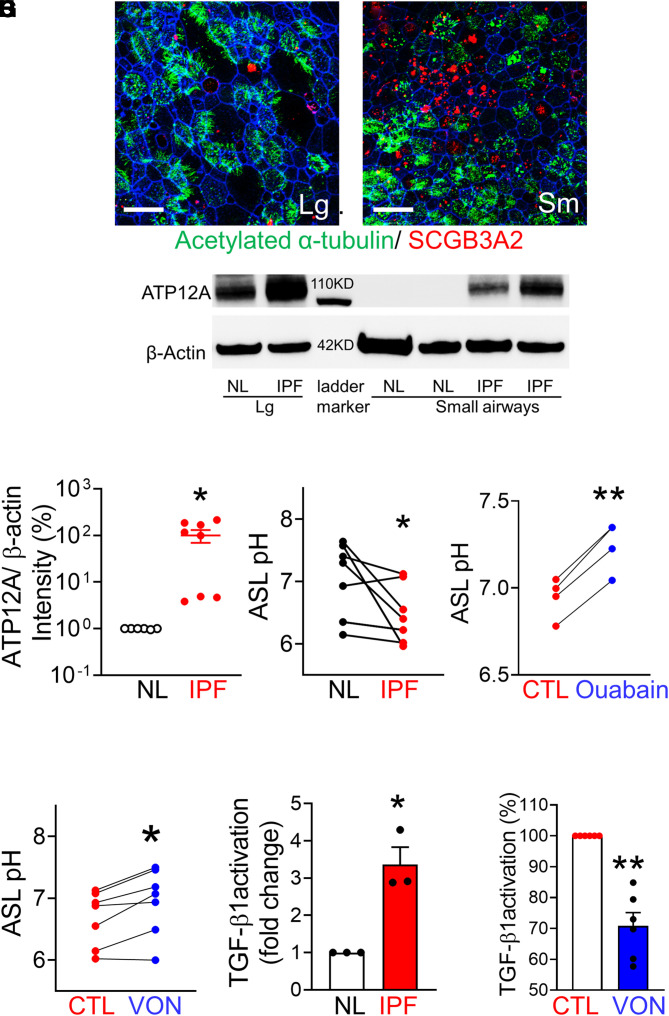
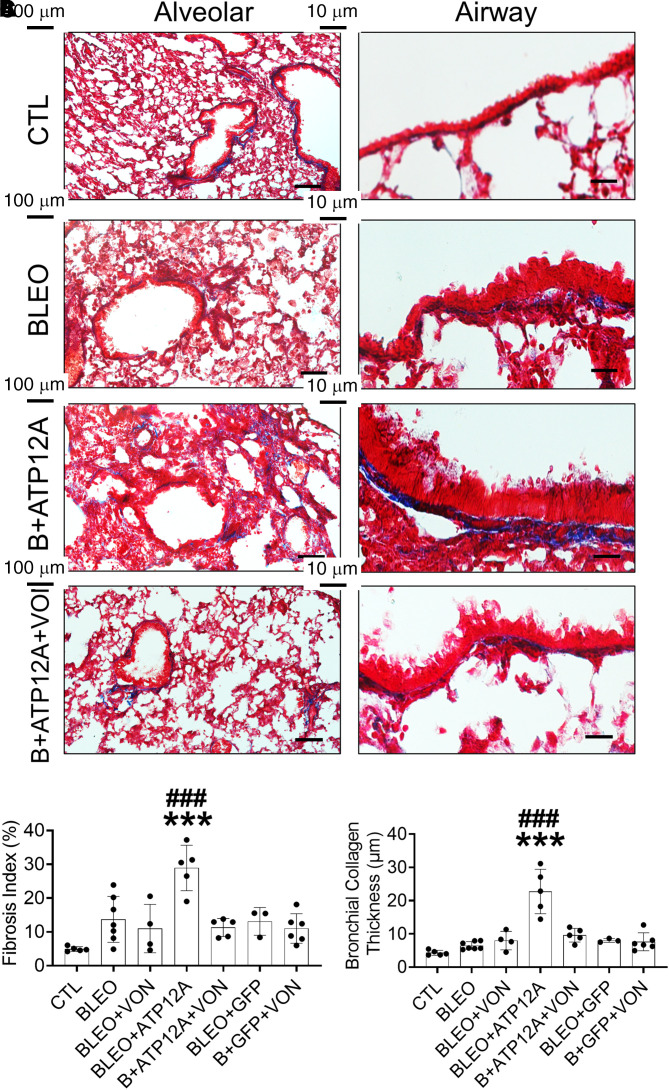
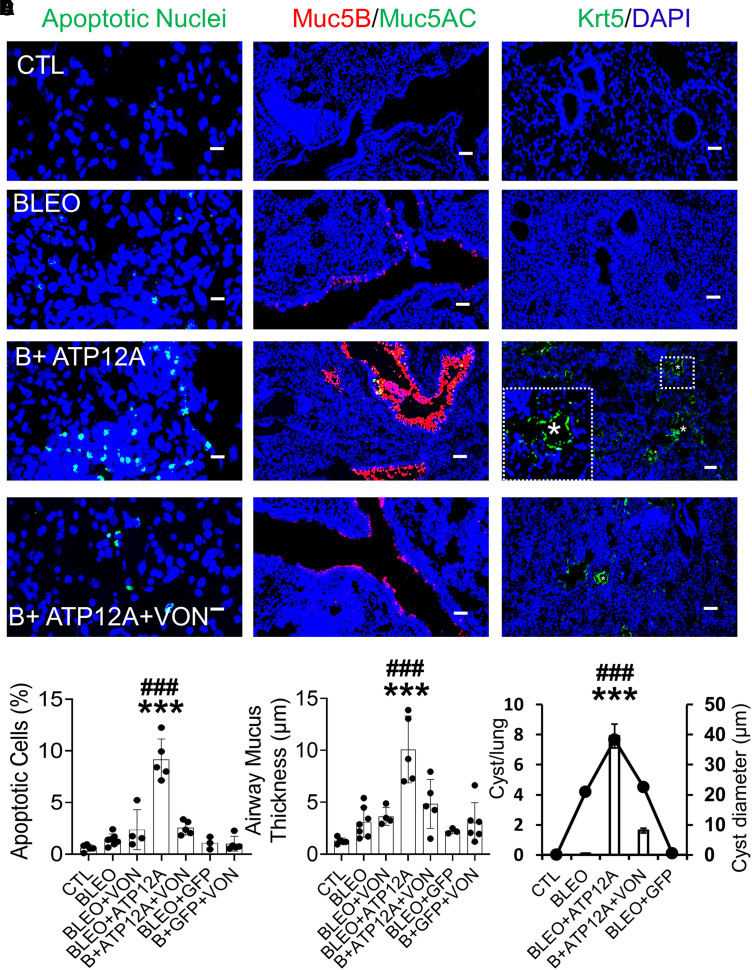
Idiopathic pulmonary fibrosis (IPF) is a pathological condition of unknown etiology that results from injury to the lung and an ensuing fibrotic response that leads to the thickening of the alveolar walls and obliteration of the alveolar space. The pathogenesis is not clear, and there are currently no effective therapies for IPF. Small airway disease and mucus accumulation are prominent features in IPF lungs, similar to cystic fibrosis lung disease. The ATP12A gene encodes the α-subunit of the nongastric H+, K+-ATPase, which functions to acidify the airway surface fluid and impairs mucociliary transport function in patients with cystic fibrosis. It is hypothesized that the ATP12A protein may play a role in the pathogenesis of IPF. The authors' studies demonstrate that ATP12A protein is overexpressed in distal small airways from the lungs of patients with IPF compared with normal human lungs. In addition, overexpression of the ATP12A protein in mouse lungs worsened bleomycin induced experimental pulmonary fibrosis. This was prevented by a potassium competitive proton pump blocker, vonoprazan. These data support the concept that the ATP12A protein plays an important role in the pathogenesis of lung fibrosis. Inhibition of the ATP12A protein has potential as a novel therapeutic strategy in IPF treatment.

Keywords: ATP12A; bleomycin; proton pump blocker; pulmonary fibrosis; small airways.


Figures

Figure 1.
Figure 1.
ATP12A (adenovirus-expressing mouse ATP12A [Ad-ATP12A]) and MUC5B (Mucin 5B) protein expression in human lung explants. (A) Representative confocal microscope images showing immunodetection of ATP12A (red) by immunofluorescence. Nuclei were counterstained by DAPI (blue). Scale bars, 25 μm. Images show the large airways (Lg), SMG, and small airways (Sm) of normal human lungs (upper panel) and human lungs with idiopathic pulmonary fibrosis (IPF) (lower panel). Sm are defined as airways having a diameter that is less than 2 mm. ATP12A overexpression was found in large and Sm as well as in the submucosal glands of IPF. (B) ATP12A immunofluorescence staining intensity quantification charts. Data are expressed as mean ± SD of 4 normal and 13 IPF lung samples. At least six lung sections were examined per donor, and ATP12A expression intensity was quantified in more than six Sm per donor. **P < 0.01 and ***P < 0.001, compared with control, respectively. (C) Representative confocal microscope images showing immunodetection of ATP12A (red) and MUC5B (green) in Lg and Sm of normal and IPF human lungs. Nuclei were counterstained by DAPI (blue). Scale bars, 25 μm. ATP12A and MUC5B were overexpressed in both Lg and Sm of IPF lungs. The dotted line squares indicate the area in the section that have been magnified to show the co-expression of MUC5B and ATP12A. SMG = submucosal glands.
Figure 2.
Figure 2.
Viral vector–mediated ATP12A expression in mouse lungs worsened bleomycin (BLEO)-induced pulmonary fibrosis. (A) Brightfield microscope images of Ad-GFP– and Ad-ATP12A–treated mouse lungs show expression of ATP12A in mouse airways (red arrows) (scale bars, 25 µm). (B) Brightfield microscope images show ATP12A mRNA detection (red arrows) by in situ hybridization. Nuclei were counterstained by hematoxylin (light blue). Scale bars, 25 μm. (C) qRT-PCR analysis of ATP12A gene expression level in mouse lungs. Data are expressed as mean ± SD. ***P < 0.001, compared with CTL. (D) Bright-field microscope images of mouse lung tissue stained with Masson’s trichrome show collagen deposition (blue) in the lung, with the left panel showing collagen deposition throughout the lung (scale bars, 100 μm) and the right panel showing collagen deposition in the peribronchial region (scale bars, 10 μm). (E) The chart shows the fibrosis index in the experimental mouse lungs. Data are expressed as mean ± SD. n ⩾ 5 animals per group. (F) The chart shows parabronchial collagen thickness (in micrometers) in mouse lungs. Data are expressed as mean ± SD. n ⩾ 5 animals per group. B+ATP12A = BLEO and Ad-ATP12A–treated group; B+GFP = BLEO and Ad-GFP–treated group; CTL = untreated control group; GFP = adenovirus-expressing GFP (Ad-GFP)–treated group. *P < 0.05 and ***P < 0.001, compared with CTL, respectively. #P < 0.05 and ###P < 0.001, compared with BLEO-treated group.
Figure 3.
Figure 3.
Viral vector–mediated ATP12A expression in mouse airways worsens BLEO-induced alveolar epithelium apoptosis and airway mucus accumulation. (A) Confocal microscope images show cellular apoptosis of lung epithelial cells by TUNEL staining. Apoptotic cell nuclei are stained green. Scale bars, 25 μm. (B) The chart shows the percentage of apoptotic cells in mouse lungs. Data are expressed as mean ± SD, with n ⩾ 5 animals per group. (C) Confocal microscope images show immunodetection of MUC5B (red) by immunofluorescence. Nuclei were counterstained by DAPI (blue). Scale bars, 25 μm. (D) The chart shows airway mucus thickness in mouse lungs. Data are expressed as mean ± SD. n ⩾ 5 animals per group. ***P < 0.001, compared with CTL, respectively. ###P < 0.001, compared with BLEO-treated group.
Figure 4.
Figure 4.
Viral vector–mediated ATP12A expression in mouse lungs enhanced fibrotic pathway and transforming growth factor β1 (TGF-β1) signaling pathway in BLEO-induced pulmonary fibrosis. (A) Diagram showing the data analysis workflow. Data was collected from the bulk RNA sequencing of mouse lung tissue after treatment with BLEO and the adenovirus-mediated expression of GFP or ATP12A. Sequencing and differential expression analysis were performed on two batches of samples (P = 0.01). The lists of differentially expressed genes were submitted to QIAGEN Ingenuity Pathway Analysis (IPA) to identify canonical pathways and upstream regulators. (B) The common canonical pathways from the BLEO and ATP12A versus BLEO and GFP comparison in each batch were compiled and arranged according to the average −log(value), as calculated by IPA. The hepatic fibrosis and hepatic stellate cell activation pathway is highlighted in red. (C) Common upstream regulators were identified between the BLEO and ATP12A versus BLEO and GFP comparison in the two batches and arranged on the basis of the average −log(pValue) calculated by IPA. The TGF-β1 upstream regulator is highlighted in red. (D) Pathway diagram displaying the predicted activation states of molecules in the TGF-β1 signaling pathway based on differential gene expression data submitted to IPA. (E) Heatmap displaying the expression levels of selected genes from the IPF pathway, as listed by IPA, as well as genes of interest included by the authors (Atp12A and Muc5ac).
Figure 5.
Figure 5.
ATP12A expression was increased in IPF small airways in vitro. (A and B) Human large (A) and small (B) airway epithelial cultures. Scale bars, 25 μm. Red indicates small airway epithelial cell marker SCGB3A2, green indicates acetylated α-tubulin, and blue indicates F-actin. (C) ATP12 expression was detected by immunoblotting in culture large and small airway cells from normal (NL) and IPF lungs. (D) Semiquantification of band intensity showed that ATP12A expression in IPF small airway culture was increased ∼100-fold, compared with NL. n = 8. *P < 0.05. (E) Airway surface liquid (ASL) pH is lower in IPF small airways, compared with normal lung small airways. n = 9. *P < 0.05. (F) Ouabain increased ASL pH in IPF small airways. n = 4. **P < 0.05 versus CTL. (G) Vonoprazan (VON) increased ASL pH in IPF small airways. n = 7. *P < 0.05 versus CTL. (H) IPF small airway apical surface activated more latent TGF-β1. n = 3. *P < 0.05. (I) VON decreased 30% of TGF-β1 activation in IPF small airways. n = 6. **P < 0.01.
Figure 6.
Figure 6.
Inhibition of ATP12A by potassium-competitive proton pump blocker VON reduced BLEO-induced pulmonary fibrosis in mice expressing ATP12A. (A) Bright-field microscope images of mouse lung tissue stained with Masson’s trichrome show collagen deposition (blue) in the lung; the left panel shows collagen deposition throughout the lung (scale bars, 100 μm), and the right panel shows collagen deposition in the peribronchial area (scale bars, 10 μm). (B) The chart shows the fibrosis index in mouse lungs. Data are expressed as mean ± SD, with n ⩾ 5 animals per group. (C) The chart shows parabronchial collagen thickness (in micrometers) in mouse lungs. Data are expressed as mean ± SD. n ⩾ 5 animals per group. ***P < 0.001 compared to CTL; ###P < 0.001 compared to B+ATP12A+VON.
Figure 7.
Figure 7.
Inhibition of ATP12A by potassium-competitive proton pump blocker VON reduced BLEO-induced alveolar epithelium apoptosis, airway mucus accumulation, and honeycomb cyst formation in mice expressing ATP12A. (A) Confocal microscope images show cellular apoptosis of lung epithelial cells by TUNEL staining. Apoptotic cell nuclei are stained green. Scale bars, 25 μm. (B) The chart shows the percentage of apoptotic cells in mouse lungs. Data are expressed as mean ± SD. n ⩾ 5 animals per group. (C) Confocal microscope images show the immunodetection of MUC5B (red) and MUC5AC (green) by immunofluorescence. Nuclei were counterstained by DAPI (blue). Scale bars, 25 μm. (D) The chart shows airway mucus thickness in mouse lungs. Data are expressed as mean ± SD. n ⩾ 5 animals per group. (E) Confocal microscope images show immunodetection of keratin 5 (Krt5, basal cell marker in green) by immunofluorescence. The inset shows a honeycomb cyst (white asterisk) with Krt5 + cell lining (green). Nuclei were counterstained by DAPI (blue). Scale bars, 25 μm. (F) The chart shows the number of honeycomb cysts per right middle lung lobe (column chart) and the average diameter of honeycomb cysts (linear plot). Data are expressed as mean ± SD. n ⩾ 3 animals per group. ***P < 0.001 compared to CTL; ###P < 0.001 compared to B+ATP12A+VON.

Comment in

References

    1. Blackwell TS, Tager AM, Borok Z, Moore BB, Schwartz DA, Anstrom KJ, et al. Future directions in idiopathic pulmonary fibrosis research. An NHLBI workshop report. Am J Respir Crit Care Med . 2014;189:214–222. - PMC - PubMed
    1. Pardo A, Selman M. The interplay of the genetic architecture, aging, and environmental factors in the pathogenesis of idiopathic pulmonary fibrosis. Am J Respir Cell Mol Biol . 2021;64:163–172. - PubMed
    1. Fonseca C, Abraham D, Black CM. Lung fibrosis. Springer Semin Immunopathol . 1999;21:453–474. - PubMed
    1. King TE, Jr, Albera C, Bradford WZ, Costabel U, du Bois RM, Leff JA, et al. All-cause mortality rate in patients with idiopathic pulmonary fibrosis. Implications for the design and execution of clinical trials. Am J Respir Crit Care Med . 2014;189:825–831. - PubMed
    1. Richeldi L, du Bois RM, Raghu G, Azuma A, Brown KK, Costabel U, et al. INPULSIS Trial Investigators Efficacy and safety of nintedanib in idiopathic pulmonary fibrosis. N Engl J Med . 2014;370:2071–2082. - PubMed

Publication types