. 2023 Aug;19(8):2296-2317.
doi: 10.1080/15548627.2023.2180202. Epub 2023 Feb 28.

Reduced secretion of LCN2 (lipocalin 2) from reactive astrocytes through autophagic and proteasomal regulation alleviates inflammatory stress and neuronal damage

Affiliations

Reduced secretion of LCN2 (lipocalin 2) from reactive astrocytes through autophagic and proteasomal regulation alleviates inflammatory stress and neuronal damage

Byung-Kwon Jung et al. Autophagy. 2023 Aug.

Abstract

LCN2/neutrophil gelatinase-associated lipocalin/24p3 (lipocalin 2) is a secretory protein that acts as a mammalian bacteriostatic molecule. Under neuroinflammatory stress conditions, LCN2 is produced and secreted by activated microglia and reactive astrocytes, resulting in neuronal apoptosis. However, it remains largely unknown whether inflammatory stress and neuronal loss can be minimized by modulating LCN2 production and secretion. Here, we first demonstrated that LCN2 was secreted from reactive astrocytes, which were stimulated by treatment with lipopolysaccharide (LPS) as an inflammatory stressor. Notably, we found two effective conditions that led to the reduction of induced LCN2 levels in reactive astrocytes: proteasome inhibition and macroautophagic/autophagic flux activation. Mechanistically, proteasome inhibition suppresses NFKB/NF-κB activation through NFKBIA/IκBα stabilization in primary astrocytes, even under inflammatory stress conditions, resulting in the downregulation of Lcn2 expression. In contrast, autophagic flux activation via MTOR inhibition reduced the intracellular levels of LCN2 through its pre-secretory degradation. In addition, we demonstrated that the N-terminal signal peptide of LCN2 is critical for its secretion and degradation, suggesting that these two pathways may be mechanistically coupled. Finally, we observed that LPS-induced and secreted LCN2 levels were reduced in the astrocyte-cultured medium under the above-mentioned conditions, resulting in increased neuronal viability, even under inflammatory stress.Abbreviations: ACM, astrocyte-conditioned medium; ALP, autophagy-lysosome pathway; BAF, bafilomycin A1; BTZ, bortezomib; CHX, cycloheximide; CNS, central nervous system; ER, endoplasmic reticulum; GFAP, glial fibrillary acidic protein; GFP, green fluorescent protein; JAK, Janus kinase; KD, knockdown; LCN2, lipocalin 2; LPS, lipopolysaccharide; MACS, magnetic-activated cell sorting; MAP1LC3/LC3, microtubule-associated protein 1 light chain 3; MTOR, mechanistic target of rapamycin kinase; NFKB/NF-κB, nuclear factor of kappa light polypeptide gene enhancer in B cells 1, p105; NFKBIA/IκBα, nuclear factor of kappa light polypeptide gene enhancer in B cells inhibitor, alpha; OVEX, overexpression; SLC22A17, solute carrier family 22 member 17; SP, signal peptide; SQSTM1, sequestosome 1; STAT3, signal transducer and activator of transcription 3; TNF/TNF-α, tumor necrosis factor; TUBA, tubulin, alpha; TUBB3/β3-TUB, tubulin, beta 3 class III; UB, ubiquitin; UPS, ubiquitin-proteasome system.

Keywords: Autophagy; lipocalin 2 (LCN2); proteasome; protein degradation; reactive astrocyte; secretory protein.


Conflict of interest statement

The authors declare no competing interests.

Figures
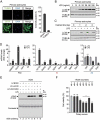
Figure 1.
Figure 1.
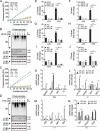
Reactive astrocytes secrete LCN2 and induce neuronal loss under LPS-treated conditions. (A) Primary astrocytes isolated from mouse pup brains were stained with antibodies against a neuronal marker, TUBB3/β3-TUB (tubulin, beta 3 class III), and an astrocyte marker, glial fibrillary acidic protein (GFAP). DNA was visualized by staining with DAPI. The percentage of TUBB3-positive neurons and GFAP-positive astrocytes was calculated based on the DAPI-positive total cell number (n = 3, >50 cells). (B) Immunoblot detection of LCN2 in astrocytes treated with low to high concentrations of LPS (0–1000 ng/mL). (C) LCN2 levels in astrocytes exposed to 100 ng/mL of LPS for 1 to 3 d were detected via immunoblotting. For immunoblot analysis, TUBA/α-TUB (tubulin, alpha) was used as a loading control. (D) Primary astrocytes were treated with 100 ng/mL of LPS or PBS for 1 d. The mRNA levels of pan markers (Serpina3n, Cxcl10, Osmr, and Cp), A1 markers (H2-T23, Serping1, H2-D1, Ugt1a, Fbln5, Srgn, Ggta1, and Gbp2), and A2 markers (Clcf1, S100a10, and Emp1) in the negative control group (−LPS) and LPS-treated group (+LPS) were measured via qRT-PCR, normalized against Gapdh levels, and expressed as a fold change relative to the levels in the negative control group (n = 3; two-tailed unpaired t-test). (E) Immunoblot detection of LCN2 secreted from astrocytes cultured under various conditions, including transduction with lentivirus (LV) and treatment with 100 ng/mL of LPS. Lcn2 knockdown (KD) and LCN2 overexpression (OVEX) were performed via LV infection. LV MOCK was used as a negative control. For the astrocyte-conditioned medium (ACM), Coomassie blue staining of polyacrylamide gels was used as a loading control. Depending on the conditions described above, the ACM was numbered between 1 and 8. The protein concentration in ACM was about 3 mg/mL based on the BCA protein assay. (F) Primary neurons were isolated from mouse embryos and treated with the numbered ACM (total 3 mg of protein) for 3 d. The viability of cultured neurons was measured using the MTT assay (n = 3; Kruskal-Wallis one-way ANOVA, followed by Tukey’s multiple comparison test). Neuronal viability was expressed as a percentage relative to the control (ACM 1). Representative images of cells or immunoblots are shown. qRT-PCR and MTT assay data are expressed as the means ± SEM from the indicated number of samples. *p < 0.05; **p < 0.01; ***p < 0.001 vs. the control or between two groups as indicated by the horizontal bars. n.s, not significant. Scale bar: 100 μm.
Figure 2.
Figure 2.
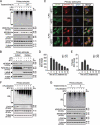
Proteasome inhibition alters the expression of NFKB target genes and astrocyte reactivation markers. (A) LPS-treated (or untreated) and MG132-treated (0, 1, and 5 μM) astrocytes were subjected to the proteasome activity assay (n = 3). (B) Immunoblot detection of ubiquitin conjugates (UBn), LCN2, and GFAP in astrocytes treated with PBS (−LPS) or 100 ng/mL of LPS (+LPS), and low to high concentrations of MG132 (0, 1, and 5 μM) for 1 d. (C) The proteasome activity assay was performed as described in (A) following treatment with bortezomib (BTZ) instead of MG132 (n = 3). (D) Immunoblot detection was performed as described in (B) following treatment with BTZ instead of MG132. TUBA was used as a loading control in the immunoblot analysis. (E, F) Astrocytes were treated with 100 ng/mL of LPS (or untreated) and low to high concentrations of MG132 (0, 1, and 5 μM) for 1 d. Subsequently, the mRNA levels of Lcn2 and Tnf were measured via qRT-PCR, normalized against Gapdh levels, and expressed as a fold change relative to the control (n = 3; one-way ANOVA, followed by Tukey’s multiple comparison test). (G to J) Astrocytes were treated with 100 ng/mL of LPS (or untreated) and low to high concentrations of BTZ (0, 1, and 5 μM) for 1 d. The mRNA levels of Lcn2, Tnf, Il1a, and C3 were measured via qRT-PCR, normalized against Gapdh levels, and expressed as a fold change relative to the control (n = 3; one-way ANOVA, followed by Tukey’s multiple comparison test). (K to N) Primary astrocytes were treated with 100 ng/mL of LPS (or untreated) and 1 μM of BTZ (or untreated) for 1 d. Thereafter, mRNA levels of pan, A1, and A2 markers in the control, BTZ-, LPS-, and both BTZ and LPS-treated groups were measured via qRT-PCR. The mRNA levels were normalized against Gapdh levels and expressed as a fold change relative to the levels in the control group (n = 3; one-way ANOVA, followed by Tukey’s multiple comparison test). Representative images of immunoblots are shown. qRT-PCR data are expressed as the means ± SEM from the indicated number of samples. *p < 0.05, **p < 0.01; ***p < 0.001 vs. the control or between two groups as indicated by the horizontal bars. n.s, not significant.
Figure 3.
Figure 3.
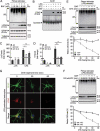
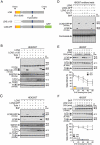
Proteasome inhibition suppresses the activation of NFKB signaling. (A) Immunoblot detection of UBn, NFKB RELA/p65, NFKBIA/IκBα, LCN2, and GFAP in astrocytes treated with PBS (−LPS) or 100 ng/mL of LPS (+LPS) and 1 μM of BTZ (or untreated) for 1 or 24 h. (B) Cytosolic and nuclear fractions isolated from astrocytes treated with PBS (−LPS) or 100 ng/mL of LPS (+LPS) and 1 μM of BTZ (or untreated) for 1 h were subjected to immunoblot detection of NFKBIA and NFKB RELA. TUBA and LMNB (lamin B1) were used as loading controls for the cytosolic and nuclear proteins, respectively. (C) Primary astrocytes treated with PBS (−LPS) or 100 ng/mL of LPS (+LPS) and DMSO (−BTZ) or 1 μM of BTZ (+BTZ) for 1 h were immunostained for GFAP and NFKB RELA. DNA was visualized with DAPI. (D, E) During the course of treatment with 1 μM BTZ, Lcn2 and Tnf expression levels were determined via qRT-PCR. The mRNA levels were normalized against Gapdh levels and expressed as a fold change relative to the levels in the negative control group (n = 3). (F) UBn, LCN2, and GFAP levels in LPS-pretreated reactive astrocytes were detected via immunoblot analysis during the course of treatment with 1 μM BTZ. (G) Immunoblot detection of UBn, NFKB RELA, NFKBIA, LCN2, and GFAP in astrocytes pretreated with PBS (−LPS) or 100 ng/mL of LPS (+LPS) for 24 h, and then treated with DMSO (−BTZ) or 1 μM of BTZ (+BTZ) for 1 and 3 h. For immunoblot analysis, TUBA was used as a loading control. Representative images of cells or immunoblots are shown. qRT-PCR data are expressed as the means ± SEM from the indicated number of samples. Scale bar: 20 μm.
Figure 4.
Figure 4.
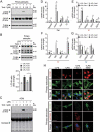
The autophagy-lysosome pathway degrades intracellular LCN2. (A) Astrocytes treated with PBS (−LPS) or 100 ng/mL of LPS (+LPS) and DMSO (0 nM) or 50 to 100 nM of bafilomycin A1 (BAF) were subjected to immunoblot detection of UBn, LCN2, and GFAP. (B) Immunoblot detection of secreted LCN2 from astrocytes treated with 100 ng/mL LPS (or untreated), 1 μM BTZ (or untreated), and 100 nM BAF (or untreated). For ACM, equal loading was evaluated via Coomassie blue staining of polyacrylamide gels. (C, D) Astrocytes were treated with 100 ng/mL of LPS and the indicated concentrations of BAF. Lcn2 and Tnf expression levels were determined via qRT-PCR, normalized against Gapdh levels, and expressed as a fold change relative to the control (n = 3; one-way ANOVA, followed by Tukey’s multiple comparison test). (E, F) Astrocytes were pretreated with 100 ng/mL of LPS for 1 d to induce the de novo synthesis of LCN2 before cycloheximide (CHX) chasing. In (E), LPS-induced intracellular LCN2 in astrocytes was chased with a medium containing 10 μg/mL of CHX, 100 ng/mL of LPS, and DMSO (−BAF) or 100 nM of BAF for up to 80 min. In (F), after adding 1 μM of BTZ, LPS-induced intracellular LCN2 was chased for up to 80 min according to the conditions described above. Relative LCN2 levels in cells over time were normalized to TUBA and expressed as a percentage relative to the zero-chasing time (0 min) (n = 3). (G) Before CHX chase, LCN2 was induced in astrocytes after treatment with 100 ng/mL of LPS for 1 d. During CHX chase for up to 60 min, LCN2 and GFAP levels were monitored at the cellular level with anti-LCN2 and anti-GFAP antibodies, and DNA was visualized with DAPI. Representative images of cells or immunoblots are shown. qRT-PCR and CHX chase data are expressed as the means ± SEM from the indicated number of samples. **p < 0.01; ***p < 0.001 vs. the control or between two groups as indicated by the horizontal bars. n.s, not significant. Scale bar: 20 μm.
Figure 5.
Figure 5.
Autophagic flux activation reduces the levels of LPS-induced LCN2. (A) Immunoblot analysis was performed to detect intracellular LCN2 and GFAP levels in astrocytes treated with PBS (−LPS) or 100 ng/mL of LPS (+LPS) and DMSO (0 μM) or two different concentrations of torin 1 (0.5 and 2 μM). (B) In the absence or presence of LPS (100 ng/mL) and torin 1 (0.5 μM), alterations of autophagy-related proteins, including MAP1LC3/LC3 (microtubule-associated protein 1 light chain 3) and SQSTM1/p62 (sequestosome 1), were measured by immunoblotting. The LC3-II:I ratio was calculated based on the intensity of each band (n = 3; Kruskal-Wallis one-way ANOVA, followed by Tukey’s multiple comparison test). (C) Immunoblot detection of secreted LCN2 from astrocytes treated with LPS and torin 1 as described in (A). (D to G) The mRNA levels of pan, A1, and A2 markers in the control, torin 1-, LPS-, and both torin 1 and LPS-treated groups were measured via qRT-PCR, normalized against Gapdh levels, and expressed as a fold change relative to the levels in the control group (n = 3; one-way ANOVA, followed by Tukey’s multiple comparison test). (H) After treatment with LPS (100 ng/mL), torin 1 (2 μM), and bafilomycin A1 (BAF, 100 nM), primary astrocytes were stained with anti-GFAP and anti-LCN2 antibodies, and DNA was visualized with DAPI (top). Under the same conditions, astrocytes were stained with anti-LCN2 antibody, and the DNA and lysosomal contents were visualized with DAPI and LysoTracker, respectively (bottom). Representative images of cells or immunoblots are shown. qRT-PCR data are expressed as the means ± SEM from the indicated number of samples. *p < 0.05, **p < 0.01; ***p < 0.001 vs. the control or between two groups as indicated by the horizontal bars. n.s, not significant. Scale bar: 20 μm.
Figure 6.
Figure 6.
Effects of bortezomib and torin 1 in LPS-treated MS astrocytes. (A) MS astrocytes were treated with LPS (or untreated), with ACM collected from control MD astrocytes (MD ACM, −LPS), or with ACM collected from LPS-treated MD astrocytes (MD ACM, +LPS). The Lcn2 expression levels were determined via qRT-PCR, normalized against Gapdh levels, and expressed as a fold change relative to the control (n = 3; one-way ANOVA, followed by Tukey’s multiple comparison test). (B) During MD ACM (+LPS) treatment, MS astrocytes were co-treated with BTZ (1 μM) or torin 1 (1 μM) for 24 h. The mRNA levels of Lcn2 in MS astrocytes treated with MD ACM (−LPS or +LPS) or MD ACM (+LPS) with BTZ or torin 1 were measured via qRT-PCR, normalized against Gapdh levels, and expressed as a fold change relative to the control (n = 3; one-way ANOVA, followed by Tukey’s multiple comparison test). (C) ACM collected from MS astrocytes (MS ACM), which were treated with LPS (or untreated), was subjected to immunoblot detection of LCN2 and Coomassie blue staining as a loading control. (D) Under the same conditions as in (B), the mRNA levels of pan, A1, and A2 markers were measured via qRT-PCR, normalized against Gapdh levels, and expressed as a fold change relative to the levels in the control group (MD ACM (−LPS) (n = 3; one-way ANOVA, followed by Tukey’s multiple comparison test). (E) MS ACM, which was collected from MS astrocytes treated with MD ACM (−LPS or +LPS) in the presence of DMSO (−BTZ or −Torin 1), BTZ, or torin 1, was subjected to immunoblot detection of LCN2. To use as negative control (NC) and positive control (PC), MD ACM (−LPS or +LPS, respectively) was diluted to 1:3 in MS medium. Representative images of immunoblots are shown. qRT-PCR data are expressed as the means ± SEM from the indicated number of samples. *p < 0.05, **p < 0.01; ***p < 0.001 vs. the control or between two groups as indicated by the horizontal bars. n.s, not significant.
Figure 7.
Figure 7.
Signal peptide is essential for the secretion and degradation of LCN2. (A) Graphical representation of LCN2, a mutant LCN2 with 20 N-terminal amino acids deleted (LCN2 Δ1-20), and LCN2 tagged with a C-terminal GFP (LCN2-GFP). (B, C) Immunoblot detection of LCN2, LCN2-GFP, LCN2 Δ1-20, SQSTM1, and MAP1LC3 in HEK293T cells based on the types of LCN2 constructs transfected. After transfection, cells were treated with control vehicle (DMSO), torin 1, or BAF for 1 d. TUBA was used as a loading control. Asterisks indicate nonspecific bands. (D) Conditioned medium collected from HEK293T cells under various conditions as described above was subjected to immunoblot detection of secreted LCN2, LCN2-GFP, and LCN2 Δ1-20. For HEK293T-conditioned medium, Coomassie blue staining of polyacrylamide gels was used as a loading control. (E, F) Cycloheximide (CHX) chase of exogenous LCN2 or LCN2 Δ1-20. HEK293T cells were transfected with LCN2 or LCN2 Δ1-20 before BAF and CHX treatment. One day after transfection, intracellular LCN2 was chased in a medium containing 10 μg/mL CHX with or without BAF for up to 80 min. Changes in the LC3-II:I ratio over time indicate BAF activity. TUBA was used as a loading control. CHX-chased LCN2 or LCN2 Δ1-20 levels were normalized to TUBA levels and expressed as a percentage relative to the zero-chasing time (0 min) (n = 3). Representative immunoblots are shown. CHX chase data are expressed as the means ± SEM from the indicated number of samples.
Figure 8.
Figure 8.
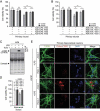
Neuronal viability is restored by proteasome inhibition and autophagy activation. (A, B) Astrocytes were infected with scrambled (−Lcn2 KD) or Lcn2 KD lentivirus (+Lcn2 KD) for 1 d, and then treated with PBS (−LPS) or LPS (+LPS), and control vehicle (DMSO [−BTZ, −Torin 1]), BTZ (+BTZ), or torin 1 (+Torin 1) for 2 d. Thereafter, the ACM was collected and treated to primary cortical neurons for 3 d, and the viability of neurons was measured using the MTT assay. Cell viability was expressed as a percentage relative to the control (n = 3; one-way ANOVA, followed by Tukey’s multiple comparison test). (C) Immunoblot detection of LCN2 secreted from astrocytes into ACM after LPS and torin 1 treatment. For ACM, Coomassie blue staining was used as a loading control. (D) The MTT assay was performed to measure the viability of hippocampal neurons treated with ACM collected from astrocytes and with LPS and torin 1 as described above. Cell viability was expressed as a percentage relative to the control (n = 3; Kruskal-Wallis one-way ANOVA, followed by Tukey’s multiple comparison test). (E) After ACM treatment, primary hippocampal neurons were immunostained with TUBB3 and Cleaved CASP3/CC3 (cleaved-caspase 3). DNA was visualized with DAPI. Representative images of cells or immunoblots are shown. MTT assay data are expressed as the means ± SEM from the indicated number of samples. *p < 0.05; **p < 0.01; ***p < 0.001 vs. the control or between two groups as indicated by the horizontal bars. n.s, not significant. Scale bar: 20 μm.
Figure 9.
Figure 9.
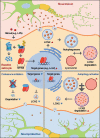
Graphical representation of LPS-induced neurotoxicity and alleviation mechanisms of proteasome inhibition and autophagy activation in astrocytes. Inflammatory stress induced by LPS stimulation promotes degradation of NFKBIA/IκBα and nuclear translocation of NFKB RELA/p65, which increases the expression of Lcn2, making astrocytes reactive. LCN2 is rapidly degraded by autophagy-lysosome pathway, but undegraded LCN2 can be secreted from the cells and act as neurotoxin (top). Upon proteasome inhibition, degradation of NFKBIA and nuclear translocation of NFKB RELA are inhibited, thus Lcn2 expression levels are reduced along with secreted amount of LCN2 (bottom left). Upon activation of autophagy, degradation of LCN2 is promoted and the amount of secreted LCN2 is subsequently decreased (bottom right).

References

    1. Neilands JB. Siderophores: structure and function of microbial iron transport compounds. J Biol Chem. 1995. Nov 10;270(45):26723–26726. - PubMed
    1. Yang J, Goetz D, Li JY, et al. An iron delivery pathway mediated by a lipocalin. Mol Cell. 2002. Nov;10(5):1045–1056. - PubMed
    1. Flo TH, Smith KD, Sato S, et al. Lipocalin 2 mediates an innate immune response to bacterial infection by sequestrating iron. Nature. 2004. Dec 16;432(7019):917–921. - PubMed
    1. Kjeldsen L, Johnsen AH, Sengelov H, et al. Isolation and primary structure of NGAL, a novel protein associated with human neutrophil gelatinase. J Biol Chem. 1993. May 15;268(14):10425–10432. - PubMed
    1. Goetz DH, Willie ST, Armen RS, et al. Ligand preference inferred from the structure of neutrophil gelatinase associated lipocalin. Biochemistry. 2000. Feb 29;39(8):1935–1941. - PubMed

Publication types

MeSH terms