. 2023 Jul;209(4):721-735.
doi: 10.1007/s00359-023-01615-z. Epub 2023 Feb 13.

Global inhibition in head-direction neural circuits: a systematic comparison between connectome-based spiking neural circuit models

Affiliations

Global inhibition in head-direction neural circuits: a systematic comparison between connectome-based spiking neural circuit models

Ning Chang et al. J Comp Physiol A Neuroethol Sens Neural Behav Physiol. 2023 Jul.

Abstract

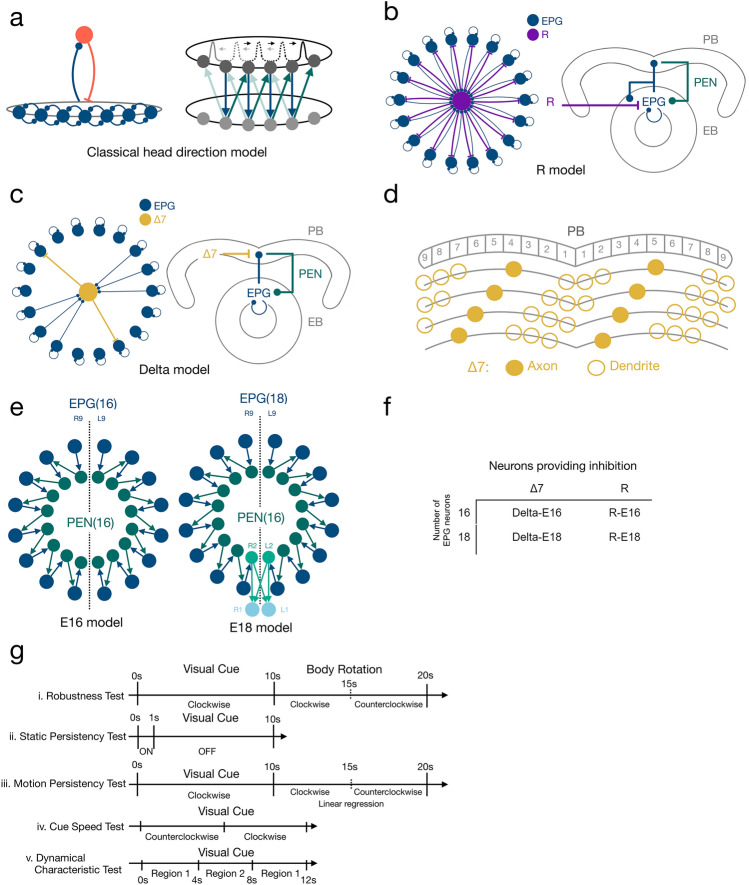
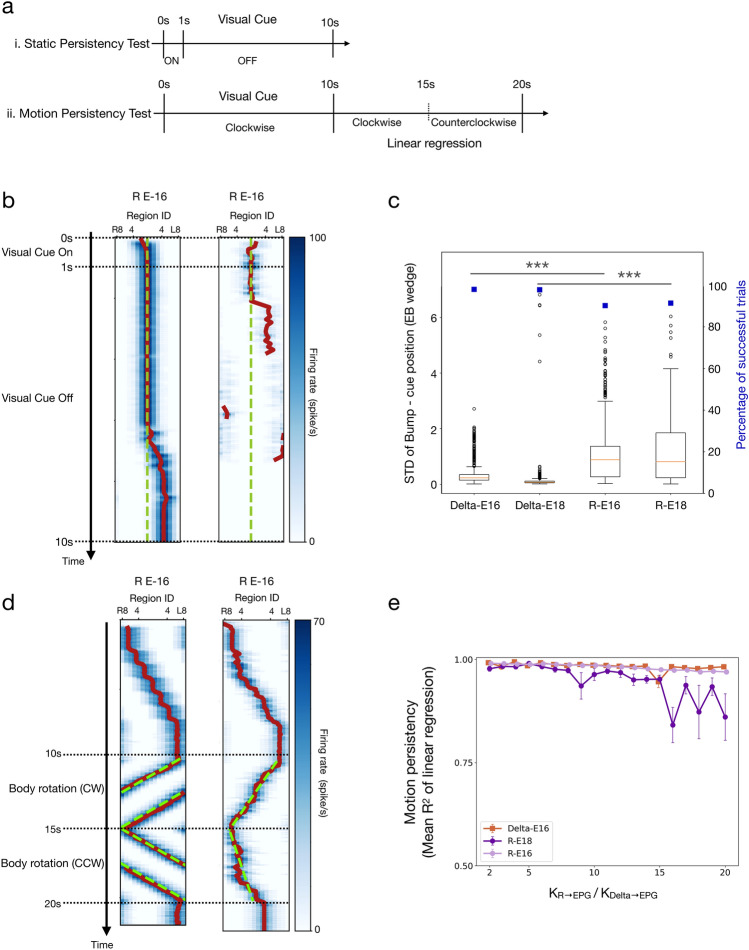
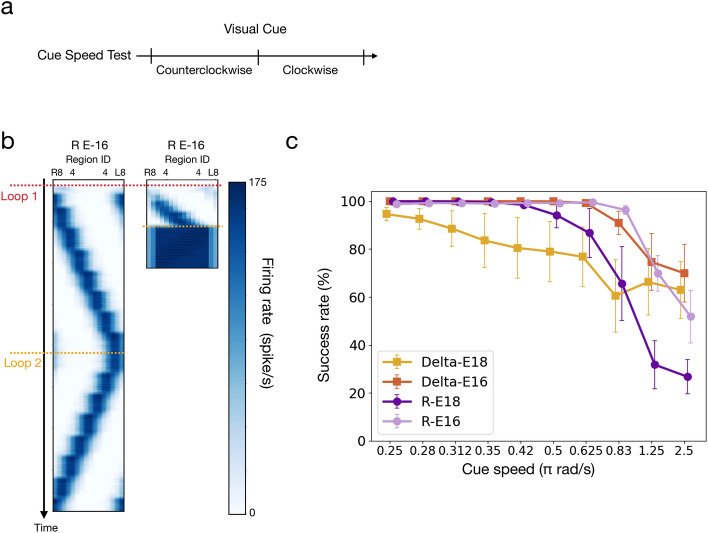
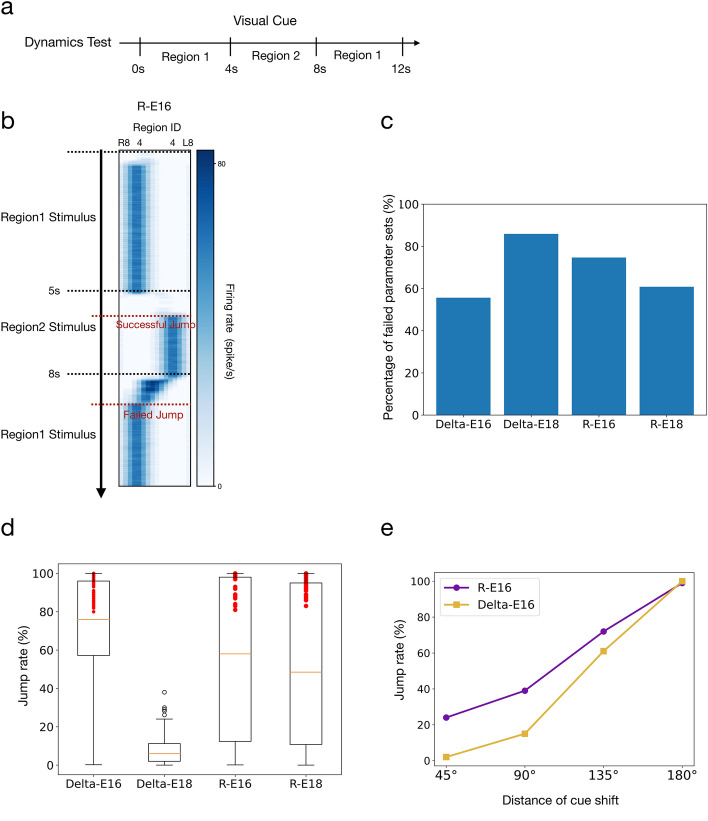
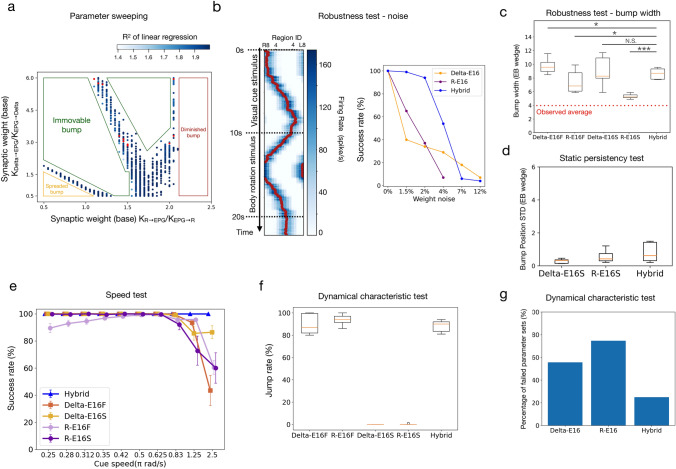
The recent discovery of the head-direction (HD) system in fruit flies has provided unprecedented insights into the neural mechanisms of spatial orientation. Despite the progress, the neural substance of global inhibition, an essential component of the HD circuits, remains controversial. Some studies suggested that the ring neurons provide global inhibition, while others suggested the Δ7 neurons. In the present study, we provide evaluations from the theoretical perspective by performing systematic analyses on the computational models based on the ring-neuron (R models) and Δ7-neurons (Delta models) hypotheses with modifications according to the latest connectomic data. We conducted four tests: robustness, persistency, speed, and dynamical characteristics. We discovered that the two models led to a comparable performance in general, but each excelled in different tests. The R Models were more robust, while the Delta models were better in the persistency test. We also tested a hybrid model that combines both inhibitory mechanisms. While the performances of the R and Delta models in each test are highly parameter-dependent, the Hybrid model performed well in all tests with the same set of parameters. Our results suggest the possibility of combined inhibitory mechanisms in the HD circuits of fruit flies.

Keywords: Attractor dynamics; Central complex; Drosophila; Global inhibition; Head direction.


Conflict of interest statement

The authors declare no conflict of interest.

Figures

Fig. 1
Fig. 1
The circuit models and the test protocols. a Schematics of the classical head-direction (HD) neural circuits. Left: The circuit diagram of the core component of HD circuits, the ring attractor network. The network consists of excitatory neurons (dark blue), which form locally recurrent excitation, and inhibitory neurons (red), which provide global feedback inhibition. Right: The HD circuits consist of two layers. The top layer is a ring-attractor network that encodes the head direction. The bottom layer receives input from the top layer and feeds back to the neighboring neurons in the top layer, forming shifter circuits. b The R class models. The ring (R) neurons provide global inhibition to the attractor network. Left: the attractor circuits of the models. Right: the innervation sites of each neuron type. EB: ellipsoid body. PB: protocerebral bridge. c Same as in B but for the Delta class models, in which the Δ7 neurons provide global inhibition. In both classes of the models, EPG neurons form local excitation, and PEN neurons constitute shifter circuits. d Four example Δ7 neurons showing the innervation pattern of the inhibitory neurons in the Delta version. Each Δ7 neuron only innervates a subset of glomeruli in PB. However, all eight Δ7 neurons collectively provide global inhibition that covers the entire PB. e We also investigate another two variants of the model: The E16 (left) and E18 (right), containing 16 and 18 EPG neurons, respectively. The two extra EPG neurons in the E18 version are indicated in light blue. f The four variants of the HD circuits investigated in the present study and their naming. g The protocols for testing (from top to bottom) robustness, persistency (static and motion), speed, and dynamical characteristics
Fig. 2
Fig. 2
Robustness of the models. a The protocol for the robustness test (also shown in Fig. 1g). b Examples of one successful trial (left, R-E16) and three failed trials (right three, front left to right: R-E16, R-E16, Delta-E18). The successful trial produced a stable activity bump that tracked visual cue movement and body rotation, while the failed trials did not. c We swept through four-dimensional parameter space and marked the parameter sets that led to successful trials (orange and purple dots). The panel shows, for each model, a three-dimensional slice in the four-dimensional sweeping: (top left) R-E16, KR→EPG = 14, (top right) R-E18, KR→EPG = 14, (bottom left) Delta-E16, KDetla→EPG = 14, and (bottom right) Delta-E18, KDetla→EPG = 14. K is the weight base, which needs to be multiplied by the factor shown in supplemental Fig. 2 to become the synaptic weight. d Robustness (defined by the number of usable parameter sets) as a function of the Δ7/R → EPG synaptic strength for all models. The R models were more robust than the Delta models e The widths (FWHM) of the bumps in all four models. The red dashed line shows the experimental bump width data from (Kim et al. 2017). Due to the innervation patterns of the Δ7 neurons (Fig. 1d), the mean bump widths of the Delta models were significantly larger than the R models (t-test, *** = p < 0.001). An EB wedge is 22.5° (or 0.125π) wide. f Example trials of the R-E16 and Delta-E16 models with heterogeneity in the synaptic weights of the EPG → R/Delta and Delta/R → EPG connections
Fig. 3
Fig. 3
Persistency of the models. a The protocols for the static and motion persistency tests (also shown in Fig. 1g). b Example trials in the static persistency test. The green dashed lines indicate the visual cue positions, while the red curves represent the peak positions of the bumps. Left: a trail considered successful but with a gradually drifting bump in the last 3 s of the trial. Right: a failed trial with a diminished bump. c Percentage of successful trials (blue squares) and bump drift (box plots), as measured by the standard deviation (STD) between the bump and cue positions. The mean STDs of the Delta models were significantly smaller than the R models (Wilcoxon rank sum test, *** = p < 0.001). d Example trials for R-E16 models in the motion persistency test with the linear regression (green dashed lines) of the bump position (red curves). Left: a trial in which the bump shifted smoothly during body rotation, and the trajectory of the bump position could be well fit by a line. Right: a trial in which the bump did not shift smoothly during body rotation, and the linear regression led to a poor fit. e Motion persistency, defined as the mean R2 of the linear regression of the bump trace (see Materials and Methods), as a function of the Δ7/R → EPG synaptic weight for the three models. Delta-E18 was excluded because it could not form a moving bump in the test condition
Fig. 4
Fig. 4
The speed test, which was carried out by examining whether the bump can track a fast-moving visual cue. a The protocol for the speed test (also shown in Fig. 1g). b Examples of successful and failed trials of the R-E16 model under different speeds of body rotation (left: 0.25π rad/s, right: 2.5π rad/s) as simulated by shifting the visual cue. c The performance of the speed test (measured by the percentage of successful trials) as a function of the movement speed of the cue. The R-E16 and Delta-E16 models had comparable performance and were better than the other two models
Fig. 5
Fig. 5
Dynamics characteristics as measured by the probability of bump jumping in response to a sudden shift of the visual cue position. a The protocol for the dynamical characteristics test (also shown in Fig. 1g). b An example trial showing a successful jump (t = 5 s) and a failed jump (t = 8 s) when the visual cue shifted between two EB regions separated by 180°. c The percentage of failed parameter sets out of 750 randomly selected parameter sets for each model. A parameter set was considered failed if it did not produce any bump jumping in 100 trials using the protocol as shown in b. The majority of the parameter sets failed in all models. The rest successful parameter sets were selected for further analysis. d The jump rates of the successful parameter sets for the four models. The jump rate was defined as the percentage of trials that produced bump jumping. The numbers of parameter sets (red dots) that produce a jump rate higher than 80% are 63, 48, and 33 for Delta-E16, R-E16, and R-E18, respectively. e The jump rate as a function of the shift distance of the visual cue for the representative parameter sets from R-E16 and Delta-E16. One hundred trials were performed for each parameter set. The R-E16 performed better than Delta-E16 in this test
Fig. 6
Fig. 6
The performance of the Hybrid model, which includes both ring neurons and Δ7 neurons as the inhibitory mechanisms. a Usable parameter sets (dots) for the Hybrid model. The saturation of the color indicates the r2 score in the motion persistency test. The red dots are the 11 sets of parameters with > 80% of success rate in all tests (speed, persistency, and dynamical characteristic) and are selected for comparison with other models in panels c-f. b (L) An example activity of the Hybrid model with a noise of 4% of the weights added to all EPG↔R and EPG↔Delta connections. (Right) The success rate of the Robustness test against the noise of different levels. The Hybrid model tolerates more noise than the R-E16 and Delta-E16 models. In all following panels, the Hybrid model is compared with the stable and flexible versions of the R-E16 and Delta-E16 models. A letter (S for stable; F for flexible) is added to the tail of each model name to indicate the version. c Bump width. The Hybrid model is not significantly different from the Delta-E16S model (Wilcoxon rank sum test. p-values, Delta-E16F: 0.011, R-E16F: 0.045, Delta-E16S: 0.767, R-E16S: < 0.001) d The static persistency test. The Hybrid model is comparable to the stable version of the R and Delta models. The flexible versions of the two models were not shown here because they failed in all trials. e The speed test. The Hybrid model outperforms all models at the high cue speed range. f The jump rate in the dynamical characteristic test. The Hybrid model performs as good as the Detla-E16F and R-E16F models. The stable versions of the R and Delta models cannot produce any jump. g The failure rate in the dynamical characteristic test. The data for delta-E16 and R-E16 models are identical to those shown in Fig. 5c

References

    1. Chang P-Y, Su T-S, Shih C-T, Lo C-C. The topographical mapping in Drosophila central complex network and its signal routing. Front Neuroinformatics. 2017;11:26. doi: 10.3389/fninf.2017.00026. - DOI - PMC - PubMed
    1. Chen T-W, Wardill TJ, Sun Y, et al. Ultrasensitive fluorescent proteins for imaging neuronal activity. Nature. 2013;499:295–300. doi: 10.1038/nature12354. - DOI - PMC - PubMed
    1. Clandinin TR, Giocomo LM. Internal compass puts flies in their place. Nature. 2015;521:165–166. doi: 10.1038/521165a. - DOI - PubMed
    1. Cope AJ, Sabo C, Vasilaki E, et al. A computational model of the integration of landmarks and motion in the insect central complex. PLoS ONE. 2017;12:e0172325. doi: 10.1371/journal.pone.0172325. - DOI - PMC - PubMed
    1. Fisher YE, Lu J, D’Alessandro I, Wilson RI. Sensorimotor experience remaps visual input to a heading-direction network. Nature. 2019;576:121–125. doi: 10.1038/s41586-019-1772-4. - DOI - PMC - PubMed

Publication types

LinkOut - more resources