. 2023 Jun;45(3):1869-1888.
doi: 10.1007/s11357-023-00734-4. Epub 2023 Feb 13.

Sex-specific relationships between obesity, physical activity, and gray and white matter volume in cognitively unimpaired older adults

Collaborators, Affiliations

Sex-specific relationships between obesity, physical activity, and gray and white matter volume in cognitively unimpaired older adults

Brittany Intzandt et al. Geroscience. 2023 Jun.

Abstract

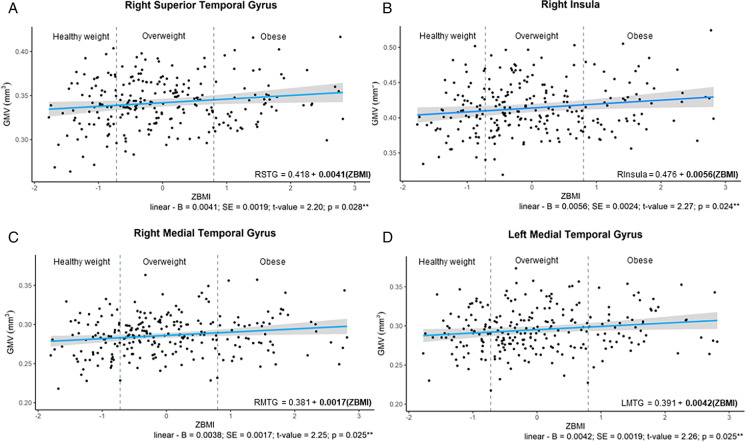
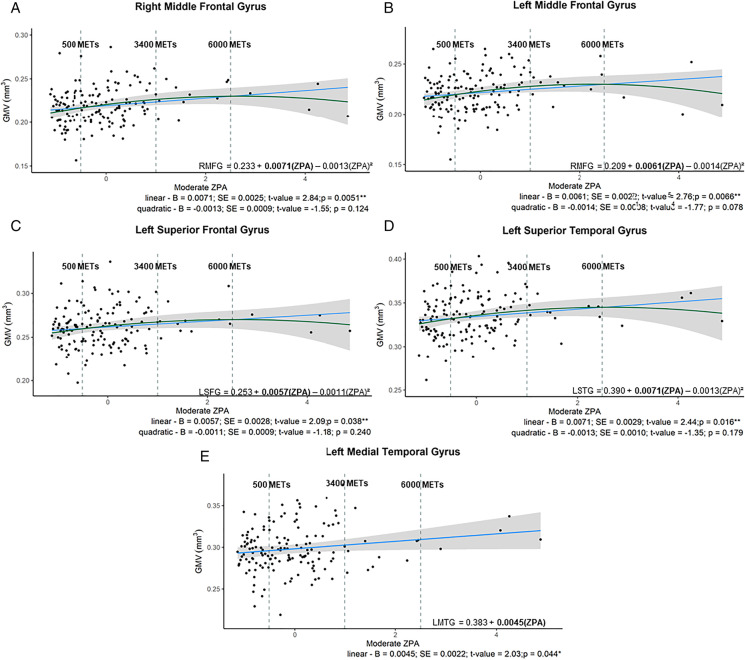
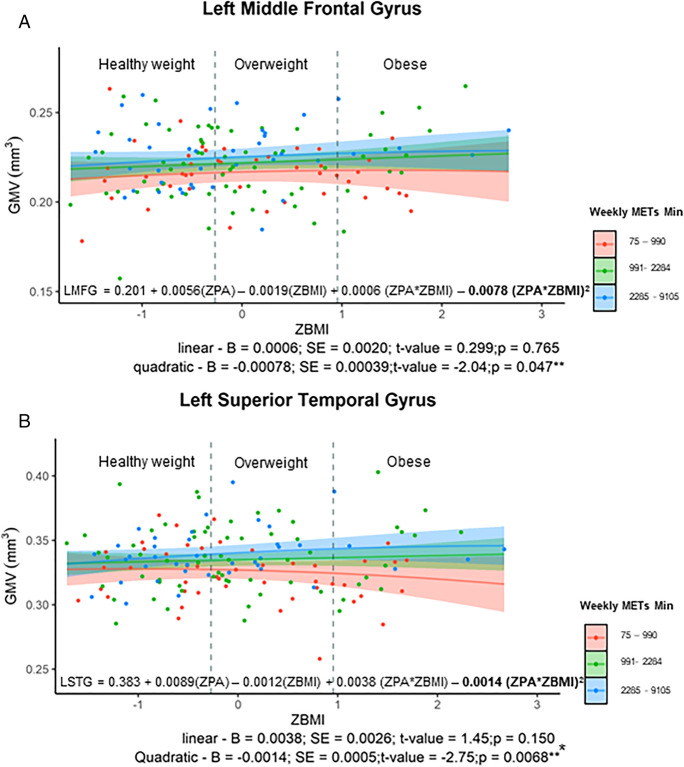
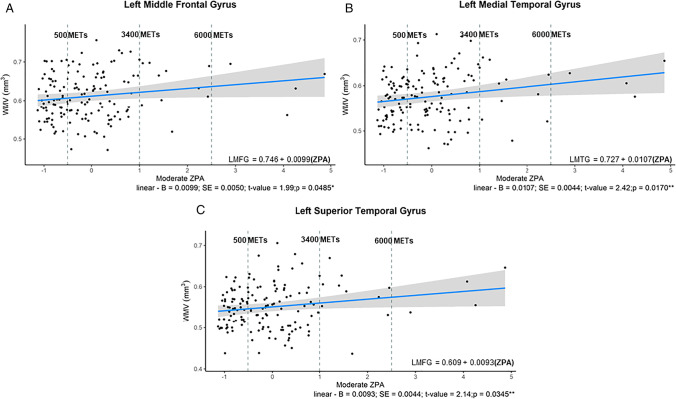
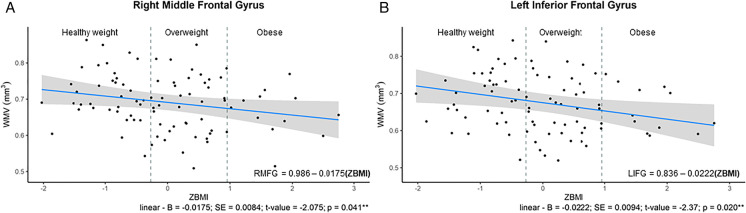
Independently, obesity and physical activity (PA) influence cerebral structure in aging, yet their interaction has not been investigated. We examined sex differences in the relationships among PA, obesity, and cerebral structure in aging with 340 participants who completed magnetic resonance imaging (MRI) acquisition to quantify grey matter volume (GMV) and white matter volume (WMV). Height and weight were measured to calculate body mass index (BMI). A PA questionnaire was used to estimate weekly Metabolic Equivalents. The relationships between BMI, PA, and their interaction on GMV Regions of Interest (ROIs) and WMV ROIs were examined. Increased BMI was associated with higher GMV in females, an inverse U relationship was found between PA and GMV in females, and the interaction indicated that regardless of BMI greater PA was associated with enhanced GMV. Males demonstrated an inverse U shape between BMI and GMV, and in males with high PA and had normal weight demonstrated greater GMV than normal weight low PA revealed by the interaction. WMV ROIs had a linear relationship with moderate PA in females, whereas in males, increased BMI was associated with lower WMV as well as a positive relationship with moderate PA and WMV. Males and females have unique relationships among GMV, PA and BMI, suggesting sex-aggregated analyses may lead to biased or non-significant results. These results suggest higher BMI, and PA are associated with increased GMV in females, uniquely different from males, highlighting the importance of sex-disaggregated models. Future work should include other imaging parameters, such as perfusion, to identify if these differences co-occur in the same regions as GMV.

Keywords: Gray matter volume; Obesity; Physical activity; Sexual dimorphisms.


Conflict of interest statement

The authors declare no competing interests.

Figures

Fig. 1
Fig. 1
Relationships Between ZBMI in Females and GMV ROIs; A—relationship in right superior temporal gyrus; B – in the right insular gyrus; C – right medial temporal gyrus; D – left medial temporal gyrus. From the y axis to the first dashed vertical grey line are individuals considered healthy weight (BMI = 18.6–24.99 kg/m2; those data points between the two dashed vertical gray line are those considered to be overweight (BMI = 25.0–29.99 kg/m2); individuals to the right of the second vertical dashed line were those with obesity (BMI = 30.0–39.99 kg/m.2). The regression equation present on the graph has bolded the significant component of the polynomial equations. **denotes p-value < 0.05
Fig. 2
Fig. 2
A–E Significant relationships between GMV ROIs and Moderate physical activity (ZPA) in females. A: Quadratic relationship between moderate ZPA and the right middle frontal gyrus; B: quadratic relationship between moderate ZPA and the left middle frontal gyrus; C: quadratic relationship between moderate ZPA and the left superior frontal gyrus; D: quadratic relationship between moderate ZPA and the let superior temporal gyrus; E: linear relationship between moderate ZPA and the left medial temporal gyrus. From the y axis to the first dashed vertical grey line are individuals considered under the recommended PA guidelines (METs minutes per week < 500); those data points between the two dashed vertical grey line are those completing 501 to 3400 METs minutes per week; and individuals to the right of the second vertical dashed line were those completing excess of 6000 METs minutes per week. The regression equation present on the graph has bolded the significant component of the polynomial equations. ** denotes p-value < 0.05
Fig. 3
Fig. 3
(top figure) significant interaction with ZBMI and moderate ZPA in the left middle frontal gyrus. Bottom figure demonstrates the significant interaction of ZBMI with moderate ZPA in the left medial temporal gyrus. For both figures the red line indicates those with the least amount of reported moderate PA; the green were those females reporting the median amount, and finally the blue line indicates those with higher levels of PA. The number of weekly METs minutes are also indicated to provide the actual METs ranges completed for each line. Moreover, the two vertical grey dotted lines provide the healthy weight range (BMI: 18.6–24.99 kg/m2), the overweight range is in between the two vertical lines (BMI: 25–29.99 kg/m2) and those who were considered to be obese to the right of the second vertical line (BMI: 30–39.99 kg/m.2). The regression equation present on the graph has bolded the significant component of the polynomial equations.** denotes significant p-value < 0.05
Fig. 4
Fig. 4
A–D: Relationships Between ZBMI in Males and GMV ROIs; A – inverse quadratic relationship in right superior frontal gyrus; B – inverse quadratic relationship in the left superior frontal gyrus; C – inverse quadratic relationship in the left superior frontal gyrus; C – inverse quadratic relationship in the left superior parietal gyrus; D – inverse quadratic relationship left superior temporal gyrus. From the y axis to the first dashed vertical grey line are individuals considered healthy weight (BMI = 18.6–24.99 kg/m2; those data points between the two dashed vertical grey line are those considered to be overweight (BMI = 25.0–29.99 kg/m2); individuals to the right of the second vertical dashed line were those with obesity (BMI = 30.0–39.99 kg/m.2). The regression equation present on the graph has bolded the significant component of the polynomial equations.** denotes significant p-value < 0.05
Fig. 5
Fig. 5
Significant interaction with ZBMI and total ZPA in the left hippocampus. The red line indicates those with the least amount of reported total PA; the green were those males reporting the median amount, and finally the blue line indicates those with higher levels of PA. The number of weekly METs minutes are also indicated to provide the actual METs ranges completed for each line. Moreover, the two vertical grey dotted lines provide the healthy weight range (BMI: 18.6–24.99 kg/m2), the overweight range is in between the two vertical lines (BMI: 25–29.99 kg/m2) and those who were considered to be obese to the right of the second vertical line (BMI: 30–39.99 kg/m.2). The regression equation present on the graph has bolded the significant component of the polynomial equations. ** denotes significant p-value < 0.05
Fig. 6
Fig. 6
A–C Significant relationships between WMV ROIs and Moderate ZPA in females. A: linear relationship between moderate ZPA and the left middle frontal gyrus; B: linear relationship between moderate ZPA and the left medial temporal gyrus; C: linear relationship between moderate ZPA and the left superior frontal gyrus. From the y axis to the first dashed vertical gray line are individuals considered under the recommended PA guidelines (METs minutes per week < 500); those data points between the two dashed vertical grey line are those completing 501 to 3400 METs minutes per week; and individuals to the right of the second vertical dashed line were those completing excess of 6000 METs minutes per week. The regression equation present on the graph has bolded the significant component of the polynomial equations. ** denotes p-value < 0.05
Fig. 7
Fig. 7
A–B Relationships Between ZBMI in Males and WMV ROIs; A – inverse linear relationship in right middle frontal gyrus; B – inverse linear relationship in the left inferior frontal gyrus. From the y axis to the first dashed vertical grey line are individuals considered healthy weight (BMI = 18.6–24.99 kg/m2; those dots between the two dashed vertical gray line are those considered to be overweight (BMI = 25.0–29.99 kg/m2); individuals to the right of the second vertical dashed line were those with obesity (BMI = 30.0–39.99 kg/m.2). The regression equation present on the graph has bolded the significant component of the polynomial equations. ** denotes significant p-value < 0.05
Fig. 8
Fig. 8
Significant relationships between WMV ROIs and moderate ZPA in males the right hippocampus. From the y axis to the first dashed vertical gray line are individuals considered under the recommended PA guidelines (METs minutes per week < 500); those data points between the two dashed vertical grey line are those completing 501 to 1700 METs minutes per week; and individuals to the right of the second vertical dashed line were those completing excess of 3000 METs minutes per week. The regression equation present on the graph has bolded the significant component of the polynomial equations. *denotes significant p-value < 0.05

References

    1. S. C. Government of Canada. Overweight and obese adults, 2018, Jun. 25, 2019. Table 13-10-0096-01 Health characteristics, annual estimates. https://www150.statcan.gc.ca/n1/pub/82-625-x/2019001/article/00005-eng.htm. Accessed 8 Apr 2022. 10.25318/1310009601-eng.
    1. Hruby A, Hu FB. The Epidemiology of Obesity: A Big Picture. Pharmacoeconomics. 2015;33(7):673–689. doi: 10.1007/s40273-014-0243-x. - DOI - PMC - PubMed
    1. Livingston G, et al. Dementia prevention, intervention, and care: 2020 report of the Lancet Commission. The Lancet. 2020;396(10248):413–446. doi: 10.1016/S0140-6736(20)30367-6. - DOI - PMC - PubMed
    1. Pedditizi E, Peters R, Beckett N. The risk of overweight/obesity in mid-life and late life for the development of dementia: a systematic review and meta-analysis of longitudinal studies. Age Ageing. 2016;45(1):14–21. doi: 10.1093/ageing/afv151. - DOI - PubMed
    1. Albanese E, et al. Overweight and Obesity in Midlife and Brain Structure and Dementia 26 Years Later. Am J Epidemiol. 2015;181(9):672–679. doi: 10.1093/aje/kwu331. - DOI - PMC - PubMed

Publication types

Grants and funding

LinkOut - more resources