

A predictive model of response to metoprolol in children and adolescents with postural tachycardia syndrome
- PMID: 36781629
- PMCID: PMC10060270
- DOI: 10.1007/s12519-022-00677-4
A predictive model of response to metoprolol in children and adolescents with postural tachycardia syndrome
Abstract
Background: The present work was designed to explore whether electrocardiogram (ECG) index-based models could predict the effectiveness of metoprolol therapy in pediatric patients with postural tachycardia syndrome (POTS).
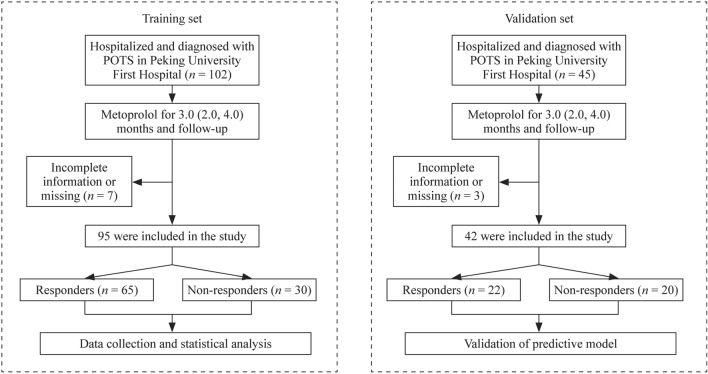
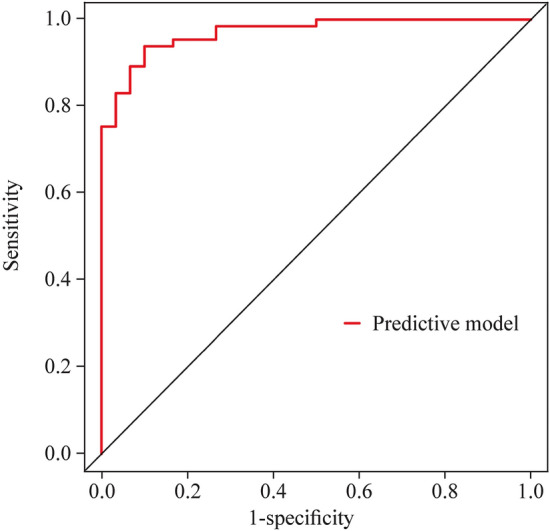
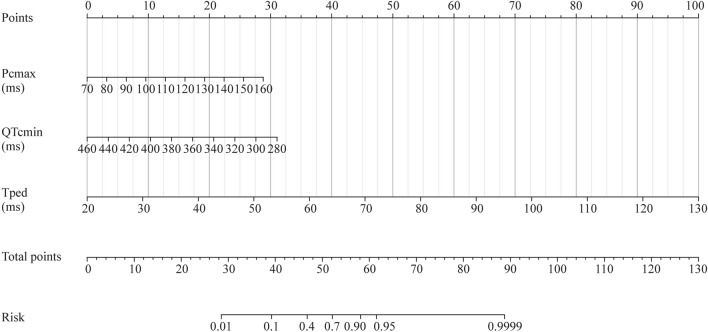
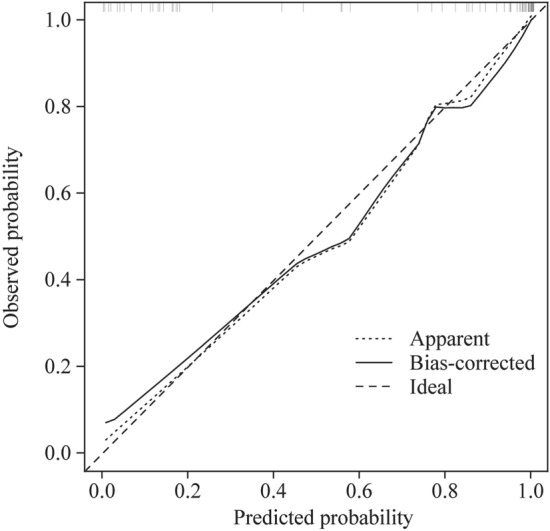
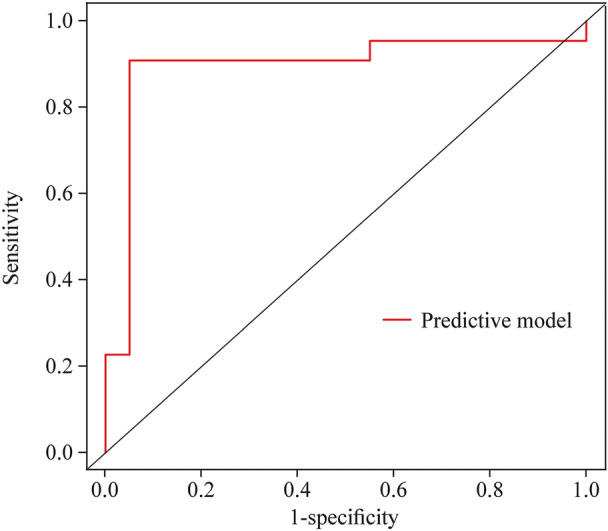
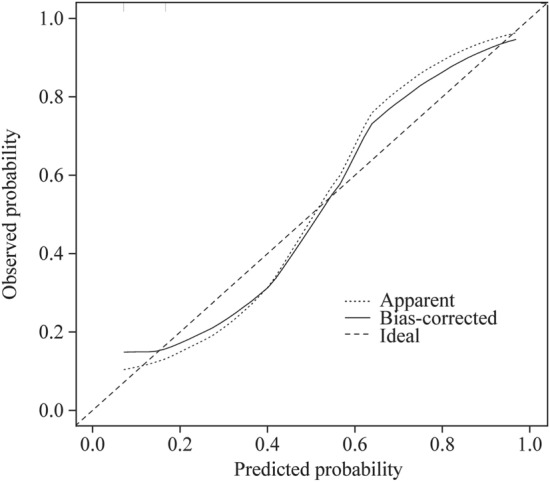
Methods: This study consisted of a training set and an external validation set. Children and adolescents with POTS who were given metoprolol treatment were enrolled, and after follow-up, they were grouped into non-responders and responders depending on the efficacy of metoprolol. The difference in pre-treatment baseline ECG indicators was analyzed between the two groups in the training set. Binary logistic regression analysis was further conducted on the association between significantly different baseline variables and therapeutic efficacy. Nomogram models were established to predict therapeutic response to metoprolol. The receiver-operating characteristic curve (ROC), calibration, and internal validation were used to evaluate the prediction model. The predictive ability of the model was validated in the external validation set.
Results: Of the 95 enrolled patients, 65 responded to metoprolol treatment, and 30 failed to respond. In the responders, the maximum value of the P wave after correction (Pcmax), P wave dispersion (Pd), Pd after correction (Pcd), QT interval dispersion (QTd), QTd after correction (QTcd), maximum T-peak-to-T-end interval (Tpemax), and T-peak-to-T-end interval dispersion (Tped) were prolonged (all P < 0.01), and the P wave amplitude was increased (P < 0.05) compared with those of the non-responders. In contrast, the minimum value of the P wave duration after correction (Pcmin), the minimum value of the QT interval after correction (QTcmin), and the minimum T-peak-to-T-end interval (Tpemin) in the responders were shorter (P < 0.01, < 0.01 and < 0.01, respectively) than those in the non-responders. The above indicators were screened based on the clinical significance and multicollinearity analysis to construct a binary logistic regression. As a result, pre-treatment Pcmax, QTcmin, and Tped were identified as significantly associated factors that could be combined to provide an accurate prediction of the therapeutic response to metoprolol among the study subjects, yielding good discrimination [area under curve (AUC) = 0.970, 95% confidence interval (CI) 0.942-0.998] with a predictive sensitivity of 93.8%, specificity of 90.0%, good calibration, and corrected C-index of 0.961. In addition, the calibration curve and standard curve had a good fit. The accuracy of internal validation with bootstrap repeated sampling was 0.902. In contrast, the kappa value was 0.769, indicating satisfactory agreement between the predictive model and the results from the actual observations. In the external validation set, the AUC for the prediction model was 0.895, and the sensitivity and specificity were 90.9% and 95.0%, respectively.
Conclusions: A high-precision predictive model was successfully developed and externally validated. It had an excellent predictive value of the therapeutic effect of metoprolol on POTS among children and adolescents.
Keywords: Children; Electrocardiography; Metoprolol; Nomogram; Postural tachycardia syndrome; Predictor.
© 2023. The Author(s).
Conflict of interest statement
DJB is the deputy chief editor for
Figures
Similar articles
-
Acceleration index predicts efficacy of orthostatic training on postural orthostatic tachycardia syndrome in children.Eur J Pediatr. 2024 Sep;183(9):4029-4039. doi: 10.1007/s00431-024-05664-7. Epub 2024 Jul 2. Eur J Pediatr. 2024. PMID: 38955847
-
Baseline Corrected QT Interval Dispersion Is Useful to Predict Effectiveness of Metoprolol on Pediatric Postural Tachycardia Syndrome.Front Cardiovasc Med. 2022 Jan 20;8:808512. doi: 10.3389/fcvm.2021.808512. eCollection 2021. Front Cardiovasc Med. 2022. PMID: 35127870 Free PMC article.
-
Differential diagnostic value of P wave dispersion and QT interval dispersion between psychogenic pseudosyncope and vasovagal syncope in children and adolescents.Ital J Pediatr. 2025 Jan 23;51(1):14. doi: 10.1186/s13052-025-01864-5. Ital J Pediatr. 2025. PMID: 39849646 Free PMC article.
-
Establishment and validation of a multivariate predictive model for the efficacy of oral rehydration salts in children with postural tachycardia syndrome.EBioMedicine. 2024 Feb;100:104951. doi: 10.1016/j.ebiom.2023.104951. Epub 2024 Jan 4. EBioMedicine. 2024. PMID: 38171114 Free PMC article.
-
Electrocardiography-Derived Predictors for Therapeutic Response to Treatment in Children with Postural Tachycardia Syndrome.J Pediatr. 2016 Sep;176:128-33. doi: 10.1016/j.jpeds.2016.05.030. Epub 2016 Jun 16. J Pediatr. 2016. PMID: 27318378
Cited by
-
Acceleration index predicts efficacy of orthostatic training on postural orthostatic tachycardia syndrome in children.Eur J Pediatr. 2024 Sep;183(9):4029-4039. doi: 10.1007/s00431-024-05664-7. Epub 2024 Jul 2. Eur J Pediatr. 2024. PMID: 38955847
-
Management of Postural Orthostatic Tachycardia Syndrome in Pediatric Patients: A Clinical Review.J Pediatr Pharmacol Ther. 2024 Oct;29(5):456-467. doi: 10.5863/1551-6776-29.5.456. Epub 2024 Oct 14. J Pediatr Pharmacol Ther. 2024. PMID: 39411411 Free PMC article.
-
Pediatric postural orthostatic tachycardia syndrome: From mechanisms to individualized management.Pediatr Discov. 2024 Nov 24;2(4):e2509. doi: 10.1002/pdi3.2509. eCollection 2024 Dec. Pediatr Discov. 2024. PMID: 40626134 Free PMC article. Review.
-
A higher peak heart rate during head-up tilt test predicts the therapeutic efficacy of metoprolol in vasovagal syncope.BMC Cardiovasc Disord. 2024 Oct 18;24(1):576. doi: 10.1186/s12872-024-04249-4. BMC Cardiovasc Disord. 2024. PMID: 39425043 Free PMC article.
-
Nomogram and scoring models based on BMI z-score, serum chlorine and urine specific gravity levels for predicting oral rehydration solution efficacy in pediatric postural orthostatic tachycardia syndrome.World J Pediatr. 2025 Apr;21(4):406-418. doi: 10.1007/s12519-025-00898-3. Epub 2025 Apr 24. World J Pediatr. 2025. PMID: 40272775
References
-
- Vernino S, Bourne KM, Stiles LE, Grubb BP, Fedorowski A, Stewart JM, et al. Postural orthostatic tachycardia syndrome (POTS): state of the science and clinical care from a 2019 National Institutes of Health Expert Consensus Meeting—part 1. Auton Neurosci. 2021;235:102828. doi: 10.1016/j.autneu.2021.102828. - DOI - PMC - PubMed
MeSH terms
Substances
Grants and funding
LinkOut - more resources
Full Text Sources
Research Materials
