. 2023 Feb 13;9(1):18.
doi: 10.1038/s41421-023-00523-5.

Structure and dynamics of the EGFR/HER2 heterodimer

Affiliations

Structure and dynamics of the EGFR/HER2 heterodimer

Xue Bai et al. Cell Discov. .

Abstract

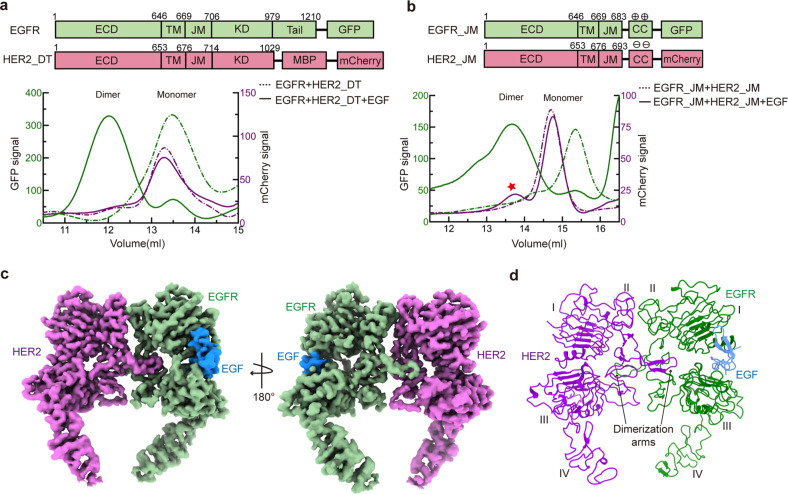
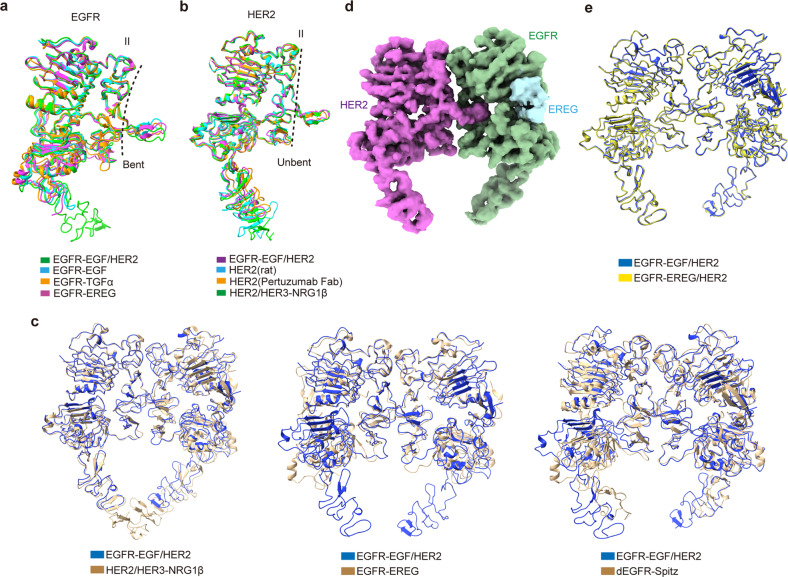
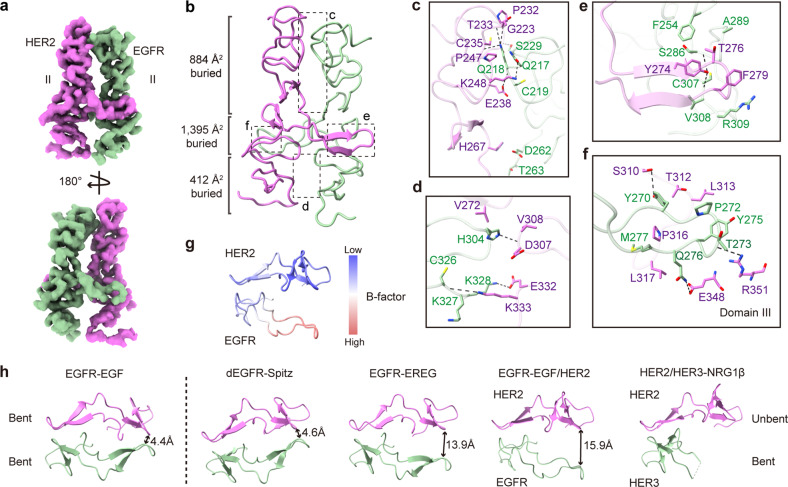
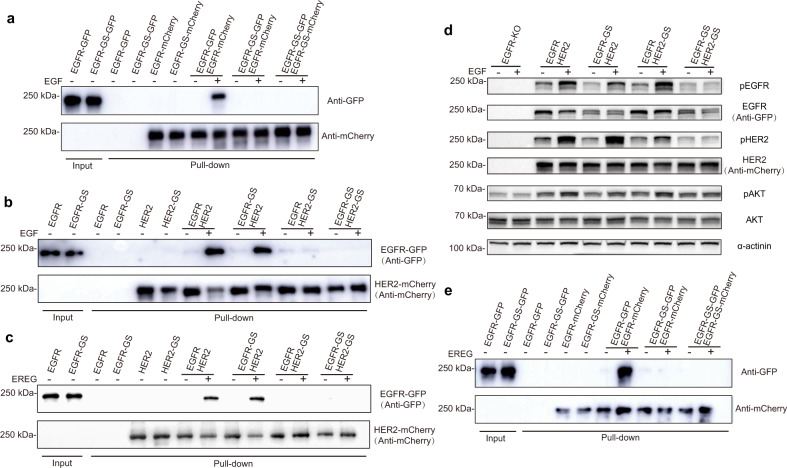
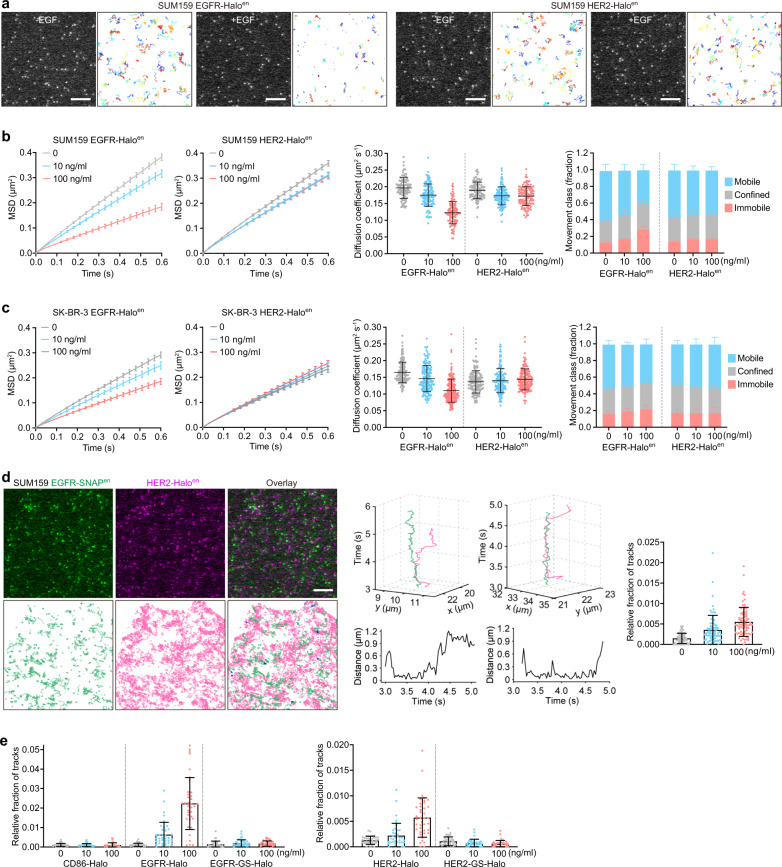
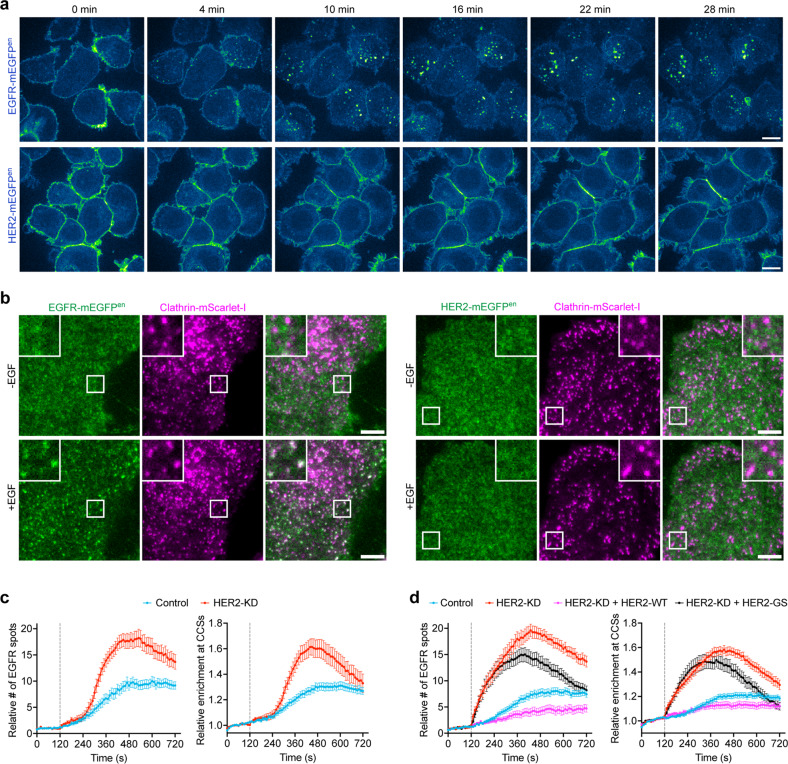
HER2 belongs to the human epidermal growth factor receptor tyrosine kinase family. Its overexpression or hyperactivation is a leading cause for multiple types of cancers. HER2 functions mainly through dimerization with other family members, such as EGFR. However, the molecular details for heterodimer assembly have not been completely understood. Here, we report cryo-EM structures of the EGF- and epiregulin-bound EGFR/HER2 ectodomain complexes at resolutions of 3.3 Å and 4.5 Å, respectively. Together with the functional analyses, we demonstrate that only the dimerization arm of HER2, but not that of EGFR, is essential for their heterodimer formation and signal transduction. Moreover, we analyze the differential membrane dynamics and transient interactions of endogenous EGFR and HER2 molecules in genome-edited cells using single-molecule live-cell imaging. Furthermore, we show that the interaction with HER2 could allow EGFR to resist endocytosis. Together, this work deepens our understanding of the unique structural properties and dynamics of the EGFR/HER2 complex.


Conflict of interest statement

The authors declare no competing interests.

Figures

Fig. 1
Fig. 1. Cryo-EM structure of the EGF-bound EGFR/HER2 ectodomain complex.
a, b Detection of the EGFR/HER2 dimer using FSEC. GFP- and mCherry-tags are attached to the C-termini of EGFR and HER2, respectively. HER2_DT is the tail-deleted form with a substituted MBP-tag. EGFR_JM and HER2_JM constructs only contain the ectodomain, transmembrane domain, part of the juxtamembrane domain, and the coiled-coil (CC) peptide. The basic and acidic CC peptides are attached to EGFR_JM and HER2_JM, respectively. The red pentagram in b indicates the peak position of EGFR_JM/HER2_JM dimer. c Cryo-EM map of the EGF-bound EGFR/HER2 ectodomain complex shown in two views. EGFR, EGF, and HER2 are colored in green, marine, and magenta, respectively. d Overall structure of the EGF-bound EGFR/HER2 heterodimer in ribbon presentation. The color code is the same as that in c. The four domains of EGFR and HER2 ectodomains are indicated with Roman numerals. The DAs of Domain II are also labeled.
Fig. 2
Fig. 2. Structural comparison of different HER family proteins.
a Superposition of the individual EGFR subunit structures in different dimers. EGFR in our EGFR/HER2 dimer (green) is superimposed with the bent EGFR protomer structures in EGF (cyan; PDB code: 1IVO)-, TGFα (orange; PDB code: 1MOX)-, and EREG (magenta; PDB code: 5WB7)-bound EGFR dimers. The RMSDs between our EGFR and the other three structures are 1.82 Å, 2.20 Å, and 1.72 Å, respectively. b Superposition of the individual HER2 subunit structures. HER2 in our EGFR/HER2 dimer (magenta) is overlaid with its monomer structure (rat) (cyan; PDB code: 1N8Y), as well as its structure in complex with Pertuzumab Fab (orange; PDB code: 1S78) or HER3 (green; PDB code: 7MN5). The RMSDs between our HER2 and the other three structures are 1.41 Å, 2.15 Å, and 1.34 Å, respectively. c Superposition of our EGFR/HER2 structure (blue) with the currently reported three asymmetric HER dimers (golden), namely, NRG1β-bound HER2/HER3 (left; PDB code: 7MN5; RMSD 1.95 Å), EREG-bound EGFR (middle; PDB code: 5WB7; RMSD 1.73 Å), and Spitz-bound Drosophila EGFR (dEGFR) (right; PDB code: 3LTG; RMSD 2.68 Å). d Cryo-EM map of the EREG-bound EGFR/HER2 ectodomain complex. EGFR, EREG, and HER2 are colored green, light blue, and magenta, respectively. e Superposition of the EGF (blue)- and EREG (yellow)-bound EGFR/HER2 structures.
Fig. 3
Fig. 3. Interaction details between EGFR and HER2.
a Cryo-EM map of the interface between Domain IIs of EGFR and HER2 shown in two views. b Structure of the EGFR/HER2 interface in ribbon presentation. EGFR is colored in green and HER2 is in magenta. The BSAs of different regions are indicated. cf Interaction details between EGFR and HER2 as indicated in the insets of b. Residues involved in their interaction are shown with side chains. Black dashed lines represent hydrogen bond or salt bridge interactions (< 4.5 Å). g B-factor distribution of the DAs in the EGFR–EGF/HER2 structure. h Comparison of the structures of DAs in different HER dimers. From left to right: EGFR–EGF (PDB code: 1IVO), dEGFR–Spitz (PDB code: 3LTG), EGFR–EREG (PDB code: 5WB7), EGFR–EGF/HER2 (this study), and HER2/HER3–NRG-1β (PDB code: 7MN5). The DAs of the symmetric EGFR dimer exhibit the same conformation. For asymmetric dimers, the DAs of the unbent subunit pack closely with its counterpart, mimicking that of the symmetric EGFR dimer, whereas those of the bent subunit display various structures. The distances between DAs of the bent subunits and their partners are indicated.
Fig. 4
Fig. 4. Functional significance of the DA of EGFR or HER2 for their dimer assembly.
a Pull-down assay to verify the significance of DAs for EGF-induced EGFR dimerization. The mCherry-tagged EGFR was associated with the mCherry-nanobody (Nb) resin, and GFP-tagged EGFR was used as input for this assay. b, c Pull-down assay to verify the significance of DAs for EGF- (b) or EREG-induced (c) EGFR/HER2 interaction. The mCherry-tagged HER2 was associated with the mCherry-Nb resin, and GFP-tagged EGFR was used as input for this assay. d Detection of the phosphorylation levels of EGFR, HER2, and AKT upon EGF stimulation. Different EGFR and HER2 variants were transfected to the EGFR-knockout SUM159 cells. e Pull-down assay to verify the significance of DAs for EREG-induced EGFR dimerization.
Fig. 5
Fig. 5. Single-molecule analyses of the diffusion dynamics and interactions of endogenous EGFR and HER2 in cancer cells.
a Live-cell single-molecule imaging and tracking of endogenous (en) EGFR-Halo and HER2-Halo molecules at the plasma membrane of SUM159 cells genome-edited for EGFR-Halo/HER2-mEGFP or HER2-Halo/EGFR-mEGFP (labeled by JFX650-HaloTag ligand). Shown are representative single frames and tracking traces of time-lapse series acquired in the cells treated without or with EGF (100 ng/mL) by TIRF microscopy. b MSD-Δt plots (left two panels) and diffusion coefficients (middle panel) of EGFR-Halo tracks (n = 115, 109, and 110 cells from 4 independent experiments) and HER2-Halo tracks (n = 117, 119, 120 cells from four independent experiments) from genome-edited SUM159 cells treated with 0, 10, or 100 ng/mL EGF and imaged by TIRF microscopy. The right panel shows fractions of tracks classified as mobile, confined, or immobile (n = 4 independent experiments). c SK-BR-3 cells genome-edited for EGFR-Halo or HER-Halo were labeled by JFX650-HaloTag ligand, treated with 0, 10, or 100 ng/mL EGF, and imaged by TIRF microscopy. MSD-Δt plots (left two panels) and diffusion coefficients (middle panel) of EGFR-Halo tracks (n = 150, 156, and 158 cells from 4 independent experiments) or HER-Halo tracks (n = 152, 149, 153 cells from 4 independent experiments), and fractions of tracks classified as mobile, confined, or immobile (right panel, n = 4 independent experiments) are shown. d SUM159 cells genome-edited for both EGFR-SNAP and HER2-Halo were labeled by JFX650-SNAP-tag ligand and JFX549-HaloTag ligand, treated without or with EGF, and then imaged by TIRF microscopy. The representative single frame and tracking traces (co-localized trajectories are highlighted in blue) of the time-lapse series of a cell treated with 100 ng/mL EGF were shown on the left. Individual 3D trajectories (top) and distances (bottom) between EGFR-SNAP and HER2-Halo as a function of time are shown in the middle panels. The relative fractions of HER2 tracks that interact with EGFR in cells treated with 0, 10, or 100 ng/mL EGF are shown on the right (n = 73, 77, and 77 cells from 2 independent experiments). e SUM159 cells genome-edited for EGFR-SNAP were transiently expressed with HaloTag-tagged CD86, HER2, HER2-GS, EGFR, and EGFR-GS, labeled by JFX650-SNAP-tag ligand and JFX549-HaloTag ligand, and then imaged by TIRF microscopy. Shown are the relative fractions of tracks in Halo channels that interact with the SNAP-tagged endogenous EGFR (n = 36–40 cells from 2 independent experiments). Scale bars, 5 μm. Error bars show means ± SD except for the MSD-Δt plots (means ± 95% confidence interval).
Fig. 6
Fig. 6. Interaction of HER2 and EGFR inhibited EGFR endocytosis.
a SK-BR-3 cells genome-edited for EGFR-mEGFP or HER2-mEGFP were imaged by spinning-disk confocal microscopy. Shown are images of the cells in the middle planes at indicated times after EGF (100 ng/mL) treatment. Scale bars, 10 μm. b SK-BR-3 cells genome-edited for EGFR-mEGFP or HER2-mEGFP stably expressing clathrin-mScarlet-I were imaged at the bottom surfaces by TIRF microscopy. Shown are the single frames before and 3 min after EGF treatment during the continuous time-lapse imaging. Boxed regions are enlarged and shown. Scale bars, 5 μm. c SK-BR-3 cells genome-edited for EGFR-mEGFP and stably expressing clathrin-mScarlet-I were treated with control siRNA or siRNA targeting HER2 (HER2-KD), and then imaged at the bottom surfaces by TIRF microscopy. EGF was added at 120 s of the time-lapse imaging. The relative numbers of fluorescence spots of EGFR-mEGFP that appeared at the plasma membrane (left panel) and the relative enrichment of EGFR-mEGFP fluorescence in clathrin-coated structures (CCSs, right panel) during EGF stimulation are shown (n = 23 and 19 cells). d SK-BR-3 cells genome-edited for EGFR-mEGFP and stably expressing clathrin-mScarlet-I were treated with control siRNA or siRNA targeting HER2 (HER2-KD). The cells treated with siRNA targeting HER2 were transiently transfected with the siRNA-resistant wild-type HER2 or the HER2-GS mutant and then imaged at the bottom surfaces by TIRF microscopy. EGF was added at 120 s of the time-lapse imaging. The relative numbers of fluorescence spots of EGFR-mEGFP that appeared at the plasma membrane (left panel, n = 49, 50, 29, and 30 cells) and the relative enrichment of EGFR-mEGFP fluorescence in CCSs (right panel, n = 43, 49, 28, and 30 cells) during EGF stimulation are shown. Error bars show means ± SEM.

References

    1. Yarden Y, Sliwkowski MX. Untangling the ErbB signalling network. Nat. Rev. Mol. Cell Biol. 2001;2:127–137. doi: 10.1038/35052073. - DOI - PubMed
    1. Oh DY, Bang YJ. HER2-targeted therapies - a role beyond breast cancer. Nat. Rev. Clin. Oncol. 2020;17:33–48. doi: 10.1038/s41571-019-0268-3. - DOI - PubMed
    1. Yarden Y, Pines G. The ERBB network: at last, cancer therapy meets systems biology. Nat. Rev. Cancer. 2012;12:553–563. doi: 10.1038/nrc3309. - DOI - PubMed
    1. Hudziak RM, Schlessinger J, Ullrich A. Increased expression of the putative growth factor receptor p185HER2 causes transformation and tumorigenesis of NIH 3T3 cells. Proc. Natl. Acad. Sci. USA. 1987;84:7159–7163. doi: 10.1073/pnas.84.20.7159. - DOI - PMC - PubMed
    1. Lemmon MA, Schlessinger J, Ferguson KM. The EGFR family: not so prototypical receptor tyrosine kinases. Cold Spring Harb. Perspect. Biol. 2014;6:a020768. doi: 10.1101/cshperspect.a020768. - DOI - PMC - PubMed