. 2023 Feb 13;14(1):809.
doi: 10.1038/s41467-023-36370-x.

Proteasome inhibition targets the KMT2A transcriptional complex in acute lymphoblastic leukemia

Affiliations

Proteasome inhibition targets the KMT2A transcriptional complex in acute lymphoblastic leukemia

Jennifer L Kamens et al. Nat Commun. .

Erratum in

  • Author Correction: Proteasome inhibition targets the KMT2A transcriptional complex in acute lymphoblastic leukemia.
    Kamens JL, Nance S, Koss C, Xu B, Cotton A, Lam JW, Garfinkle EAR, Nallagatla P, Smith AMR, Mitchell S, Ma J, Currier D, Wright WC, Kavdia K, Pagala VR, Kim W, Wallace LM, Cho JH, Fan Y, Seth A, Twarog N, Choi JK, Obeng EA, Hatley ME, Metzger ML, Inaba H, Jeha S, Rubnitz JE, Peng J, Chen T, Shelat AA, Guy RK, Gruber TA. Kamens JL, et al. Nat Commun. 2023 Mar 9;14(1):1297. doi: 10.1038/s41467-023-37141-4. Nat Commun. 2023. PMID: 36894563 Free PMC article. No abstract available.

Abstract

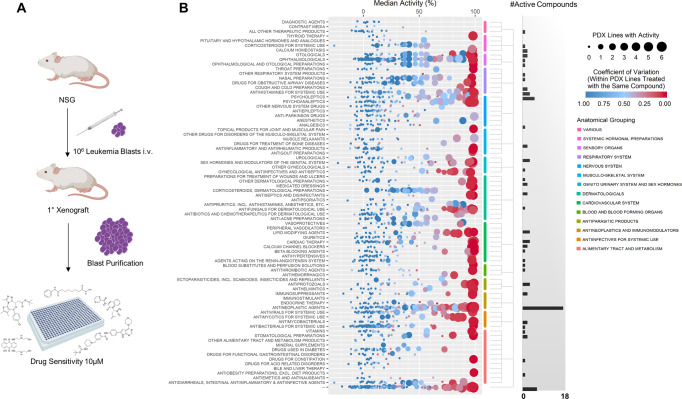
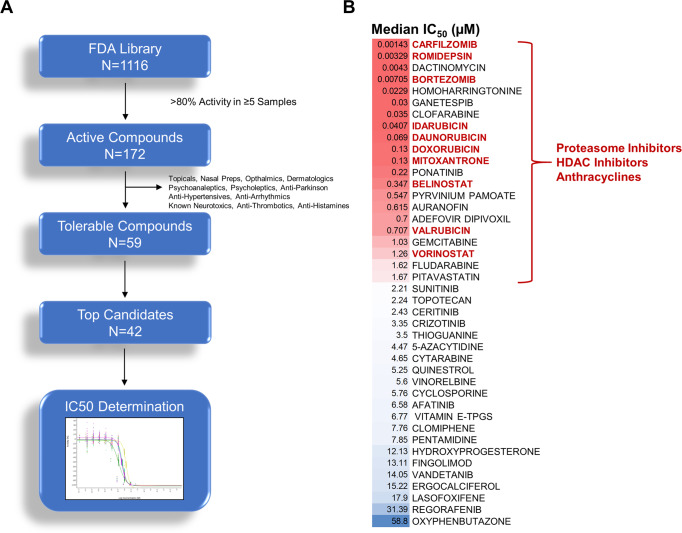
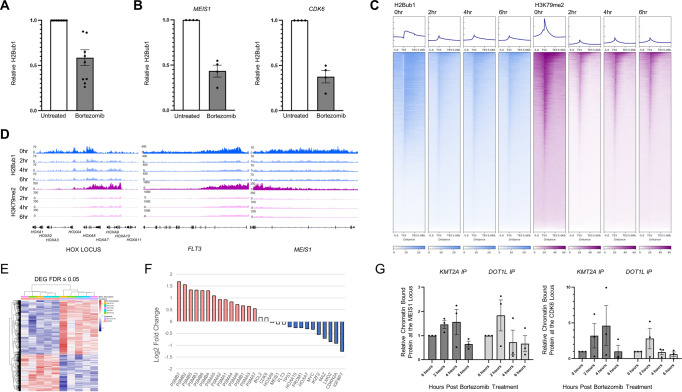
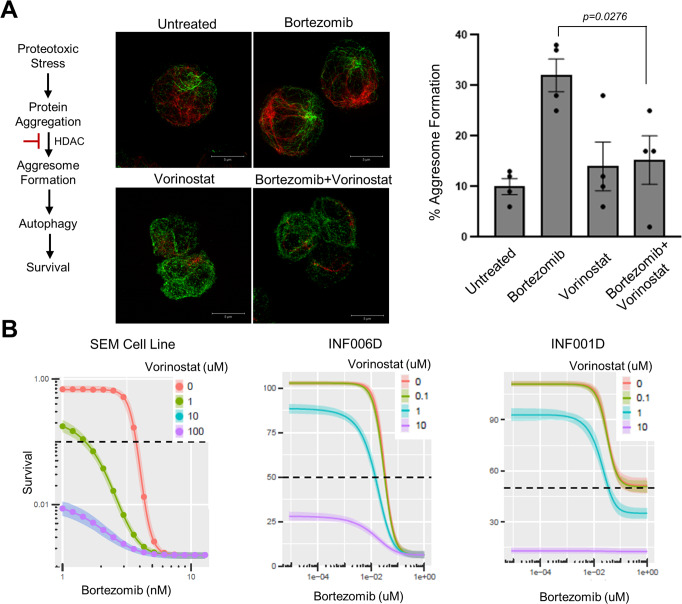
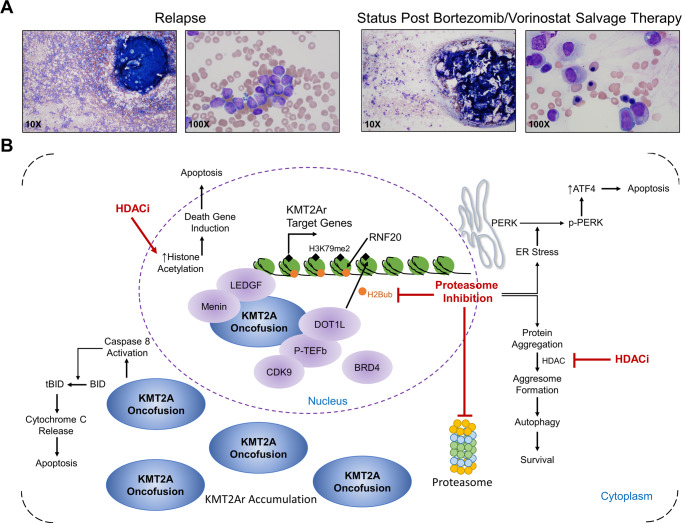
Rearrangments in Histone-lysine-N-methyltransferase 2A (KMT2Ar) are associated with pediatric, adult and therapy-induced acute leukemias. Infants with KMT2Ar acute lymphoblastic leukemia (ALL) have a poor prognosis with an event-free-survival of 38%. Herein we evaluate 1116 FDA approved compounds in primary KMT2Ar infant ALL specimens and identify a sensitivity to proteasome inhibition. Upon exposure to this class of agents, cells demonstrate a depletion of histone H2B monoubiquitination (H2Bub1) and histone H3 lysine 79 dimethylation (H3K79me2) at KMT2A target genes in addition to a downregulation of the KMT2A gene expression signature, providing evidence that it targets the KMT2A transcriptional complex and alters the epigenome. A cohort of relapsed/refractory KMT2Ar patients treated with this approach on a compassionate basis had an overall response rate of 90%. In conclusion, we report on a high throughput drug screen in primary pediatric leukemia specimens whose results translate into clinically meaningful responses. This innovative treatment approach is now being evaluated in a multi-institutional upfront trial for infants with newly diagnosed ALL.


Conflict of interest statement

The authors declare no competing interests.

Figures

Fig. 1
Fig. 1. High throughput screening of infant ALL.
A Study design. Primary leukemia blasts were thawed and injected into immunodeficient mice. Cells were harvested from moribund mice as described in “Methods” and viably stored in liquid nitrogen. Samples were thawed for drug sensitivity studies at a later time point. Figure created with BioRender.com, academic license. B In vitro activity of FDA-approved compounds. Six passaged patient specimens were thawed and cultured in the presence of compounds at a single concentration of 10 µM in duplicate as described in “Methods”. Normalized activity, defined as percent toxicity, was determined for each compound with each patient sample. Each data point corresponds to a single compound, the size of the data point indicates the number of patient samples with 80% or greater activity for that compound and the color indicates the coefficient of variation within the patient samples treated with that compound. Compounds are grouped according to class (see Supplementary Data 1). The number of compounds for each class with greater than 80% activity in five or more patient samples are shown. Source data are provided as a Source data file.
Fig. 2
Fig. 2. Active compounds.
A Overview of FDA screening hits. 1116 unique compounds were screened. 172 compounds demonstrated >80% activity across five or more patient samples. Drugs with untolerable side effects or those that lacked systemic preparations were removed. The top 43 compounds underwent a secondary validation with a 10-point dose–response assay in technical triplicates. B Median IC50 values of top 43 compounds. 50% of the top compounds with IC50 values less than 2 µM belonged to one of three classes of agents: proteasome inhibitors, HDAC inhibitors, and anthracyclines.
Fig. 3
Fig. 3. Bortezomib depletes H2Bub1 and H3K79me2 leading to downregulation of the KMT2A transcriptional program.
A Ten patient samples were treated with 5 nM bortezomib, histones were extracted and blotted for total and ubiquitinated H2B. The ratio of H2Bub1 to total H2B levels was determined by densitometry. Pre-treatment specimens were set to one and relative levels at 2 h are shown with the standard error of the mean. B Four patient samples were exposed to 5 nM bortezomib for 6 h or left untreated. CUT&RUN reaction with an H2Bub1 antibody followed by quantitative PCR for two KMT2A target genes, MEIS1 and CDK6, was done. Fold change over IgG was calculated and untreated specimens were set to one. The average across the four patient specimens with the standard error of the mean is shown. C ChIP-Rx of the KMT2Ar infant ALL cell line SEM at four time points (0, 2, 4, and 6 h following exposure to bortezomib) for H2Bub1 and H3K79me2 was done to quantitatively assess this epigenetic mark over time throughout the genome. Heatmaps of H2Bub1 and H3K79me2 genome-wide are shown. D Profiles at HOXA1-A11, FLT3, and MEIS1 gene loci. E Five patient specimens were grown in the presence or absence of 5 nM bortezomib for 20 h followed by RNA extraction from 2 million live cells and sequencing. Cells were analyzed at 20 h based on the half-life of mRNA which is 10 h. A heatmap of differentially expressed genes is shown. F Log2 fold change of proteasome complex transcripts, KMT2Ar target genes, and the cMYC target genes TP53 and CDKN2A are shown following exposure to bortezomib. The upregulation of proteasome complex genes demonstrates target inhibition. G The KMT2Ar infant ALL cell line (SEM) was grown in the presence or absence of bortezomib. CUT&RUN reactions at 0, 2, 4, and 6 h following exposure to bortezomib was done with an N-Terminal KMT2A antibody and DOT1L. Quantitative PCR for two KMT2A target genes, MEIS1 and CDK6 was determined. Fold change over IgG was calculated and untreated specimens were set to one. The average across four independent experiments are shown with the standard error of the mean. Source data are provided as a Source data file.
Fig. 4
Fig. 4. Vorinostat is synergistic with bortezomib in KMT2Ar leukemia.
A SEM cells were incubated for 8 h in 3 nM bortezomib, 1 µM vorinostat, or both followed by staining for acetylated tubulin (green) and vimentin (red) to visualize microtubules and aggresomes, respectively. Representative images are shown. 100 cells were scored per group by three individuals independently for the presence of aggresomes, average counts with the standard error of the mean are shown. Unpaired t test comparing bortezomib to bortezomib+vorinostat, two-tailed p value equals 0.0276. Source data are provided as a Source data file. B Cytotoxicity assay of bortezomib in combination with vorinostat. The KMT2Ar infant ALL cell line SEM and two patient samples were grown in the presence of bortezomib and vorinostat at the indicated concentrations for 72 h in technical triplicates. Viability was assessed by cell titer glo. Estimated effect of various levels of vorinostat in combination with bortezomib are shown. Curve shifts to the left indicate potentiation. EC50 values of bortezomib in the presence of varying concentrations of vorinostat are presented in Table 1. See Supplementary Fig. 17 for the best fit BRAID surface for each combination with estimated value of κ and confidence interval.
Fig. 5
Fig. 5. Restoration of trilineage hematopoiesis following treatment with bortezomib and vorinostat containing chemotherapy regimen in a refractory patient.
A Bone marrow aspirates of case 3b (see Table 2) at the time of relapse post-transplant and post-treatment with bortezomib and vorinostat-containing chemotherapy regimen are shown at ×10 and ×100 magnification. Flow-based MRD and RT-PCR for the KMT2A-MLLT1 oncogene present in this patient were both negative post-treatment. B Model of proteasome and HDAC inhibition in KMT2Ar leukemia. Proteasome inhibitors deplete H2Bub1 leading to downregulation of the KMT2A gene expression program and accumulation of the KMT2A fusion which triggers caspase 812. HDACi prevent aggresome formation and increase in histone acetylation and death gene induction promoting apoptosis.

References

    1. Pieters R, et al. Outcome of infants younger than 1 year with acute lymphoblastic leukemia treated with the interfant-06 protocol: results from an international phase III randomized study. J. Clin. Oncol. 2019;37:2246–2256. doi: 10.1200/JCO.19.00261. - DOI - PubMed
    1. Pui CH, et al. Treating childhood acute lymphoblastic leukemia without cranial irradiation. N. Engl. J. Med. 2009;360:2730–2741. doi: 10.1056/NEJMoa0900386. - DOI - PMC - PubMed
    1. Meyer C, et al. The MLL recombinome of acute leukemias in 2017. Leukemia. 2018;32:273–284. doi: 10.1038/leu.2017.213. - DOI - PMC - PubMed
    1. Andersson AK, et al. The landscape of somatic mutations in infant MLL-rearranged acute lymphoblastic leukemias. Nat. Genet. 2015;47:330–337. doi: 10.1038/ng.3230. - DOI - PMC - PubMed
    1. Bernt KM, et al. MLL-rearranged leukemia is dependent on aberrant H3K79 methylation by DOT1L. Cancer Cell. 2011;20:66–78. doi: 10.1016/j.ccr.2011.06.010. - DOI - PMC - PubMed

Publication types

MeSH terms

Substances