. 2023 Feb 13;14(1):797.
doi: 10.1038/s41467-023-36296-4.

Single-cell RNA sequencing reveals the effects of chemotherapy on human pancreatic adenocarcinoma and its tumor microenvironment

Affiliations

Single-cell RNA sequencing reveals the effects of chemotherapy on human pancreatic adenocarcinoma and its tumor microenvironment

Gregor Werba et al. Nat Commun. .

Erratum in

Abstract

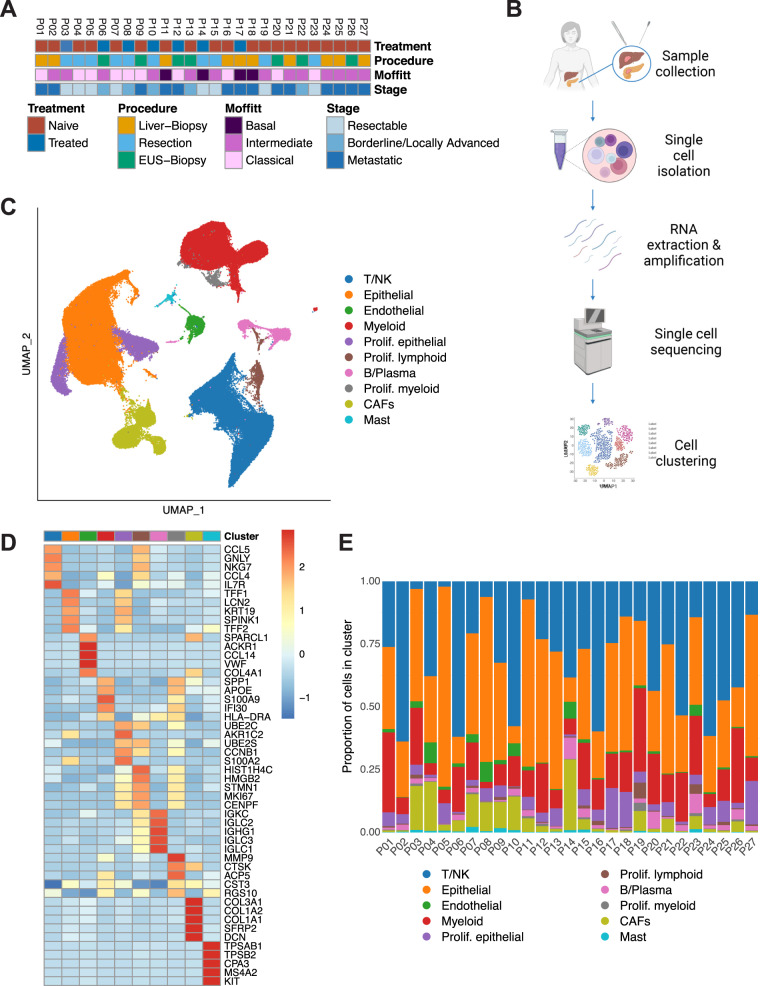
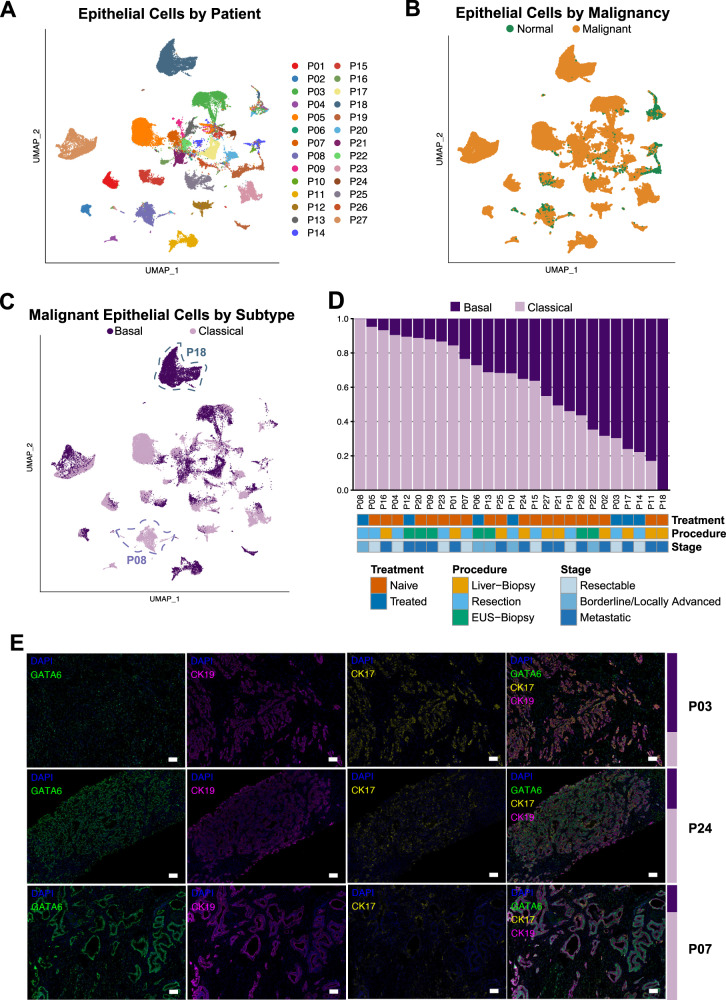
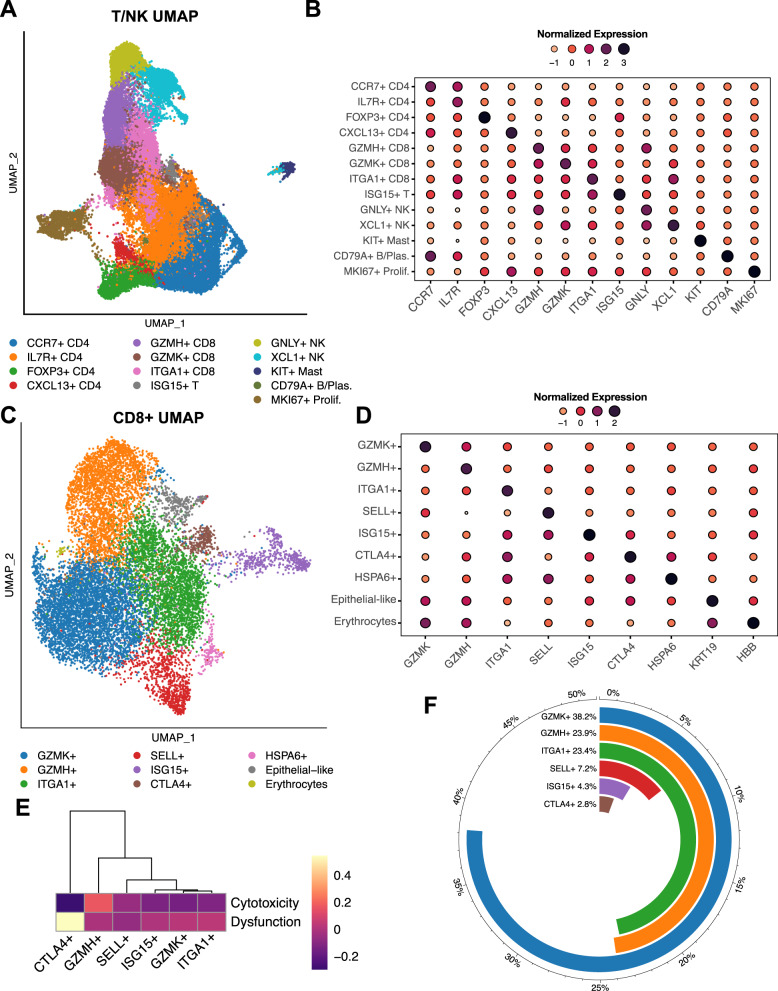
The tumor microenvironment (TME) in pancreatic ductal adenocarcinoma (PDAC) is a complex ecosystem that drives tumor progression; however, in-depth single cell characterization of the PDAC TME and its role in response to therapy is lacking. Here, we perform single-cell RNA sequencing on freshly collected human PDAC samples either before or after chemotherapy. Overall, we find a heterogeneous mixture of basal and classical cancer cell subtypes, along with distinct cancer-associated fibroblast and macrophage subpopulations. Strikingly, classical and basal-like cancer cells exhibit similar transcriptional responses to chemotherapy and do not demonstrate a shift towards a basal-like transcriptional program among treated samples. We observe decreased ligand-receptor interactions in treated samples, particularly between TIGIT on CD8 + T cells and its receptor on cancer cells, and identify TIGIT as the major inhibitory checkpoint molecule of CD8 + T cells. Our results suggest that chemotherapy profoundly impacts the PDAC TME and may promote resistance to immunotherapy.


Conflict of interest statement

The authors declare no competing interests.

Figures

Fig. 1
Fig. 1. Single-cell analysis reveals the transcriptomic landscape in PDAC.
A Clinicopathologic characteristics for each patient sample including treatment status, stage, Moffitt subtype, and procedure. EUS endoscopic ultrasound. B Workflow depicting sample acquisition, processing, and analysis. Designed with BioRender©. C UMAP, embedding of the expression profile of 139,446 cells that passed quality control from n = 27 patient samples. Distinct clusters are annotated and color-coded. CAF cancer-associated fibroblast, NK natural killer, UMAP uniform manifold approximation and projection. D Heatmap of the five most differentially expressed genes within each cluster. Colors correspond to the cluster colors in Fig. 1C. E Proportional distribution of each cell cluster by individual sample.
Fig. 2
Fig. 2. The epithelial compartment reveals heterogeneous malignant subtype composition.
A Non-batch corrected UMAP of all epithelial cells, showing clustering by patient sample of most epithelial cells and clustering of some epithelial cells across samples. UMAP uniform manifold approximation and projection. B Non-batch corrected UMAP of malignant and normal epithelial cells as determined by InferCNV. C UMAP embedding of malignant epithelial cells labeled with Moffitt subtypes. Exemplary samples high in basal (P18) and classical (P08) cells are annotated. D Proportion of cells of each Moffitt subtype by sample. EUS endoscopic ultrasound. E Representative (n = 27) images of multiplex immunofluorescence across the subtype spectrum: higher in basal (upper panel, P03), mixed (middle panel, P24), and higher in classical (lower panel, P07) subtype tumors. Basal-to-classical ratio for each sample by scRNA-seq transcriptional analysis is shown on the right as a colored bar (dark = basal, light = classical). Channels (always including DAPI (blue)): GATA6 (green), CK19 (cytokeratin 19) (violet), CK17 (cytokeratin 17) (yellow), and merged. Scale bar = 100 μm.
Fig. 3
Fig. 3. Charting the CAF landscape in the PDAC tumor microenvironment.
A UMAP overview of the mesenchymal compartment. CAF cancer-associated fibroblast, iCAF inflammatory CAF, myCAF myofibroblastic CAF, UMAP uniform manifold approximation and projection. B Heatmap of the five most differentially expressed genes within each cluster. Colors correspond to the cluster colors in panel (A, C). iCAF, myCAF, and apCAF signatures from Elyada et al. overlaid on the UMAP embedding of our mesenchymal compartment. The iCAF and myCAF signatures are derived from human fibroblasts; the apCAF signature is derived from KPC mouse fibroblasts. apCAF antigen-presenting CAF. D Assessment of correlation (two-sided Pearson correlation) between myCAF/iCAF composition and basal/classical composition among our samples (n = 16). Samples are plotted as a function of the percentage of their CAF cells that are myCAFs and the percentage of their malignant epithelial cells that are basal. Samples with fewer than 40 total CAF cells were excluded; all but one of these samples were biopsies, which were not expected to pick up many mesenchymal cells. E Selected gene set enrichment analysis results from a comparison between the cells in the iCAF and myCAF compartments. ECM extracellular matrix.
Fig. 4
Fig. 4. Charting the T/NK landscape in the PDAC tumor microenvironment.
A UMAP overview of the T/NK compartment. NK natural killer, UMAP uniform manifold approximation and projection. B The most differentially expressed gene within each T/NK cluster. C UMAP of the more granular CD8 + T cell reclustering reveals additional subpopulations. D The most differentially expressed gene within each CD8 + T cell cluster. E Hierarchical clustering of the CD8 + T cell subsets based on dysfunction and cytotoxicity scores. F Composition of the CD8 + T cell subset (excluding the two non-T cell clusters and the single-patient cluster).
Fig. 5
Fig. 5. C1QC + and SPP1 + TAMs comprise two distinct subpopulations within the myeloid cell compartment.
A UMAP overview of the myeloid compartment. DC dendritic cell, MDSC myeloid-derived suppressor cell, UMAP uniform manifold approximation and projection. B For each myeloid cluster, the two genes most differentially expressed between that cluster and the rest of the myeloid compartment. TAM, tumor-associated macrophages. C M1 (left) and M2 (right) polarization signatures in the macrophage populations. D Selected gene set enrichment analysis results from a comparison between SPP1 + and C1QC + TAMs. EMT, epithelial-mesenchymal transition. E Phagocytosis and angiogenesis scores for SPP1 + and C1QC + TAMs. One sample with fewer than 40 total TAM cells was excluded. (n = 26 samples; two-sided Wilcoxon rank-sum test; box plots centered around the median with hinges at 1st and 3rd quartiles and whiskers from hinge to max value or 1.5*IQR, whichever is smallest).
Fig. 6
Fig. 6. Chemotherapy treatment induces transcriptional changes in cancer cells independent of subtype.
A Basal and classical signature expression scatterplot of cancer cells (treated, naive and combined). B Basal and classical signature expression scatterplot of cancer cells (treated and naïve by patient, combined by treatment); sample P03 has been removed from the combined plot. C Box plot showing the median intracluster correlation of cancer cells by sample for treated (n = 6) and naive (n = 11) groups (two-sided Wilcoxon rank-sum test, p = 0.26; box plots centered around the median with hinges at 1st and 3rd quartiles and whiskers from hinge to max value or 1.5*IQR, whichever is smallest). D Density plots of cancer cell correlation within samples for treated and untreated groups. E Gene set enrichment analysis of overall cancer cells, treated and untreated.
Fig. 7
Fig. 7. Chemotherapy reduces expression of inhibitory checkpoint molecules and ligand-receptor interactions in PDAC.
A Heatmap displaying an overview of all inferred LRIs between displayed cell types (cancer cells, MDSCs, DCs, C1QC + TAMs, SPP1 + TAMs, iCAFs, myCAFs, CD8 + T cells, CD4 + T cells). Left: untreated samples, right: treated samples. CAF cancer-associated fibroblast, DC dendritic cell, iCAF inflammatory CAF, LRI ligand-receptor interaction, MDSC myeloid-derived suppressor cell, myCAF myofibroblastic CAF, TAM tumor-associated macrophage. B Heatmap displaying the fold change between the number of inferred LRIs in naïve and treated samples for each pair of cell types. Red indicates more inferred LRIs in naïve samples and blue indicates more inferred LRIs in treated samples. C Dot plot of CellphoneDB output (see Methods) for recruitment-associated LRIs between iCAFs/myCAFs and SPP1 + /C1QC + TAMs comparing untreated and treated samples. D Differential gene expression of checkpoint molecules in CD8 + T cells between treated and untreated samples. E Dot plot of CellphoneDB output (see Methods) for checkpoint molecule LRIs between CD8 + T cells, SPP1 + or C1QC + TAMs, and cancer cells comparing untreated and treated samples.

Comment in

References

    1. Siegel RL, Miller KD, Fuchs HE, Jemal A. Cancer statistics, 2022. CA Cancer J. Clin. 2022;72:7–33. doi: 10.3322/caac.21708. - DOI - PubMed
    1. Rahib L, Wehner MR, Matrisian LM, Nead KT. Estimated projection of US cancer incidence and death to 2040. JAMA Netw. Open. 2021;4:e214708. doi: 10.1001/jamanetworkopen.2021.4708. - DOI - PMC - PubMed
    1. Vincent A, Herman J, Schulick R, Hruban RH, Goggins M. Pancreatic cancer. Lancet. 2011;378:607–620. doi: 10.1016/S0140-6736(10)62307-0. - DOI - PMC - PubMed
    1. O’Reilly EM, et al. Durvalumab with or without tremelimumab for patients with metastatic pancreatic ductal adenocarcinoma: a phase 2 randomized clinical trial. JAMA Oncol. 2019;5:1431–1438. doi: 10.1001/jamaoncol.2019.1588. - DOI - PMC - PubMed
    1. Bear AS, Vonderheide RH, O’Hara MH. Challenges and opportunities for pancreatic cancer immunotherapy. Cancer Cell. 2020;38:788–802. doi: 10.1016/j.ccell.2020.08.004. - DOI - PMC - PubMed

Publication types

MeSH terms