. 2023 Feb 13;14(1):802.
doi: 10.1038/s41467-023-36519-8.

Single-cell RNA-sequencing identifies disease-associated oligodendrocytes in male APP NL-G-F and 5XFAD mice

Affiliations

Single-cell RNA-sequencing identifies disease-associated oligodendrocytes in male APP NL-G-F and 5XFAD mice

Hanseul Park et al. Nat Commun. .

Abstract

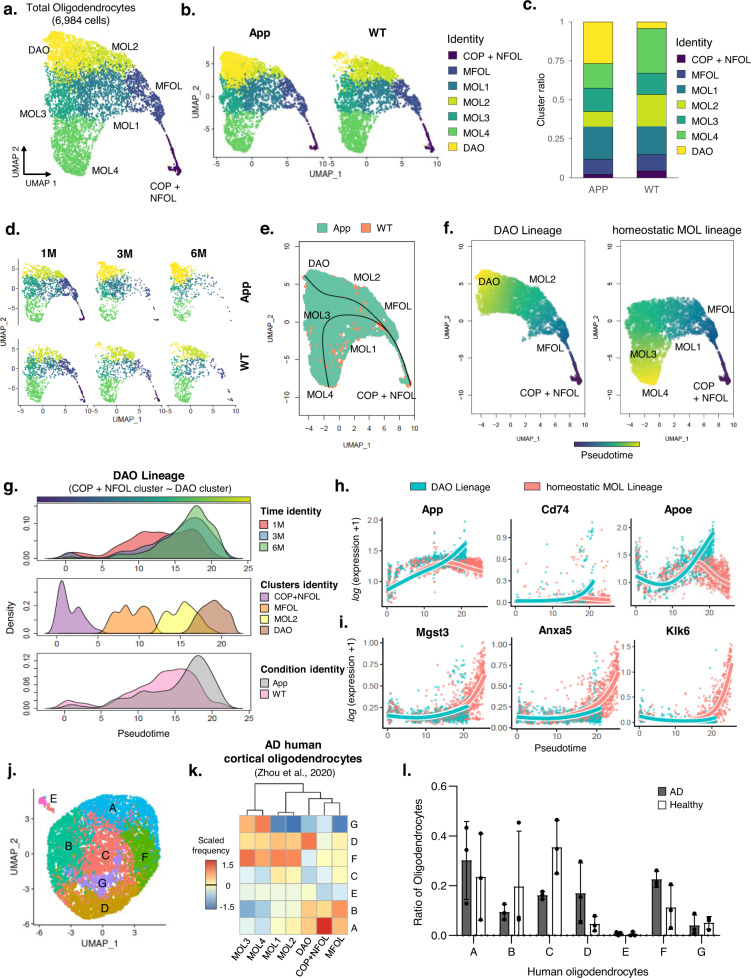
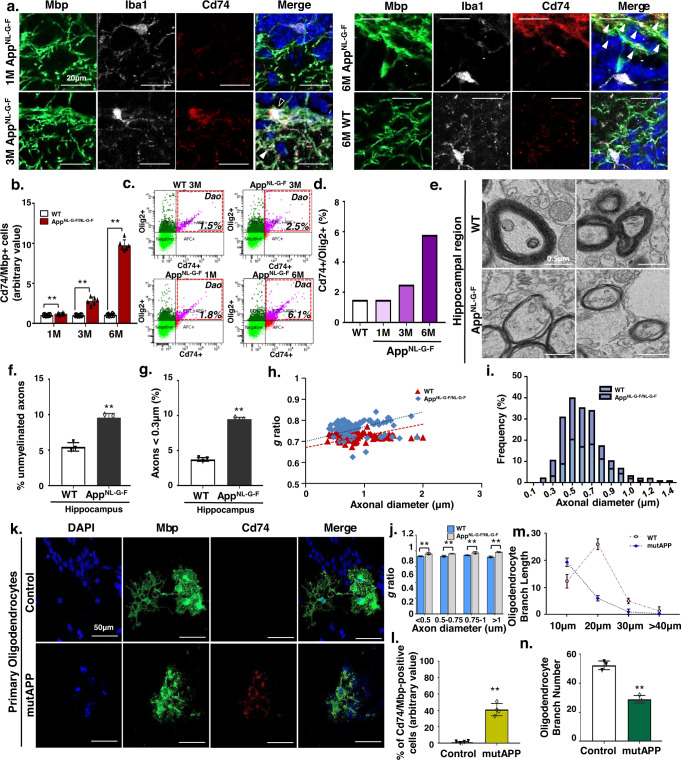
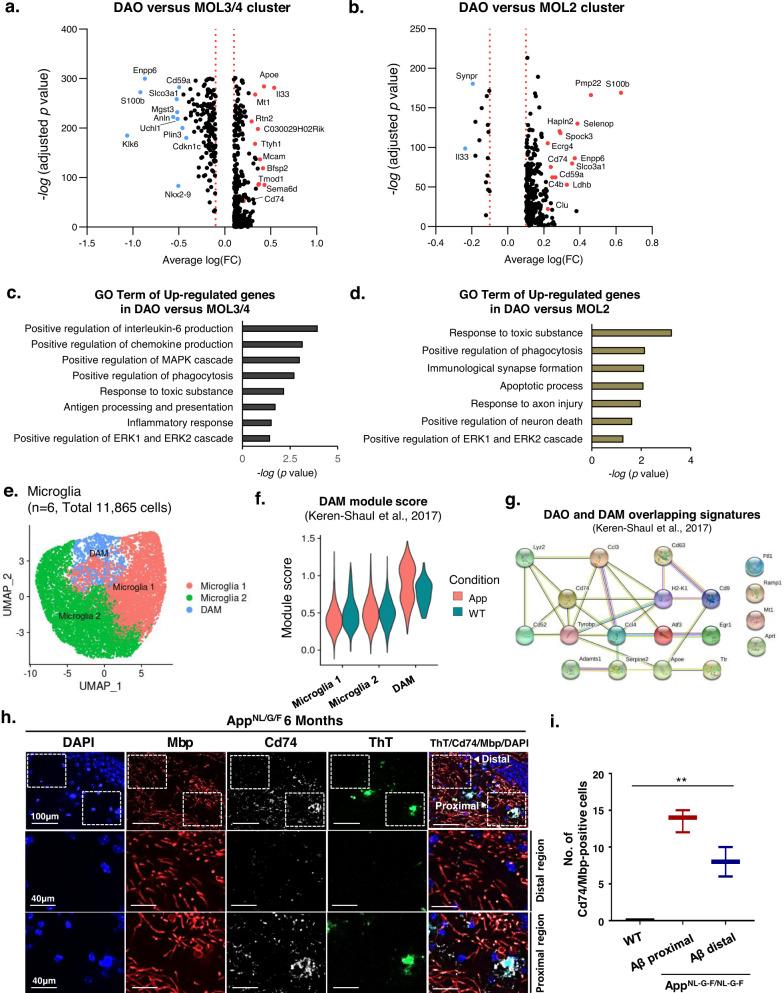
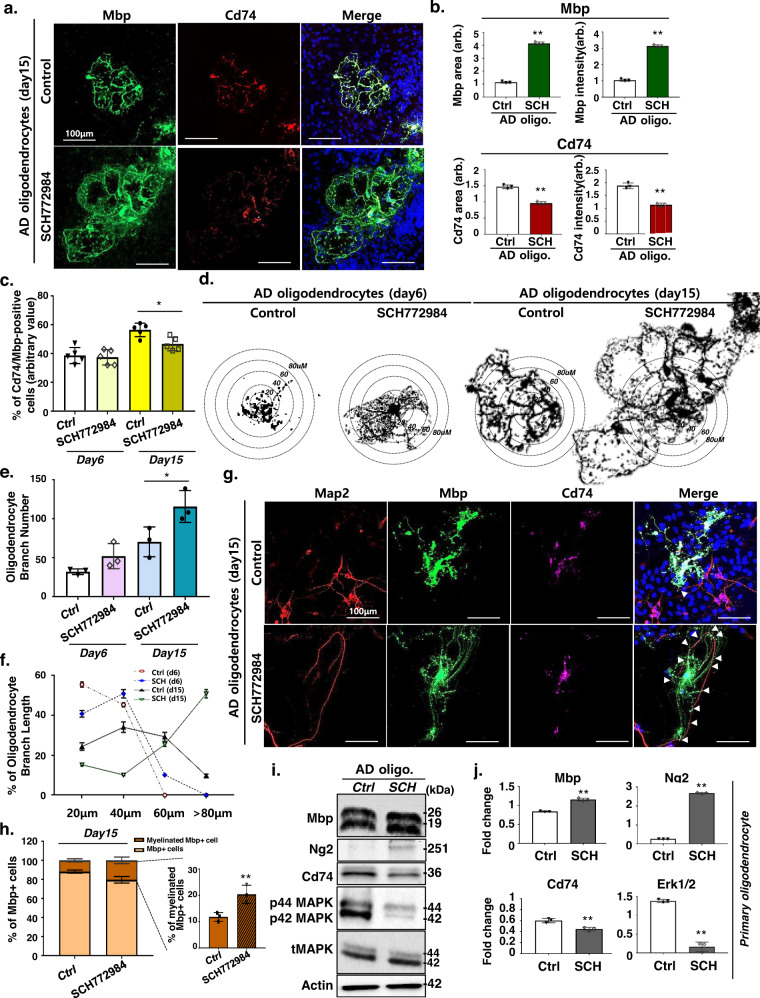
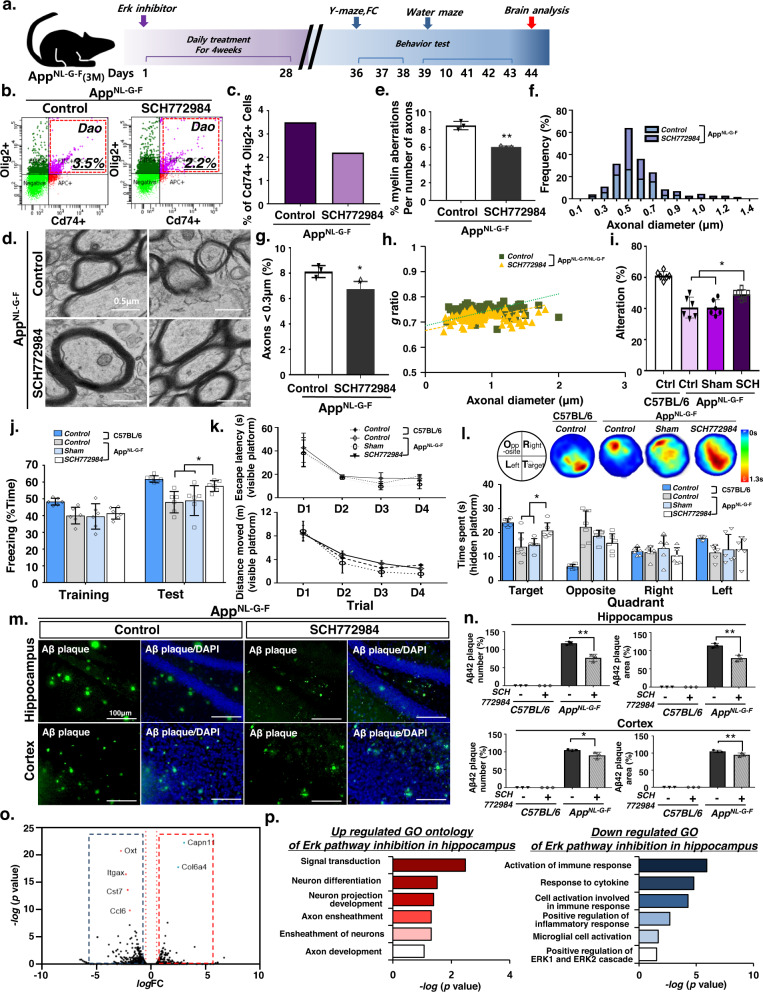
Alzheimer's disease (AD) is associated with progressive neuronal degeneration as amyloid-beta (Aβ) and tau proteins accumulate in the brain. Glial cells were recently reported to play an important role in the development of AD. However, little is known about the role of oligodendrocytes in AD pathogenesis. Here, we describe a disease-associated subpopulation of oligodendrocytes that is present during progression of AD-like pathology in the male AppNL-G-F and male 5xFAD AD mouse brains and in postmortem AD human brains using single-cell RNA sequencing analysis. Aberrant Erk1/2 signaling was found to be associated with the activation of disease-associated oligodendrocytes (DAOs) in male AppNL-G-F mouse brains. Notably, inhibition of Erk1/2 signaling in DAOs rescued impaired axonal myelination and ameliorated Aβ-associated pathologies and cognitive decline in the male AppNL-G-F AD mouse model.


Conflict of interest statement

The authors declare no competing interests.

Figures

Fig. 1
Fig. 1. Single-cell RNA-seq reveals disease-associated oligodendrocytes (DAOs) in App KI mice.
a UMAP plot showing oligodendrocyte clusters in the hippocampal region of WT and AppNL-G-F mice. b UMAP plot showing oligodendrocyte clusters across conditions. c, d Distribution of oligodendrocytes from 1-, 3, 6-month-old WT, and AppNL-G-F mice. e Two lineages of oligodendrocytes with a cluster-based minimum spanning tree with line. f Continuous trajectory projection by slingshot-based UMAP plot showing two lineages. g Density plot of the DAOs continuous trajectory across three-time points, clusters, and conditions. h Visualization of smoothed gene expression patterns of the DAO lineage, plotted on pseudotime. i Visualization of smoothed gene expression patterns of the homeostatic mature oligodendrocyte lineage, plotted on pseudotime. j UMAP plot showing all human oligodendrocytes merged with the healthy control (n = 3) and postmortem AD (n = 3). k Analysis of expression prevalence between human and mouse with top expression signature markers. The color bar indicates the expression prevalence of human oligodendrocytes A, B, C, D, E, F and G (columns) mapped to the mouse COP + NFOL, MFOL, MOL1, MOL2, MOL3, MOL4, and DAO clusters (rows). l Bar plot showing the ratio of the proportion of total oligodendrocytes in healthy control (n = 3) and postmortem AD (n = 3). Source data are provided as a Source Data file. WT wild-type, AD Alzheimer’s disease, M month.
Fig. 2
Fig. 2. Identification of a novel disease-related oligodendrocyte cluster in Aβ-reactive state.
a Immunohistochemistry for Mbp (green), Iba1 (white), Cd74 (red), and DAPI (blue) in the DG of WT at 6-months and AppNL-G-F mice at 1, 3, and 6-months of age. White, Cd74+oligodendrocyte; Black, Cd74+microglia. b Quantification of Cd74/Mbp-positive cells in WT and AppNL-G-F mice at 1, 3, and 6-months of age. All data are expressed as mean ± SEM, n = 6. **p < 0.01, two-sided Student’s t-test. c The frequencies of Cd74+ and Olig2+ were determined by FACS analysis. Representative FACS plots are shown. d Bar graph illustrating the results of the quantitative FACS analysis of Cd74-positive subsets of the Olig2-positive population. e Electron micrographs of axons in the DG from 6-month-old WT and AppNL-G-F mice. f Percentage of unmyelinated axons in the DG of 6-month-old WT and AppNL-G-F mice. All data are expressed as mean ± SEM, n = 3. **p < 0.01, two-sided Student’s t-test. g Percentage of small-caliber axons in DG regions from 6-month-old WT and AD mice. All data are expressed as mean ± SEM, n = 3. **p < 0.01, two-sided Student’s t-test. h Scatter plot of g-ratio values in DG regions from 6-month-old WT and AppNL-G-F mice. i Distribution of the axon caliber of DG regions from 6-month-old WT and AppNL-G-F mice. j g-ratio of 6-month-old WT and AD mice according to axon diameter. All data are expressed as mean ± SEM, n = 3. **p < 0.01, two-sided Student’s t-test. k Immunohistochemistry for Mbp (green), Cd74 (red), and DAPI (blue) in primary oligodendrocytes with mutAPP treatment. l Percentage of Cd74/Mbp-positive cells. Data are expressed as mean ± SEM, n = 4. **p < 0.01, two-sided Student’s t-test. m Branch lengths of mutAPP primary oligodendrocytes by branch length. Data are expressed as mean ± SEM, n = 3. *p < 0.05, two-sided Student’s t-test. n Number of oligodendrocyte branches. Data are expressed as mean ± SEM, n = 3. **p < 0.01, two-sided Student’s t-test. Source data and p-values in b, d, fj, and ln are provided as a Source Data file.
Fig. 3
Fig. 3. Identification of molecular dynamics in DAOs.
a Volcano plot showing differentially expressed genes in DAOs compared with MOL3/4 clusters (Wilcoxon rank sum test; two-sided, log (fc) threshold > 0.1 and log (fc) threshold < −0.1). b Volcano plot showing differentially expressed genes in DAOs compared with the MOL2 cluster (Wilcoxon Rank Sum test; two-sided, log (fc) threshold > 0.1 and log (fc) threshold < −0.1). c Gene ontology of up-regulated genes in DAOs versus MOL3/4 clusters; one-sided p-values for Fisher’s Exact test. d Gene ontology of up-regulated genes in DAOs versus MOL2 cluster; one-sided p-values for Fisher’s Exact test. e UMAP plot showing microglia 1, microglia 2, and DAM clusters in age-matched WT and App KI mice. f Signature module scores of disease-associated microglia (DAM) enriched in our AD data. Violin plots showing the DAM module score in sub-clusters of WT and App microglia across different conditions (calculated from upregulated DAM genes compared to those of homeostatic microglia). g Gene interaction plot showing 19 overlapping genes between DAM and DAO clusters. Overlapping signatures between DAM and DAO clusters. h Immunohistochemistry for ThT (green), Cd74 (white), Mbp (red), and DAPI (blue) in the hippocampus of 6-month-old AppNL-G-F mice. i Number of Cd74/Mbp-positive cells from plaque distal and proximal regions. Data are expressed as mean ± SEM (n = 3). **p < 0.01, two-way ANOVA with Tukey’s post hoc test. Source data and p-values are provided as a Source Data file.
Fig. 4
Fig. 4. ERK inhibitor rescues AD-associated abnormal oligodendrocytes.
a Immunohistochemistry of Mbp (green), Cd74 (red), and DAPI (blue) in AppNL-G-F primary oligodendrocytes treated with SCH772984 on day 15. b Quantification of the intensity of Mbp and Cd74 immunohistochemistry in SCH772984-treated AppNL-G-F primary oligodendrocytes. Data are expressed as mean ± SEM, n = 3. **p < 0.01, two-sided Student’s t-test. p-values are provided as a Source Data file. c Percentage of Cd74/Mbp-positive oligodendrocytes in control and SCH772984-treated oligodendrocytes on days 6 and 15. Data are expressed as mean ± SEM, n = 5, one-way ANOVA coupled with Tukey’s post hoc test (p < 0.05). d Mature Mbp-positive oligodendrocytes extending branched processes in SCH772984-treated AppNL-G-F primary oligodendrocytes at days 6 and 15. Branching was quantified by measuring the size of the branches in the circles. e Number of branches in the SCH772984-treated AppNL-G-F primary oligodendrocytes. Data are expressed as mean ± SEM, n = 3, one-way ANOVA coupled with Tukey’s post hoc test (p < 0.05). f Branch length distribution in SCH772984-treated AppNL-G-F primary oligodendrocytes. Data are expressed as mean ± SEM, n = 3. two-sided Student’s t-test. g Immunohistochemistry for Map2 (red), Mbp (green), Cd74 (purple), and DAPI (blue) in primary neuron/oligodendrocyte co-cultures at day 15. h Percentage of myelinating Mbp-positive oligodendrocytes. Data are expressed as mean ± SEM, n = 3. **p < 0.01, two-sided Student’s t-test (p = 0.018). i Western blot analysis of Mbp, Ng2, Cd74, p44/p42 MAPK, tMAPK, and Actin in SCH772984-treated AppNL-G-F primary oligodendrocytes. Western blot performed three biological replicates. j Quantification of western blot results shown in i. Data are expressed as mean ± SEM, n = 3. **p < 0.01, two-sided Student’s t-test. Source data in b, c, e, f, h, i, and j are provided as a Source Data file. p-values in b, c, e, f, and j are provided as a Source Data. arb arbitrary units.
Fig. 5
Fig. 5. ERK1/2 inhibition rescues cognitive decline in AD mice via DAO regulation.
a Schematic diagram showing the ERK inhibitor treatment approach. Mice were treated with ERK inhibitors via a daily intraperitoneal injection for 4 weeks. b The frequencies of Cd74+ and Olig2+ were determined by FACS analysis. Representative FACS plots are shown. c Bar graph showing quantitative FACS analysis of Cd74-positive subsets of the Olig2-positive population. d Electron micrographs of axons in the DG from AppNL-G-F mice. e Percentage of aberrant myelinated axons. Data are expressed as mean ± SEM, n = 3. **p < 0.01, two-sided Student’s t-test. f Distribution of axon caliber. g Percentage of small-caliber axons. Data are expressed as mean ± SEM, n = 3. *p < 0.05, two-sided Student’s t-test. h Scatter plot of g-ratio. i Y-maze test of AppNL-G-F mice. Data are expressed as mean ± SEM (n = 6). *p < 0.05, one-way ANOVA with Tukey’s post hoc test. j Fear conditioning test of mice. Data are expressed as mean ± SEM (n = 6). *p < 0.05, two-way ANOVA with Tukey’s post hoc test. k, l Water maze test of AppNL-G-F mice. k Escape latency and distance moved during trial. Data are expressed as mean ± SEM (n = 6). one-way ANOVA with Tukey’s post hoc test. l The upper panel illustrates visited area, and the bottom panel presents quadrant occupancy quantification analysis. Data are expressed as mean ± SEM (n = 6). *p < 0.05, two-way ANOVA with Tukey’s post hoc test. m Immunohistochemistry for ThT in AppNL-G-F mice. n Percentage of Aβ plaque number and area in Fig. 5m. Data are expressed as mean ± SEM. *p < 0.05 and **p < 0.01, one-way ANOVA with Tukey’s post hoc test. o Volcano plot of genes based on RNA-seq analysis. The threshold for determining differentially up- and down-regulated gene expression is indicated by blue (downregulated) and red (upregulated) boxes (one-sided, log (p-value) > 5, log (FoldChange) > 1.5). p Gene ontology enrichment analysis of significantly up- or down-regulated genes; one-sided p-values for Fisher’s Exact test. Source data and p-values in e, g, il, and n are provided as a Source Data file.

References

    1. Finch CE, Cohen DM. Aging, metabolism, and Alzheimer disease: review and hypotheses. Exp. Neurol. 1997;143:82–102. doi: 10.1006/exnr.1996.6339. - DOI - PubMed
    1. Rogers J, et al. Complement activation by beta-amyloid in Alzheimer disease. Proc. Natl Acad. Sci. USA. 1992;89:10016–10020. doi: 10.1073/pnas.89.21.10016. - DOI - PMC - PubMed
    1. Hensley K, et al. A model for beta-amyloid aggregation and neurotoxicity based on the free radical generating capacity of the peptide: implications of “molecular shrapnel” for Alzheimer’s disease. Proc. West Pharm. Soc. 1995;38:113–120. - PubMed
    1. Heppner FL, Ransohoff RM, Becher B. Immune attack: the role of inflammation in Alzheimer disease. Nat. Rev. Neurosci. 2015;16:358–372. doi: 10.1038/nrn3880. - DOI - PubMed
    1. von Bernhardi R. Glial cell dysregulation: a new perspective on Alzheimer disease. Neurotox. Res. 2007;12:215–232. doi: 10.1007/BF03033906. - DOI - PubMed

Publication types