. 2023 Feb 13;14(1):795.
doi: 10.1038/s41467-023-36471-7.

Illumination of a progressive allosteric mechanism mediating the glycine receptor activation

Affiliations

Illumination of a progressive allosteric mechanism mediating the glycine receptor activation

Sophie Shi et al. Nat Commun. .

Abstract

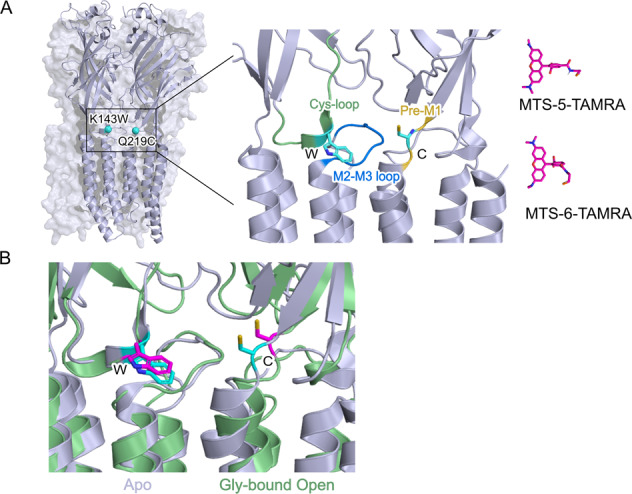
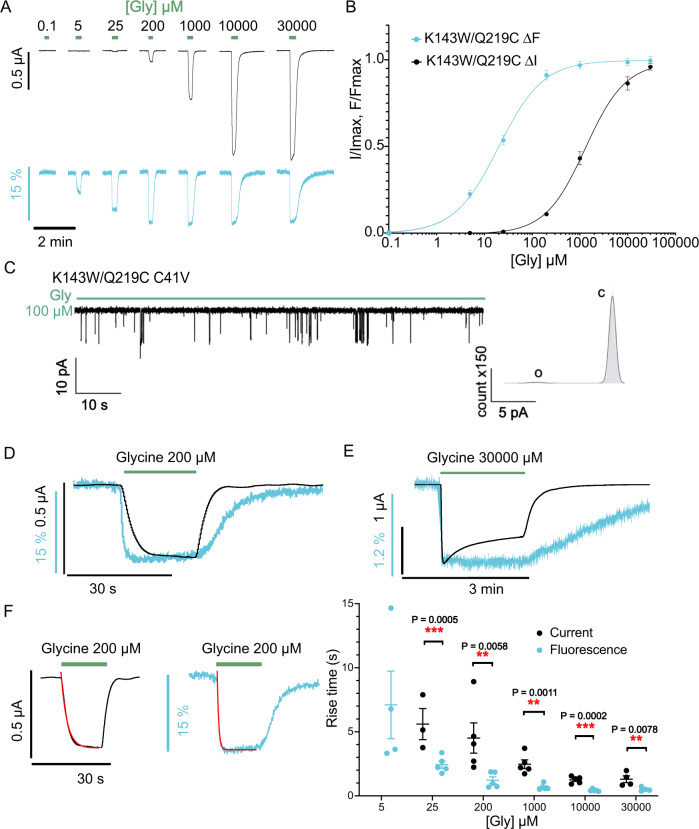
Pentameric ligand-gated ion channel mediate signal transduction at chemical synapses by transiting between resting and open states upon neurotransmitter binding. Here, we investigate the gating mechanism of the glycine receptor fluorescently labeled at the extracellular-transmembrane interface by voltage-clamp fluorometry (VCF). Fluorescence reports a glycine-elicited conformational change that precedes pore opening. Low concentrations of glycine, partial agonists or specific mixtures of glycine and strychnine trigger the full fluorescence signal while weakly activating the channel. Molecular dynamic simulations of a partial agonist bound-closed Cryo-EM structure show a highly dynamic nature: a marked structural flexibility at both the extracellular-transmembrane interface and the orthosteric site, generating docking properties that recapitulate VCF data. This work illuminates a progressive propagating transition towards channel opening, highlighting structural plasticity within the mechanism of action of allosteric effectors.


Conflict of interest statement

The authors declare no competing interests.

Figures

Fig. 1
Fig. 1. Localization of K143W/Q219C sensor in the α1 glycine receptor structure.
A Side view of the zebrafish α1 glycine receptor structure in Apo state (PDB:6PXD) showing the position of the mutated residues K143W in Cys-loop and Q219C in Pre-M1 loop. Right panel: representation of the two isomers of 5(6)-carboxytetramethylrhodamine methanethiosulfonate (MTS-TAMRA) used for the labeling of the mutated cysteine. B Structural comparison of the quenching sensor K143W/Q219C between the Apo state in gray (PDB:6PXD) and Gly-bound open state in green (PBD:6PM6), residues are presented in cyan for apo state and magenta for Gly-bound open state. The distance calculated between the Cα of the two residues varied from 12.9 Å for the Apo state to 15.6 Å for the Open state.
Fig. 2
Fig. 2. Electrophysiological and fluorescence characterization of K143W/Q219C sensor by VCF on C41V GlyR.
A Representative VCF recordings on oocytes of the mutant labeled with MTS-TAMRA (black for current and cyan for fluorescence). Glycine application triggers a current variation and a fluorescence quenching phenomenon with a maximum fluorescence variation that reaches 12.1 ± 1.1 % of ΔF/F. At low concentrations of glycine (under 25 µM), only fluorescence quenching is observed without any current. B ΔI (black) and ΔF (cyan) dose-response curves with mean ± SEM values (n = 5). C Left panel: representative trace of single-channel recordings obtained in outside-out configuration recorded at −100 mV with concentrations of glycine at 100 µM. Right panel: histograms of current amplitude representing the closed state (c) and the open state (o). D Superimposition of the current and fluorescence recordings evoked by 200 µM glycine application shows that the onset of the fluorescence is faster than the onset of the current and that the fluorescence offset is slower than the current offset. E Representative recording with a high glycine concentration (30 mM) application shows that the desensitization triggered by a prolonged glycine application does not impact the fluorescence variation. A mean decrease of 30.63 ± 4.90% of the current elicited by 30 mM of glycine is observed (n = 4). F Left panel: examples of single exponential fitting (red line) of the current (left) and fluorescence (right) traces onset. Right panel: time constants τ (onset) values obtained via single exponential fitting with mean and SEM error bars at different glycine concentrations (n = 3 and 4 for glycine concentrations under 25 μM and n = 5 for other concentrations). Unpaired two-sided student t-test indicates the significance of the difference between fluorescence and current onset (**P < 0.005; ***P < 0.0005).
Fig. 3
Fig. 3. Effect of N46D/N61D mutations on ΔI and ΔF curves of K143W/Q219C on C41V GlyR.
A Side view of zebrafish α1 glycine receptor structure in Apo state (PDB:6PXD) with details of loops and β-sheets forming the orthosteric site and the localization of N46D/N61D mutations. The glycine molecule is represented in green and N46D/N61D mutated residues (spheres) in black. B Representative VCF recordings of the mutant K143W/Q219C + N46D/N61D (current in black and fluorescence in cyan). C ΔI (cyan) and ΔF (black) dose-response curves with mean ± SEM show a parallel shift of the current and fluorescence curves of the K143W/Q219C/N46D/N64D mutant (solid line; n = 5) compared to K143W/Q219C alone (dotted line).
Fig. 4
Fig. 4. Electrophysiological and fluorescence characterization of partial-agonist (β-alanine and taurine) and propofol effects on K143W/Q219C sensor on C41V GlyR.
A Right panel: Representative VCF recordings on an oocyte challenged with both β-alanine and glycine. Left panel: representative VCF recording on oocytes under the β-alanine application. Right panels: the ΔI (cyan) and ΔF (black) curves (normalized to the glycine maximal response recorded on each individual oocyte) with mean and SEM for K143W/Q219C under glycine (solid line) and β-alanine (dotted line) application. The ΔF curves for both molecules are superimposed but the efficacy of β-alanine to activate the receptor is lower than that of glycine (6.1 ± 2.2% of glycine maximum response in current, n = 6). B Right panel: Representative VCF recordings on an oocyte challenged with both taurine and glycine. Left panel: representative VCF recording in oocytes under the taurine application. Right panel: ΔI (cyan) and ΔF (black) curves (normalized to the glycine maximal response recorded on each individual oocyte) with mean and SEM for K143W/Q219C under glycine (solid line) and taurine (dotted line) application. Taurine elicits only 2.0 ± 1.4% of glycine maximum current, n = 6. C Left panels: Representative VCF recording on an oocyte challenged with maximal glycine concentration in the presence and absence of propofol at 500 μM. Middle panel: representative VCF recording on an oocyte under glycine and propofol co-application. Right panel: ΔI (cyan) and ΔF (black) dose-response curves with mean and SEM for K143W/Q219C under glycine and propofol (solid line, n = 6) and glycine alone (dotted line) application.
Fig. 5
Fig. 5. Differential inhibition of strychnine on fluorescence and current on K143W/Q219C sensor on C41V GlyR.
Upper left panel: Representative VCF recording where the application of strychnine alone at 5 µM triggers a fluorescence dequenching. Upper right panels: glycine is applied at different concentrations first alone (green bar) and then in a mixture with 5 µM strychnine (red bar plus green bar), showing differential strychnine-elicited inhibition of current and fluorescence depending on the glycine concentration (n = 5). Lower panel: fluorescence (cyan) and current (black) variations normalized to the fluorescence and current variations under 10 mM of glycine (mean and SEM (n = 5)). “ns” denotes that the ΔF (under glycine) and ΔF (under strychnine inhibition) are not significantly different; P < 0.05 (Unpaired two-sided student t-test).
Fig. 6
Fig. 6. Characterization of R271C by VCF on C41V GlyR.
A Localization of the R271C mutation on the GlyR compared to the sensor K143W/Q219C (PDB:6PXD). B Upper panel: ΔI (cyan) and ΔF (black) dose-response curves (normalized to the glycine maximal response recorded on each individual oocyte) with mean and SEM error bars for R271C under glycine (solid line) and taurine (dotted line) application. Taurine elicits only 5.4 ± 2.3% of glycine maximum current, n = 5. Lower panel: ΔI (cyan) and ΔF (black) dose-response curves normalized to the maximum value with mean and SEM error bars for R271C under the taurine application.
Fig. 7
Fig. 7. Dynamic “personality” of the tau-closed state.
A Root-mean-square fluctuations (RMSF) from the average structure extracted from 0.5 µs MD simulations in explicit solvent/membrane are shown for three conformational states of GlyR captured by cryo-EM. Apo-closed corresponds to the resting state and tau-open to the active state of the receptor. For each state, RMSF values ranging from 0.5 to 4.5 Å are shown by the color (from blue to red) and the thickness (from thin to thick) of the sausage representation (B). State-based docking of strychnine. The boxplot defines the center at the median (red line) and mean (yellow dashed line), minima and maxima are indicated by whiskers, and the box represents data between the first and third quartiles. Relative strychnine-binding affinities for apo-closed, tau-closed, and tau-open was probed by docking strychnine to an ensemble of 500 protein snapshots sampled by MD and comparing the success rate of docking; i.e., a docking experiment was considered as successful if the docking score was within 10% of the score obtained in the strychnine-bound X-ray structure (stry-closed). The mean (yellow) or median (red) dashed lines show that strychnine binding in tau-closed is significantly stronger than in tau-open.
Fig. 8
Fig. 8. Hypothetical transition pathway of the GlyR.
Left panel: side-view cartoon representation of two subunits of the GlyR. C loop contributing to the orthosteric site, the quenching sensor, the TAMRA (hexagon), and tryptophane (indole) are represented. Upper panel: top view representation of the receptor in different conformations with the ECD of each subunit shown in a circle and C loop as a line. Lower panel: top view representation of the TMD showing the M2 helices and the L9’ that closes the pore in the resting and intermediate(s) conformations. The black circle represents positions where the fluorescent-quenching sensor is grafted. The indole goes closer to the TAMRA from the resting to the intermediate(s) conformations, generating a quenching of fluorescence.

References

    1. Nemecz Á, Prevost MS, Menny A, Corringer P-J. Emerging molecular mechanisms of signal transduction in pentameric ligand-gated ion channels. Neuron. 2016;90:452–470. doi: 10.1016/j.neuron.2016.03.032. - DOI - PubMed
    1. Cecchini M, Changeux J-P. The nicotinic acetylcholine receptor and its prokaryotic homologues: structure, conformational transitions & allosteric modulation. Neuropharmacology. 2015;96:137–149. doi: 10.1016/j.neuropharm.2014.12.006. - DOI - PubMed
    1. Cecchini M, Changeux J-P. Nicotinic receptors: from protein allostery to computational neuropharmacology. Mol. Asp. Med. 2022;84:101044. doi: 10.1016/j.mam.2021.101044. - DOI - PubMed
    1. Indurthi DC, Auerbach A. Agonist efficiency from concentration-response curves: structural implications and applications. Biophys. J. 2021;120:1800–1813. doi: 10.1016/j.bpj.2021.02.034. - DOI - PMC - PubMed
    1. Edelstein SJ, Changeux J-P. Relationships between structural dynamics and functional kinetics in oligomeric membrane receptors. Biophys. J. 2010;98:2045–2052. doi: 10.1016/j.bpj.2010.01.050. - DOI - PMC - PubMed

Publication types