. 2023 Jul;19(7):805-814.
doi: 10.1038/s41589-022-01247-5. Epub 2023 Feb 13.

Structural basis of efficacy-driven ligand selectivity at GPCRs

Affiliations

Structural basis of efficacy-driven ligand selectivity at GPCRs

Alexander S Powers et al. Nat Chem Biol. 2023 Jul.

Erratum in

Abstract

A drug's selectivity for target receptors is essential to its therapeutic utility, but achieving selectivity between similar receptors is challenging. The serendipitous discovery of ligands that stimulate target receptors more strongly than closely related receptors, despite binding with similar affinities, suggests a solution. The molecular mechanism of such 'efficacy-driven selectivity' has remained unclear, however, hindering design of such ligands. Here, using atomic-level simulations, we reveal the structural basis for the efficacy-driven selectivity of a long-studied clinical drug candidate, xanomeline, between closely related muscarinic acetylcholine receptors (mAChRs). Xanomeline's binding mode is similar across mAChRs in their inactive states but differs between mAChRs in their active states, with divergent effects on active-state stability. We validate this mechanism experimentally and use it to design ligands with altered efficacy-driven selectivity. Our results suggest strategies for the rational design of ligands that achieve efficacy-driven selectivity for many pharmaceutically important G-protein-coupled receptors.


Conflict of interest statement

C.C.F. and S.M.P. are employees of and hold equity in Karuna Therapeutics. A.C. and P.M.S. are co-founders of Septerna, Inc. A.C., P.M.S. and R.O.D. hold equity in Septerna, Inc.

Figures
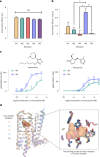
Fig. 1
Fig. 1. Xanomeline shows significant differences in efficacy, but not affinity, between mAChR subtypes.
a, Xanomeline has nearly identical affinity at all mAChR subtypes, as determined by radioligand binding competition with [3H]N-methylscopolamine ([3H]NMS). Data are expressed as the mean ± s.e.m. from a single fit to grouped data from n biologically independent experiments, where n = 3, 4, 3, 5 and 3 for M1, M2, M3, M4 and M5 mAChRs, respectively. P > 0.05 for all comparisons by two-sided Tukey’s test; NS, not significant. b, A direct measure of ligand efficacy, log (τC), was quantified for xanomeline across subtypes by fitting pERK1/pERK2 signaling data to an operational model of agonism and correcting for receptor expression (Methods). Xanomeline shows a significant difference in log (τC) values between M4 and M2, M3 and M5 (P = 0.045, 0.024 and 0.007, respectively; P > 0.05 for other pairs by two-sided Tukey’s test). Data are expressed as the mean ± s.e.m. from a single fit to grouped data of n experiments, where n = 3, 4, 3, 5 and 3 for M1, M2, M3, M4 and M5, respectively. *P < 0.05; **P < 0.01. c, In pERK1/pERK2 signaling assays, xanomeline’s potency is greater at the M4 mAChR than at the M2 mAChR (Supplementary Table 2). The shift in xanomeline potency (left) is greater than for the control agonist pilocarpine (right), demonstrating xanomeline’s superior selectivity between M2 and M4 mAChRs. Data are plotted as the percentage of fetal bovine serum (FBS) stimulation (mean ± s.e.m.) from n = 6 (M2) and n = 9 (M4) experiments. d, The five human mAChR subtypes have high similarity in sequence and structure. Published crystal structures of the five mAChR subtypes (antagonist bound) are shown. Enlarged image shows that side chains within the orthosteric ligand binding pocket are identical in sequence across the receptors. The antagonist tiotropium is pictured in orange spheres for reference. Source data
Fig. 2
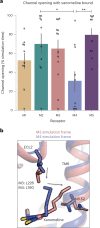
Fig. 2. The binding mode of xanomeline differs between M2 and M4 mAChRs in the active state but not in the inactive state.
a, Dominant binding poses of xanomeline at the inactive state (left) and active state (right) of the M2 (top) and M4 (bottom) mAChRs, as observed in MD simulations. Representative simulation snapshots are shown under each condition. Detailed images are shown on the far right. At the M4 mAChR, a smaller residue on ECL2 (M4: L190; M2: F181) allows xanomeline’s tail to extend vertically toward the extracellular vestibule, which it generally does in the active state. b, MD simulation trajectory showing the opening of a channel between TM5 and TM6 as measured by the distance between the extracellular ends of TM5 and TM6 (Methods). Simulations were initiated from the active-state M2 mAChR structure with xanomeline docked to the orthosteric site. The dashed line indicates the distance in the iperoxo-bound structure. Images show simulation snapshots from the indicated time points. c, In simulations with xanomeline bound to the active state, the TM5/TM6 channel is open much more frequently in the M2 mAChR than in the M4 mAChR (P = 0.027, two-sided Mann–Whitney U-test; n = 10 independent simulations; *P < 0.05). No significant difference between the M2 and M4 mAChRs was observed with xanomeline bound to the inactive state (P = 0.94, n = 3 simulations) or with control agonist iperoxo bound to the active state (P = 0.99, n = 5 and 8 simulations); NS, not significant. Data are presented as means with 68% confidence intervals (68% CIs). Source data
Fig. 3
Fig. 3. Different xanomeline binding poses lead to differing effects on TM helices and activation across receptor subtypes.
a, At mAChRs and most other GPCRs, TM6 undergoes a large conformational change following activation, with the intracellular end of TM6 moving outward to accommodate G-protein binding and the extracellular end of TM6 moving inward toward TM4, as illustrated by experimentally determined structures of the M2 mAChR in inactive (pink) and G-protein-bound active (gray) states. b, Xanomeline causes the extracellular end of TM6 to be in an outward (inactive-like) conformation more often at the M2 mAChR than at the M4 mAChR (P = 0.037, two-sided Mann–Whitney U-test; n = 10 independent simulations; *P < 0.05), whereas no difference was observed with control agonist iperoxo bound (P = 0.64; n = 5 and 8 simulations). Data are presented as means with 68% CIs. c, Channel opening favors outward motion of the extracellular end of TM6, as shown for unliganded simulations of the M2 mAChR in complex with Go (Methods; P = 0.032, two-sided Mann–Whitney U-test; n = 6 simulations; *P < 0.05). Data are presented as calculated percent from all relevant simulation frames with 68% CIs from bootstrapping; NS, not significant. d, In simulations initiated from active-state structures of the M2 and M4 mAChRs with xanomeline docked in an identical initial pose, the extracellular end of TM6 transitions to an inactive-like conformation at the M2 mAChR but not at the M4 mAChR. The plot shows the distance between the extracellular ends of TM6 and TM4 (corresponding to the arrow in the bottom left image) at M2 (green trace) and M4 (purple trace) mAChRs. Dashed horizontal lines show the distances in experimentally determined structures of active and inactive states of the M2 mAChR. Images show representative simulation frames (colored) overlaid on initial active-state structures (gray). Source data
Fig. 4
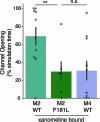
Fig. 4. Binding and mutagenesis experiments validate computational predictions.
a, Addition of purified Gi1, which favors active-state receptor conformations, increases the binding affinity of xanomeline substantially more at the M4 mAChR (top) than at the M2 mAChR (bottom), as shown by competition with the radiolabeled antagonist [3H]NMS for purified, monomeric receptors reconstituted in lipid nanodiscs (+Gi1 corresponds to 100 nM Gi1). Data represent the mean ± s.e.m. from n = 3 independent experiments. Data were normalized to the buffer-only condition with no G protein. b, We determined free energies of relevant states in our model by fitting the data obtained in a to a ternary complex model. Cartoons at the top indicate the state (R, receptor; G, G protein), with the free energy plotted below for M2 and M4 mAChRs. As predicted, xanomeline has similar binding energies at the isolated M2 and M4 mAChRs but very different binding energies at the M2–Gi1 and M4–Gi1 complexes (difference of 5 kcal mol–1). c, The simulation model predicts that xanomeline efficacy differs between M2 and M4 mAChRs due to a sequence difference (leucine versus phenylalanine) on ECL2. The bar plots show efficacy corrected for receptor expression for wild-type (WT) and mutant receptors. The effect of the mutations on xanomeline efficacy aligns with the predictions of our model; F181L (M2) significantly increases efficacy (****P < 0.0001, two-sided Tukey’s test), while L190F (M4) significantly decreases efficacy (***P = 0.0005, two-sided Tukey’s test). The mutations did not significantly affect the control agonist pilocarpine (P = 0.70 WT M4 versus L190F and P = 0.93 WT M2 versus F181L, two-sided Tukey’s test). Data are expressed as means ± s.e.m. from a single fit to grouped data of n = 6 (M2), n = 6 (M2 F181L), n = 9 (M4) and n = 5 (M4 L190F) experiments; NS, not significant. d, In pERK1/pERK2 signaling assays, the mutation F181L (M2) increases xanomeline potency relative to the WT M2 mAChR, making the potency similar to the WT M4 mAChR. Data represent means ± s.e.m. from n = 6 (M2), n = 6 (M2 F181L) and n = 9 (M4) experiments. Source data
Fig. 5
Fig. 5. Rational design of ligands with altered efficacy-driven selectivity.
a, To test our prediction that shortening xanomeline’s aliphatic tail would lead to an increase in ligand efficacy at the M2 mAChR relative to the M4 mAChR, we synthesized a series of xanomeline analogs with tail lengths ranging from three to eight carbons. b, Our model for efficacy-driven selectivity suggests that a three-carbon tail fits better into the smaller active-state M2 mAChR binding site, limiting channel opening and increasing M2 efficacy. As shown in the cartoon diagram, the three-carbon tail would be a poor fit for the more extended active-state pocket at the M4 mAChR, leaving an unfavorable gap between the tail and L181. c, pERK1/pERK2 signaling assays were used to measure efficacy log (τC) of xanomeline analogs with tail lengths ranging from three to eight. As predicted, reduction in xanomeline’s tail length leads to an increase in xanomeline efficacy at the M2 mAChR relative to the M4 mAChR. The three-carbon tail molecule has efficacy-driven selectivity for the M2 mAChR over the M4 mAChR (P = 0.006; two-sided unpaired t-test), while maintaining a similar affinity for both receptors (Supplementary Table 1). Data are expressed as means ± s.e.m. from a single fit to grouped data of n = 4 biologically independent experiments. Source data
Fig. 6
Fig. 6. A similar mechanism explains xanomeline selectivity at other mAChR subtypes.
a, Simulations were run for all five mAChR receptor subtypes in the active state with xanomeline bound. As at the M2 mAChR, the channel between TM5 and TM6 opens more frequently at the M3 and M5 mAChRs than at the M4 mAChR (M1 versus M4: P = 0.51; M2 versus M4: P = 0.048; M3 versus M4: P = 0.080; M5 versus M4: P = 0.008). Data were analyzed by two-sided Tukey’s test; *P < 0.05; **P < 0.01. This pattern aligns with the experimental measurements of xanomeline’s efficacy across subtypes (Fig. 1b); n = 13 (M3) and n = 10 (others) independent simulations for each condition; data are presented as means with 68% CIs. b, The M3 and M5 mAChRs both have a leucine corresponding to L190 (M4), but the leucine is frequently positioned further downward toward the primary binding pocket in simulations of xanomeline-bound M3 and M5 mAChRs, as illustrated here by an overlay of M3 and M4 simulation snapshots. Source data
Extended Data Fig. 1
Extended Data Fig. 1. Xanomeline binds with a similar affinity to both M2 and M4 mAChRs.
Binding assays were performed by titrating xanomeline and measuring competition with radiolabeled [3H]-N-methylscopolamine at each receptor (see Methods). Data points represent the mean ± S.E.M. from N = 4(M2), 5(M4) individual experiments. Source data
Extended Data Fig. 2
Extended Data Fig. 2. Xanomeline has higher efficacy at M4 versus M2 mAChRs in proximal assay of GoA activation.
Concentration-response curve for ACh, xanomeline and pilocarpine in GoA activation assay at the M2 WT (a), M2 F181L (b), M4 WT (c), and M4 L190F (d) mAChRs measured 1.5 min post drug addition. Efficacy parameters quantified and corrected for receptor expression, for xanomeline (e) and pilocarpine (f). Concentration-response curves were similar at 6 min post drug addition at M2 WT (g), M2 F181L (h), M4 WT (i), and M4 L190F (j) mAChRs and for expression-corrected efficacy parameters (k) (l). Data for concentration response curves are the mean ± S.E.M. of 5 experiments performed in duplicate, and normalized to the maximal response induced by ACh (% Emax ACh) in each cell line. Data was analyzed using the operational model of agonism to quantify the efficacy (Logτ) of each agonist in each cell line, and subsequently corrected for receptor expression level differences between cell lines (Logτc), using the M2 WT as reference. Bar plots are expressed as the mean ± S.E.M. from a single fit to grouped data of N = 5 biologically independent experiments. **** indicates P < 0.0001 using one-way ANOVA multiple comparison analysis and Tukey’s multiple comparison test; ns (not significant) indicates P > .05 (Pilocarpine 1.5 min, M2 WT vs. M2 F181L: P = 0.72, M4 WT vs. M4 L190F: P = 0.72, M2 WT vs. M4 WT: P = 0.61, Pilocarpine 6 min, M2 WT vs. M2 F181L: P = 0.16, M4 WT vs. M4 L190F: P = 0.92, M2 WT vs. M4 WT: P = 0.74). Source data
Extended Data Fig. 3
Extended Data Fig. 3. Xanomeline often adopts a different binding pose at the active state of the M2 mAChR compared to M4 mAChR.
The binding pose is similar in the inactive state. Here we quantified the difference in xanomeline conformation relative to the receptor using the position of xanomeline’s alkyl tail during simulations. In each simulation frame, we categorized the tail as a vertical state or horizontal state to get the % time in a vertical state (see Methods). Bars represent the mean value from N independent simulations (M2 vs. M4 active-state P = 0.0032, inactive-state P > 0.05, two-sided Mann-Whitney U-test; N = 10 for active-state simulations and N = 3 for inactive-state simulations; error bars are 68% confidence interval). Source data
Extended Data Fig. 4
Extended Data Fig. 4. Channel opening occurs more frequently at the xanomeline-bound active state M2 than M4 mAChR.
Distance between extracellular ends of TMs 5 and 6 for all xanomeline-bound active-state MD simulations of M2 and M4, illustrating that the channel opens more frequently in M2 than in M4 (see Methods). Distances are shown relative to the initial structure for each simulation (for M2, an experimentally determined structure of the active state; for M4, a template-based model of the active state). Positive values indicate an increase in distance relative to the initial structure. Source data
Extended Data Fig. 5
Extended Data Fig. 5. A residue on extracellular loop 2 (ECL2) is primarily responsible for the differing receptor conformation between xanomeline-bound M2 and M4 mAChRs.
The M4 mAChR has a leucine (L190) at a position corresponding to phenylalanine (F181) of the M2 mAChR. In xanomeline-bound, active-state simulations, mutating residue 181 of the M2 mAChR to leucine reduces the opening frequency of the TM5/6 channel to that observed at the wild-type (WT) M4 mAChR (P = 0.0034 for M2 WT vs. M2 F181L; P > 0.05 for M2 F181L vs. M4 WT; two-sided MWU test; N = 10 independent simulations for WT and N = 6 for M2 F181L). Data presented as mean with 68% CI. Source data

Similar articles

Cited by

References

    1. Huggins DJ, Sherman W, Tidor B. Rational approaches to improving selectivity in drug design. J. Med. Chem. 2012;55:1424–1444. - PMC - PubMed
    1. Campillos M, Kuhn M, Gavin AC, Jensen LJ, Bork P. Drug target identification using side-effect similarity. Science. 2008;321:263–266. - PubMed
    1. Weinstein ZB, et al. Modeling the impact of drug interactions on therapeutic selectivity. Nat. Commun. 2018;9:3452. - PMC - PubMed
    1. Liu H, et al. Structure-guided development of selective M3 muscarinic acetylcholine receptor antagonists. Proc. Natl Acad. Sci. USA. 2018;115:12045–12050. - PMC - PubMed
    1. Wang Q, MacH RH, Luedtke RR, Reichert DE. Subtype selectivity of dopamine receptor ligands: insights from structure and ligand-based methods. J. Chem. Inf. Model. 2010;50:1970–1985. - PMC - PubMed

Publication types

MeSH terms

LinkOut - more resources