. 2023 Mar;19(3):378-388.
doi: 10.1038/s41589-022-01253-7. Epub 2023 Feb 13.

TMEM164 is an acyltransferase that forms ferroptotic C20:4 ether phospholipids

Affiliations

TMEM164 is an acyltransferase that forms ferroptotic C20:4 ether phospholipids

Alex Reed et al. Nat Chem Biol. 2023 Mar.

Abstract

Ferroptosis is an iron-dependent form of cell death driven by oxidation of polyunsaturated fatty acid (PUFA) phospholipids. Large-scale genetic screens have uncovered a specialized role for PUFA ether phospholipids (ePLs) in promoting ferroptosis. Understanding of the enzymes involved in PUFA-ePL production, however, remains incomplete. Here we show, using a combination of pathway mining of genetic dependency maps, AlphaFold-guided structure predictions and targeted lipidomics, that the uncharacterized transmembrane protein TMEM164-the genetic ablation of which has been shown to protect cells from ferroptosis-is a cysteine active center enzyme that selectively transfers C20:4 acyl chains from phosphatidylcholine to lyso-ePLs to produce PUFA ePLs. Genetic deletion of TMEM164 across a set of ferroptosis-sensitive cancer cell lines caused selective reductions in C20:4 ePLs with minimal effects on C20:4 diacyl PLs, and this lipid profile produced a variable range of protection from ferroptosis, supportive of an important but contextualized role for C20:4 ePLs in this form of cell death.


Conflict of interest statement

Competing Interests

The authors declare no competing financial interests.

Figures

Extended Data Fig. 1
Extended Data Fig. 1. Characterization of sgTMEM164 786-O cells
a, b, Confirmation of genetic alterations in 786-O cells at sgRNA sites targeted with (a) sgTMEM164-1 and (b) sgTMEM164-2 by next-generation sequencing analysis. c, d, Genetic deletion of TMEM164 in 786-O cells results in reduced sensitivity to ferroptosis induced by the GPX4 inhibitors ML210 (c) and RSL3 (d) measured at 24 h post-treatment with GPX4 inhibitors. Data represent mean values ± S.E.M. from two independent experiments.
Extended Data Fig. 2
Extended Data Fig. 2. Targeted lipidomic (LC-MS/MS) methods for measuring ePLs
a, b, Detection of endogenous ePE-P(C18:0/C20:4) in 786-O cells by LC-MS/MS (a) and comparison to commercial ePE-P(C18:0/C20:4) standard (b). Left traces show extracted ion chromatogram of a feature corresponding to ePE-P(C18:0/C20:4) (750.5 → 303.3). Right traces show MS2 spectra for ePE-P(C18:0/C20:4). c,d, Targeted LC-MS/MS analysis of isobaric ePE-O and ePE-P species performed as described in the Methods section revealing that they are separated by approximately 1.5 min difference in retention time. Treatment of lipid extracts from 786-O cells with 10% (v/v) formic acid (c) or HCl (3N) (d) for 30 min at 37°C reveals ePE-P elutes after ePE-O as evidenced by a significant reduction in the ePE-P peak following HCl treatment. AUC, area under the curve.
Extended Data Fig. 3
Extended Data Fig. 3. Alterations in ePC and diacyl PC production in TMEM164-deficient cells
a, b ePC (a) and PC (b) lipid measurements in sgCtrl and sgTMEM164 786-O cells. For a, due to technical limitations we did not distinguish between ePC-O and ePC-P lipids. Data represent mean values ± S.E.M from four independent experiments per group. P-values were derived using a Two-sided Student’s t-test performed relative to sgCtrl cells; only shown for lipids where sgCtrl and parental (WT) data did not differ.
Extended Data Fig. 4
Extended Data Fig. 4. Measurement of free fatty acids (FFAs), eLPE, and LPE in TMEM164-deficient cells
FFA (a), eLPE (b) and LPE (c) lipid measurements in sgCtrl and sgTMEM164 786-O cells. Data represent mean values ± S.E.M from four independent experiments per group. P-values were derived using a Two-sided Student’s t-test performed relative to sgCtrl cells.
Extended Data Fig. 5
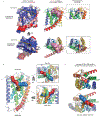
Extended Data Fig. 5. Integrated homology mapping and AlphaFold2 analysis identifies a predicted shared structure between TMEM164 and the AIG1/ADTRP lipid hydrolases
a, Structure-based sequence alignment by DALI of AlphaFold2 models (http://alphafold.ebi.ac.uk) of the H.sapiens (UniProt Q5U3C3) and D.melanogaster (UniProt Q7JRB2) TMEM164 proteins, with representative proteins from the AIG1/ADTRP family (H.sapiens (Q9NVV5); S.cerevisiae (P38842)), prokaryotic YwaF (S.pneumoniae (Q8CYG1); B.subtilis (P25149)) and YpjA proteins (S.aureus (Q2FYH4); A.venificus (F2KNL0)), and GPC1 enzymes (S.cerevisiae (P48236); A.thaliana (Q9FJB4). In some cases, models were built with ColabFold implementation of AlphaFold2 (http://github.com/sokrypton/ColabFold). The alignment was displayed and analyzed with Jalview (http://jalview.org), showing the six blocks of conserved structure corresponding to TM helices 1–6. Length and sequence-variable gaps in the alignment corresponding to loops in the superposed folds were abbreviated by residue stretches in parentheses. Positions of the variable nucleophile and invariant His residues (Cys123 and His181 in human TMEM164, respectively) are boxed and labeled. b, DALI-derived superpositions provide a measure of structural relatedness for the six main branches of the enzyme superfamily displayed in the phylogenetic hypertree in Fig. 4c (http://kinase.com/tools/HyperTree.html), with chains aligned in panel a noted by red circles. Z-score of 8.2 is provided for the most distant branch (YpjA). c, Matrix of DALI Z-scores displaying the clusters of more closely related AlphaFold2-derived structures from all-against-all superpositions performed with the DALI server (http://ekhidna2.biocenter.helsinki.fi), leading to reconstitution of the six branches of the enzyme superfamily. Five of these clusters have sequence alignments that can be retrieved from the PFAM database (http://pfam.xfam.org): TMEM164 (PF14808), AIG1/ADTRP (PF04750), GPC1 (PF10998), YwaF (PF09529) and YpjA (PF7187). d, Tube representations of aligned AlphaFold2 models showing positions of the catalytic dyad with black Ca spheres and preservation of the core 6TM fold (color-ramped from blue TM1 to red TM6) with N-or C-terminal extensions drawn in grey. Figures composed with PyMOL (http://pymol.org).
Extended Data Fig. 6
Extended Data Fig. 6. AlphaFold2 analysis of TMEM164 active site cavity
a, The human TMEM164 structural model was processed by the ConSurf server (http://consurf.tau.ac.il) to map the sequence conservation profile of its underlying family to the 3D fold surface color-ramped from blue (conserved) to red (variable) patches. For side and top views, the ConSurf surfaces are aligned to the ribbon model of TMEM164 embedded with the CavityPlus-calculated volume in pink (server at http://pkumdl.cn), showing the positions of predicted portals to the lipid bilayer. In addition, the CavPharmer tool at CavityPlus was used to predict a pharmacophore skeleton for a prospective ligand (which could represent the lipid substrates or product of the enzymatic reaction) for TMEM164, showing a shape and chemical nature in agreement with a predicted function as a C20:4-preferring lyso-ePL acyltransferase. b, The program CAVER (https://loschmidt.chemi.muni.cz/caverweb) was used to visualize the tunnels leading from the central TMEM164 cavity that abuts the Cys123/His181 predicted catalytic dyad (shown in black stick format), to the portals that open to the lipid bilayer (tunnels 1 and 3, respectively in blue and orange, with lengths 12.8 Å and 16.7 Å) and to the outer leaflet of the membrane (tunnels 2 and 4, respectively in red and green, both with lengths of 15.1 Å). c, A top view of the six-transmembrane core of TMEM164 with docked C20:4 ePE, with acyl chains occupying tunnels 1 and 3, and head group cresting into the tunnel 2 space. Tunnels 1 and 3 may represent the principal entrance and exit routes for substrates and product, that place the headgroup in proximity of the active site.
Extended Data Fig. 7
Extended Data Fig. 7. Characterization of C20:4 PC-dependent acyltransferase activity of TMEM164
a, Western blot of membrane lysates from sgCtrl and sgTMEM164-2 786-O cells recombinantly expressing C-terminally FLAG-tagged WT-TMEM164 or a C123A-TMEM164 mutant. WT-TMEM164 lysates were serially diluted with mock lysate to identify a dilution (1:1) that matched the expression of C123A-TMEM164. Data are from a single experiment representative of two independent experiments. b, Membrane lysates from sgCtrl or sgTMEM164 786-O cells were treated with N-ethylmaleimide (NEM; 200 µM, 60 min) prior to exposure to diacyl PC(C18:0/C20:4-d8) and lyso-ePE-P(C18:0) substrates and measurement of ePE-P(C18:0/C20:4-d8) product. c, d, Measurement of (c) ePE-P(C18:0/C20:4-d8) and (d) diacyl PE(C17:1/C20:4-d8) formation in membrane lysates from sgCtrl and sgLPCAT3 786-O cells using diacyl PC(C18:0/C20:4-d8) and ePE-P(C18:0) or LPE(C17:1) as donor and acceptor substrate, respectively. For b-d, membrane lysates (1 µg/µL) were treated with 50 µM each of donor and acceptor substrates for 1 h at 37° C prior to analysis. For b-d data represent mean values ± S.E.M from three independent experiments per group. P-values were derived using a Two-sided Student’s t-test performed relative to sgCtrl cells.
Extended Data Fig. 8
Extended Data Fig. 8. Characterization of sgTMEM164-C123Y base-edited cells
a, Confirmation of base-editing of TMEM164 genomic DNA in 786-O cells at the sgRNA target site for sgTMEM164-C123Y base-edited cell population by next-generation sequencing analysis. b, Measurement of C20:4 (left) and additional (right) ePE-O lipids in sgCtrl and sgTMEM164-C123Y base-edited cell populations. c, Measurement of diacyl PE lipids in sgCtrl and sgTMEM164-C123Y base-edited 786-O cell populations. d, Cell viability of sgCtrl and sgTMEM164-C123Y base-edited cell populations treated with the indicated concentrations of the GPX4 inhibitor RSL3 measured at 24 h post-treatment. For b and c data represent mean values ± S.E.M from four independent experiments per group. For d, data represent mean values ± S.E.M. from two independent experiments. P-values were derived using a Two-sided Student’s t-test performed relative to sgCtrl cells.
Extended Data Fig. 9
Extended Data Fig. 9. C20:4 PE and non-C20:4 ePE-P measurements in TMEM164-deficient RKN and ES-2 cells
a, b, Measurement of C20:4 PE lipids in sgCtrl and sgTMEM164-2 RKN (a) and ES-2 (b) cell lines. c, d, Measurement of non-C20:4 ePE-P lipids in sgCtrl and sgTMEM164-2 RKN (c) and ES-2 (d) cell lines. Data represent mean values ± S.E.M from four independent experiments per group. P-values were derived using a Two-sided Student’s t-test performed relative to sgCtrl cells.
Extended Data Fig. 10
Extended Data Fig. 10. TMEM164 catalytic mechanism of action
Proposed catalytic mechanism for C20:4 PL-dependent acyltransferase activity of TMEM164. LPC, lysophosphatidylcholine.
Figure 1.
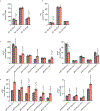
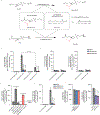
Figure 1.. A role for TMEM164 in the regulation of C20:4 ether lipids.
a, Cancer dependency map analysis of TMEM164 showing the genes with the top-40 highest co-dependency scores. Blue and red designate genes involved in C20:4 and ePL metabolism, respectively. b, GO enrichment analysis of the top 40 co-dependency genes with TMEM164. c, Depiction of the location of C20:4 lipid metabolic genes ACSL4 (red) and LPCAT3 (blue) in the relative rank order of the top 100 co-dependencies for TMEM164 versus established ePL-related genes FAR1, AGPS, GNPAT, and TMEM189. Note that LPCAT3 was only found in the top-100 co-dependencies for TMEM164. d, Volcano plot of targeted lipidomic analysis comparing ether PE (ePE) lipids in sgCtrl and sgTMEM164 786-O cells. Data represent mean values from four independent experiments for sgCtrl and sgTMEM164-1 cells. e, f, C20:4 ePE-P (e) and ePE-O (f) lipid measurements in parental (WT), sgCtrl, and sgTMEM164 786-O cells. Two independently generated sgTMEM164 cell populations were analyzed (−1 and −2). g, h, Additional ePE-P (g) and ePE-O (h) lipid measurements in WT, sgCtrl, and sgTMEM164 786-O cells. i, Diacyl PE lipid measurements in WT, sgCtrl, and sgTMEM164 786-O cells. For e-i, data represent mean values ± S.E.M from four independent experiments per group. P-values were derived using a Two-sided Student’s t-test performed relative to sgCtrl cells.
Figure 2.
Figure 2.. Impaired incorporation of C20:4 (arachidonic acid (AA))-d8 into ePE lipids in TMEM164-deficienct cells.
a-c, Measurement of AA-d8 incorporation into C20:4 (a) ePE-P, (b) ePE-O and (c) diacyl PE lipid species in sgCtrl and sgTMEM164 786-O cells. d, e, Measurement of oleic acid (OA; C18:1)-d9 incorporation into C18:1 (d) ePE-P and (e) ester PE lipid species in sgCtrl and sgTMEM164 786-O cells. For a-e, cells were treated with 25 µM of AA-d8 or OA-d9 for 4 h prior to lipid measurements. Data represent mean values ± S.E.M from three-four independent experiments per group. P-values were derived using a Two-sided Student’s t-test performed relative to sgCtrl cells.
Figure 3.
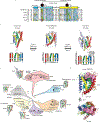
Figure 3.. Integrated homology mapping and AlphaFold2 analysis identifies a predicted shared structure between TMEM164 and the AIG1/ADTRP lipid hydrolases.
a, DALI superposition of the AlphaFold2-predicted structures of human (H.sapiens; Hs) and D. melanogaster (Dm) TMEM164 reveals a catalytic dyad of C123 and H181 in the human chain (respectively on TM helices 2 and 4 of the conserved 6TM fold) that aligns with the Thr/His dyad of AIG1-class FAHFA hydrolases (from H.sapiens and S. cerevisiae (Sc)), and defines a superfamily of nucleophile-variable/His-invariant enzymes that share a conserved membrane topology with otherwise sparse sequence identity. Prokaryotic YwaF and YpjA enzymes respectively include S.pneumoniae (Sp) and B.subtilis (Bs), and S.aureus (Sa) and A.ventificus (Av) proteins, while GPC1 enzymes are drawn from S.cerevisiae and A.thaliana (At). See Extended Data Fig. 5 for a more complete sequence alignment. b, Fold and topology comparison of human TMEM164 with human AIG1 and yeast GPC1 enzymes highlighting a 6TM core fold (with helices 1–6 color-ramped to match the topology diagrams; additional helices in grey) with active site Cys or Thr nucleophiles in blue TM2, placed opposite to the invariant His in yellow TM4 (sidechains in black stick format). Z-scores and RMSD values (in Å) for comparison of TMEM164 and AIG1 or GPC1 AlphaFold2 models are provided. c, Evolutionary tree of the AIG1/TMEM164/GPC1/YwaF/YpjA (or ATGY) superfamily drawn by DALI-derived fold similarity with variable nucleophilic residues noted in each branch. Black circles mark sequences present in the abridged alignment in a. d, CavityPlus analysis of the human TMEM164 6TM core showing an internal cavity (with predicted portals to the lipid bilayer) that abuts the C123/H181 catalytic dyad (in black stick form). Figures drawn with Jalview (http://jalview.org) and PyMOL (http://pymol.org).
Figure 4.
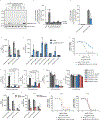
Figure 4.. TMEM164 acts as a C20:4-PL-dependent acyltransferase that generates C20:4-ePE lipids.
a, Diagram of CoA-dependent or C20:4-phospholipid (PL)-dependent acyltransferase reactions responsible for generating C20:4 (e)PE lipids. b, Measurement of the formation of ePE-P(C18:0/C20:4-d8/d11) from diacyl PC(C18:0/C20:4-d8) or PE(C18:0/C20:4-d11) and lyso-ePE-P(C18:0) as donor and acceptor substrates, respectively, assayed with membrane lysates from sgCtrl and sgTMEM164 786-O cells. c, Measurement of the formation of ePE-P(C18:0/C18:0-d35/d5) from diacyl PC(C18:0/C18:0-d35) or PE(C18:0/C18:1-d5) and lyso-ePE-P(C18:0) as donor and acceptor substrates, respectively, assayed with membrane lysates from sgCtrl and sgTMEM164 786-O cells. d, Measurement of the formation of ePE-P(C18:0/C20:4-d8) from diacyl PC(C18:0/C20:4-d8) and lyso-ePE-P(C18:0) from membrane lysates of sgCtrl and sgTMEM164-2 786-O cells engineered to recombinantly express FLAG-tagged WT-TMEM164 or a C123A-TMEM164 mutant. The cell lysates containing WT-TMEM164 were diluted 1:1 with mock lysate to normalize expression to the C123A-TMEM164 mutant (see Extended Data Fig. 7a). e, Measurement of the formation of diacyl PE(17:1/20:4-d8) from diacyl PC(C18:0/C20:4-d8) and LPE(C17:1) as donor and acceptor substrates, respectively, assayed with membrane lysates from sgCtrl and sgTMEM164 786-O cells. f, Measurement of the formation of diacyl PE(C17:1/C20:4) using C20:4-CoA and LPE(C17:1) as donor and acceptor substrates, respectively, assayed with membrane lysates from sgCtrl, sgTMEM164, and sgLPCAT3 786-O cells. For b-f, membrane lysates (1 µg/µL) were treated with 50 µM each of donor and acceptor substrates for 1 h at 37° C prior to analysis. Data represent mean values ± S.E.M from three independent experiments per group. P-values were derived using a Two-sided Student’s t-test performed relative to sgCtrl cells unless otherwise indicated.
Figure 5.
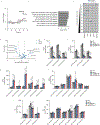
Figure 5.. Characterization of the enzymatic activity and ferroptosis contributions of TMEM164.
a, Western blot of membrane lysates from HEK293T cells expressing C-terminally FLAG-tagged WT-TMEM164 or C123X-TMEM164 mutants. b, c, Measurement of the formation of ePE-P(C18:0/C20:4-d8) from diacyl PC(C18:0/C20:4-d8) (50 µM) and lyso-e-PE-P(C18:0) (50 µM) as substrates assayed with membrane lysates (1 µg/uL, 1 h incubation at 37° C) from (b) HEK293T cells expressing the indicated TMEM164 proteins or (c) sgCtrl and sgTMEM164-C123Y based-edited 786-O cell populations. d, e, Measurement of C20:4 ePE-P (d) and additional ePE-P (e) lipids in sgCtrl and sgTMEM164-C123Y base-edited 786-O cell populations. f, Viability of sgCtrl and sgTMEM164-C123Y base-edited 786-O cell populations treated with the indicated concentrations of ML210 measured at 24 h post-treatment. g, h, Oxidized (g) and non-oxidized (h) PE(C18:0/C20:4) and ePE-P(C18:0/2C0:4) lipid measurements in sgCtrl and sgTMEM164 786-O cells treated with ML210 for 2 h. sgCtrl: ML210 + Liproxstatin-1 group was pre-treated with the ferroptosis-blocking compound Liproxstatin-1 (0.5 µM) for 2 h prior to ML210 treatment. i, j, C20:4 ePE lipid measurements in sgCtrl and sgTMEM164 RKN (i) and ES-2 (j) cell lines. k,l, Viability of sgCtrl and sgTMEM164 RKN (k) and ES-2 (l) treated with indicated concentration of ML210 measured at 24 h post-treatment. For b and c data represent mean values ± S.E.M from three independent experiments per group. For d-e and g-j, data represent mean values ± S.E.M from four independent experiments per group. *p< 0.01, ** p < 0.001 (Two-sided Student’s t-test performed relative to sgCtrl cells). For f, k and l, data represent mean values ± S.E.M. from two independent experiments. For b,c, d-e and g-j P-values were derived using a Two-sided Student’s t-test performed relative to sgCtrl cells.
Figure 6.
Figure 6.. TMEM164 bridges C20:4 diacyl PL and ePL biosynthesis.
Metabolic pathway diagram describing how TMEM164 links C20:4-diacyl PL and ePE lipids. C20:4 and ePL enzymes showing co-dependency with TMEM164 are highlighted in blue and red, respectively. FA, fatty acid.

Similar articles

Cited by

References

    1. van Meer G, Voelker DR & Feigenson GW Membrane lipids: where they are and how they behave. Nat Rev Mol Cell Biol 9, 112–124 (2008). https://doi.org:10.1038/nrm2330 - DOI - PMC - PubMed
    1. Yang WS et al. Peroxidation of polyunsaturated fatty acids by lipoxygenases drives ferroptosis. Proc Natl Acad Sci U S A 113, E4966–4975 (2016). https://doi.org:10.1073/pnas.1603244113 - DOI - PMC - PubMed
    1. Stockwell BR et al. Ferroptosis: A Regulated Cell Death Nexus Linking Metabolism, Redox Biology, and Disease. Cell 171, 273–285 (2017). https://doi.org:10.1016/j.cell.2017.09.021 - DOI - PMC - PubMed
    1. Yang WS et al. Regulation of ferroptotic cancer cell death by GPX4. Cell 156, 317–331 (2014). https://doi.org:10.1016/j.cell.2013.12.010 - DOI - PMC - PubMed
    1. Eaton JK et al. Selective covalent targeting of GPX4 using masked nitrile-oxide electrophiles. Nat Chem Biol 16, 497–506 (2020). https://doi.org:10.1038/s41589-020-0501-5 - DOI - PMC - PubMed

Methods-only References

    1. Cajka T, Smilowitz JT & Fiehn O Validating Quantitative Untargeted Lipidomics Across Nine Liquid Chromatography-High-Resolution Mass Spectrometry Platforms. Anal Chem 89, 12360–12368 (2017). https://doi.org:10.1021/acs.analchem.7b03404 - DOI - PubMed
    1. Koch J et al. Unequivocal Mapping of Molecular Ether Lipid Species by LC-MS/MS in Plasmalogen-Deficient Mice. Anal Chem 92, 11268–11276 (2020). https://doi.org:10.1021/acs.analchem.0c01933 - DOI - PMC - PubMed
    1. Huang TP, Newby GA & Liu DR Precision genome editing using cytosine and adenine base editors in mammalian cells. Nat Protoc 16, 1089–1128 (2021). https://doi.org:10.1038/s41596-020-00450-9 - DOI - PubMed
    1. Clement K et al. CRISPResso2 provides accurate and rapid genome editing sequence analysis. Nat Biotechnol 37, 224–226 (2019). https://doi.org:10.1038/s41587-019-0032-3 - DOI - PMC - PubMed

Publication types

MeSH terms