. 2023 Feb 13;13(1):2565.
doi: 10.1038/s41598-023-29617-6.

ATR-FTIR spectroscopy of plasma supported by multivariate analysis discriminates multiple sclerosis disease

Affiliations

ATR-FTIR spectroscopy of plasma supported by multivariate analysis discriminates multiple sclerosis disease

Maria Caterina Crocco et al. Sci Rep. .

Abstract

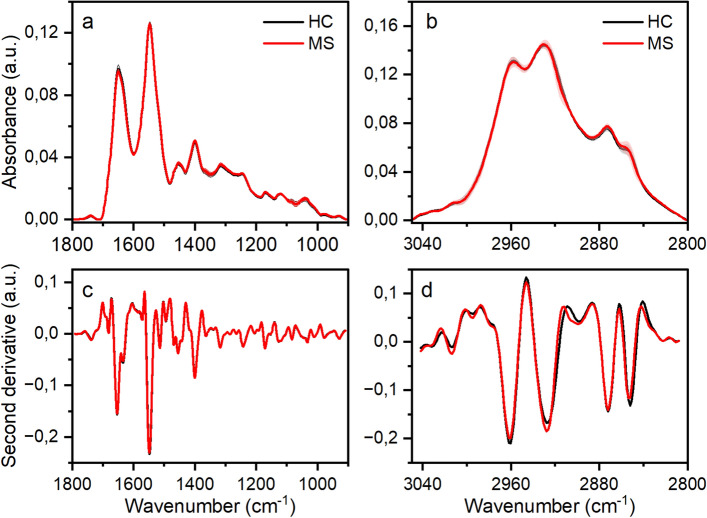
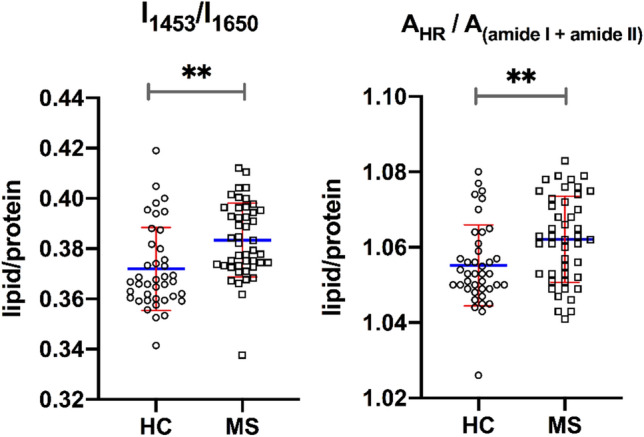
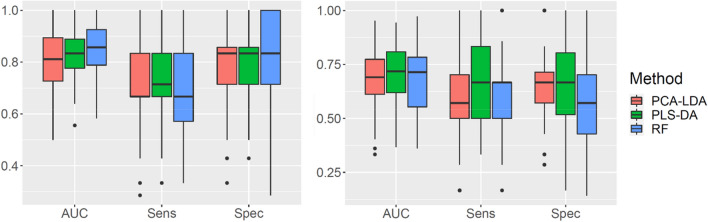
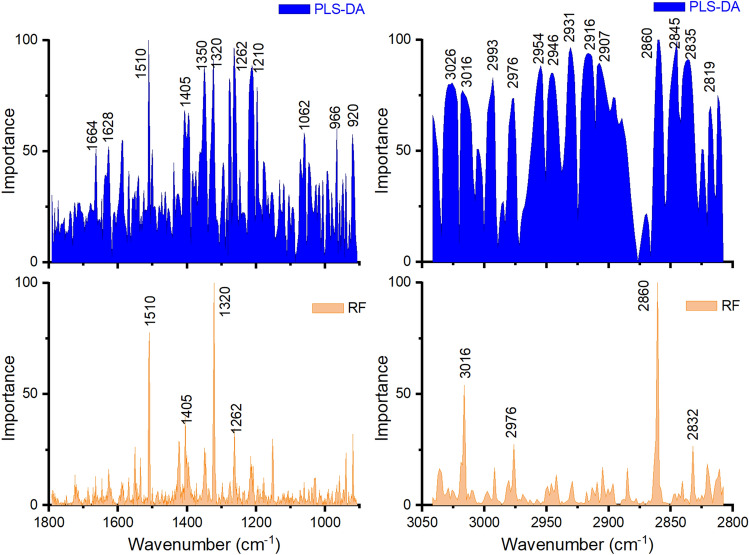
Multiple sclerosis (MS) is one of the most common neurodegenerative diseases showing various symptoms both of physical and cognitive type. In this work, we used attenuated total reflection Fourier transformed infrared (ATR-FTIR) spectroscopy to analyze plasma samples for discriminating MS patients from healthy control individuals, and identifying potential spectral biomarkers helping the diagnosis through a quick non-invasive blood test. The cohort of the study consists of 85 subjects, including 45 MS patients and 40 healthy controls. The differences in the spectral features both in the fingerprint region (1800-900 cm-1) and in the high region (3050-2800 cm-1) of the infrared spectra were highlighted also with the support of different chemometric methods, to capture the most significant wavenumbers for the differentiation. The results show an increase in the lipid/protein ratio in MS patients, indicating changes in the level (metabolism) of these molecular components in the plasma. Moreover, the multivariate tools provided a promising rate of success in the diagnosis, with 78% sensitivity and 83% specificity obtained through the random forest model in the fingerprint region. The MS diagnostic tools based on biomarkers identification on blood (and blood component, like plasma or serum) are very challenging and the specificity and sensitivity values obtained in this work are very encouraging. Overall, the results obtained suggest that ATR-FTIR spectroscopy on plasma samples, requiring minimal or no manipulation, coupled with statistical multivariate approaches, is a promising analytical tool to support MS diagnosis through the identification of spectral biomarkers.


Conflict of interest statement

The authors declare no competing interests.

Figures

Figure 1
Figure 1
ATR-FTIR average spectra, recorded at 25 °C, of plasma samples from 40 HC (black line) and 45 MS (red line) subjects. Mean absorbance spectra in the (a) fingerprint region, 1800–900 cm−1 and (b) high region, 3050–2800 cm−1. In the (c, d) panels are shown the second derivative vector normalized spectra.
Figure 2
Figure 2
Lipid/protein ratio for HC and MS groups, obtained by taking the ratio of the intensity of the peaks at 1453 cm−1 to the amide I at 1650 cm−1 or the ratio of the areas under the high region (3050–2800 cm−1) and the sum under the amide I and amide II bands. The blue lines represent the mean values and the red lines the standard deviation. The degree of significance of the comparison between HC and MS is indicated as **p < 0.01.
Figure 3
Figure 3
Boxplot of the area under the curve (AUC), sensitivity (Sens) and specificity (Spec) for the repeated k-fold cross-validation data, referred to the second derivative spectra in the two spectral regions: 1800–900 cm−1 (left panel) and 3050–2800 cm−1 (right panel). Box stretches from lower hinge (first quartiles Q1) to upper hinge (third quartiles Q3). Median is shown as a line across each box. The outliers, defined as values lower that Q1 − 1.5*IQR or upper than Q3 + 1.5*IQR, where IQR is the interquartile range, are shown as black dots. Vertical solid lines (whiskers) show the lower and upper values, excluding outliers.
Figure 4
Figure 4
Performance measurement of the chemometric methods as described by a smoothed ROC curve considering the 1800–900 cm−1 (left panel) and 3050–2800 cm−1 (right panel) spectral regions.
Figure 5
Figure 5
Wavenumbers importance profiles for the discrimination of HC from MS subjects by using the PLS-DA and RF methods on the second derivative spectra.

References

    1. Reich DS, Lucchinetti CF, Calabresi PA. Multiple sclerosis. N. Engl. J. Med. 2018;378:169–180. doi: 10.1056/NEJMra1401483. - DOI - PMC - PubMed
    1. GBD 2016 Multiple Sclerosis Collaborators. Global, regional, and national burden of multiple sclerosis 1990–2016: A systematic analysis for the Global Burden of Disease Study 2016. Lancet Neurol.18, 269–285 (2019). - PMC - PubMed
    1. Milo R. Effectiveness of multiple sclerosis treatment with current immunomodulatory drugs. Expert Opin. Pharmacother. 2015;16:659–673. doi: 10.1517/14656566.2015.1002769. - DOI - PubMed
    1. Brownlee WJ, Hardy TA, Fazekas F, Miller DH. Diagnosis of multiple sclerosis: Progress and challenges. Lancet. 2017;389:1336–1346. doi: 10.1016/S0140-6736(16)30959-X. - DOI - PubMed
    1. Solomon AJ, Corboy JR. The tension between early diagnosis and misdiagnosis of multiple sclerosis. Nat. Rev. Neurol. 2017;13:567–572. doi: 10.1038/nrneurol.2017.106. - DOI - PubMed