. 2023 Feb 13;21(1):32.
doi: 10.1186/s12915-023-01532-2.

XY sex determination in a cnidarian

Affiliations

XY sex determination in a cnidarian

Ruoxu Chen et al. BMC Biol. .

Abstract

Background: Sex determination occurs across animal species, but most of our knowledge about its mechanisms comes from only a handful of bilaterian taxa. This limits our ability to infer the evolutionary history of sex determination within animals.

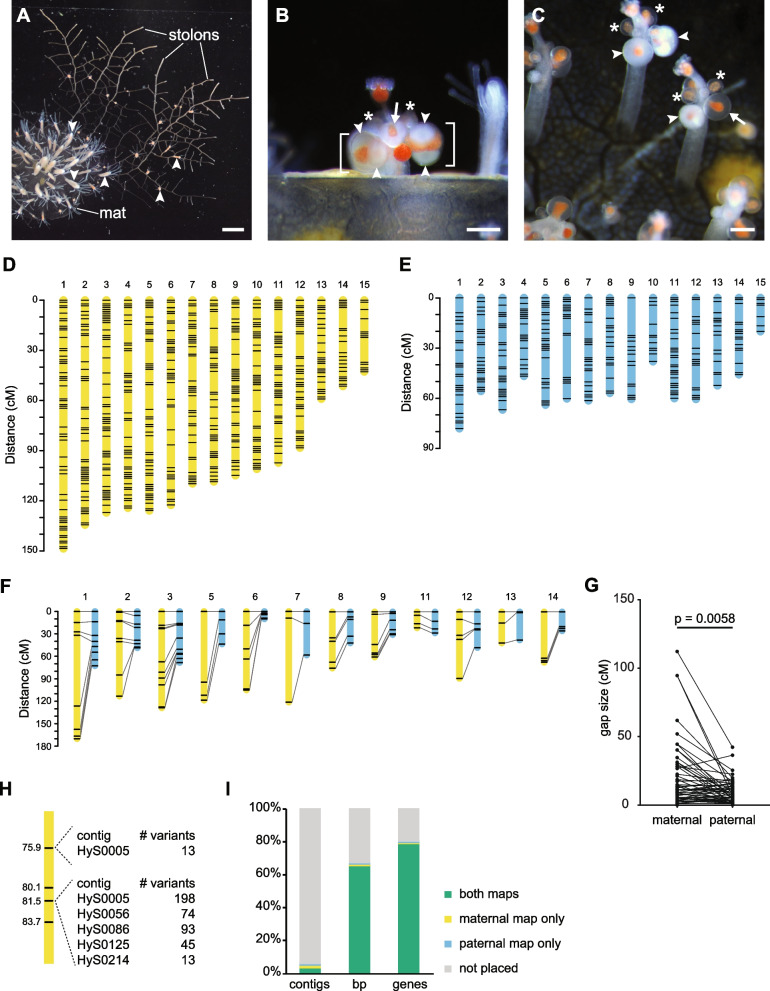
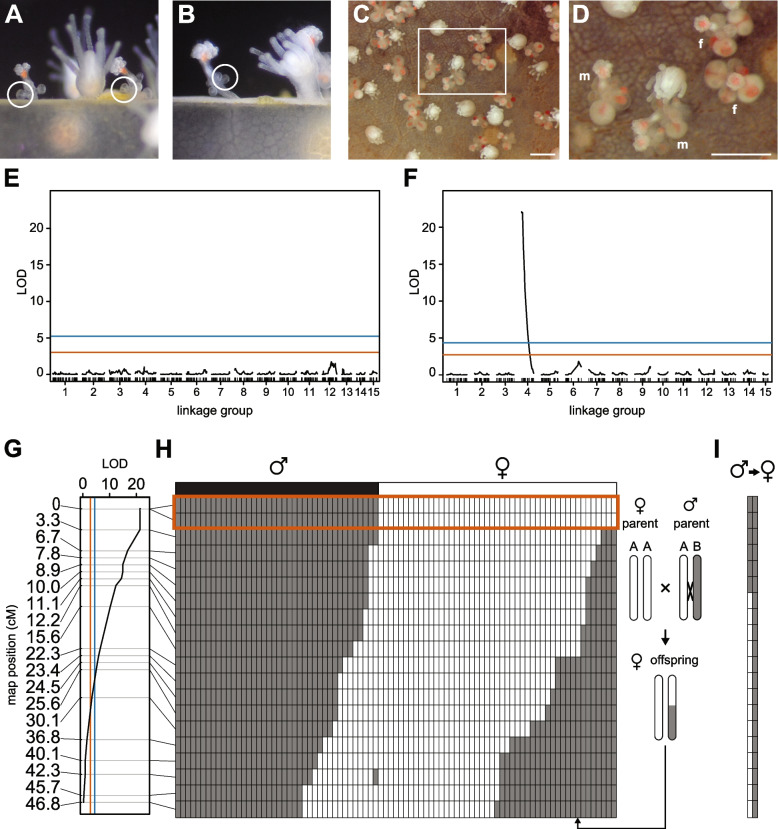
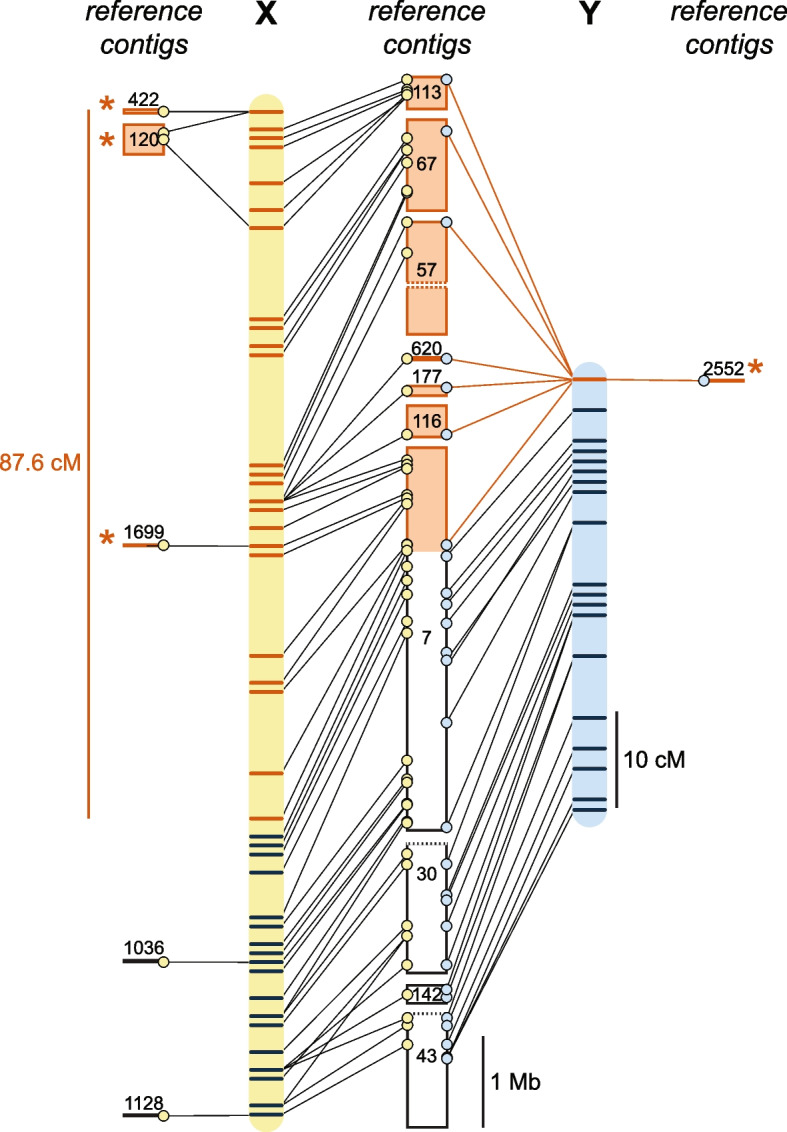
Results: In this study, we generated a linkage map of the genome of the colonial cnidarian Hydractinia symbiolongicarpus and used it to demonstrate that this species has an XX/XY sex determination system. We demonstrate that the X and Y chromosomes have pseudoautosomal and non-recombining regions. We then use the linkage map and a method based on the depth of sequencing coverage to identify genes encoded in the non-recombining region and show that many of them have male gonad-specific expression. In addition, we demonstrate that recombination rates are enhanced in the female genome and that the haploid chromosome number in Hydractinia is n = 15.

Conclusions: These findings establish Hydractinia as a tractable non-bilaterian model system for the study of sex determination and the evolution of sex chromosomes.

Keywords: Depth of coverage; Hydractinia; Linkage map; Pseudo-testcross; Pseudoautosomal region; Sex determination.


Conflict of interest statement

The authors declare that they have no competing interests.

Figures

Fig. 1
Fig. 1
Hydractinia colonies and linkage maps. A An immature Hydractinia colony. Arrowheads indicate gastrozooids. Scale bar ≈ 1 mm. B Female gonozooid with mature gonophores (brackets) and eggs (arrowheads). Asterisks indicate immature gonophores. Scale bar = 200 μm. C Male gonozooids with mature (arrowheads) and immature (asterisks) gonozooids. Arrow indicates nearly mature gonophore. Scale bar = 200 μm. D Maternal linkage map. E Paternal linkage map. F Comparison of markers at equivalent physical locations in maternal and paternal maps. Lines connect markers located within 5 kb of each other in the reference genome. G Comparison of gap sizes in maternal and paternal linkage maps. Gap sizes from equivalent markers are connected by lines. H Example of how markers in the linkage map are bins of multiple variants. This example shows four markers from maternal linkage group 1. The marker at 75.9 cM represents 13 variants from one contig. The marker at 81.5 cM represents 423 variants from five contigs. I Representation of the Hydractinia genome assembly in the maternal and paternal linkage maps. Results are shown as a percent of the total number of contigs, base pairs (bp), or annotated genes
Fig. 2
Fig. 2
XY sex determination in Hydractinia. A Early and late stages of development of female gonozooids. B Early and late stages of development of male gonozooids. C Image of colony 339–116 on the day the first female gonophores were identified. D Close-up of boxed area in C. m, gonozooid bearing male gonophores. f, gonozooid bearing female gonophores. Scale bars in C and D are 1 mm. E LOD chart of QTL for sex in the maternal linkage map. F LOD chart of QTL for sex in the paternal linkage map. (G) Detail of LOD chart for linkage group 4 from the paternal linkage map. In EG, significance thresholds of p = 0.05 and p = 10−5 are denoted in red and blue, respectively. H Recombination map of linkage group 4. Plot depicts genotype segregation pattern of pseudo-testcross markers (rows) in the F1 progeny (columns). Genotypes: AA: white; AB, gray. An example of a recombinant progeny is illustrated to the right of the plot. Observed sex of each F1 progeny is displayed above the plot. Genotypes in red box show perfect correlation with sex phenotype. I Recombination map of linkage group 4 in two animals with sexual chimerism
Fig. 3
Fig. 3
The Hydractinia X and Y linkage groups and sequences. Genomic positions of markers in the maternal (yellow) and paternal (blue) maps of linkage group 4. Regions and markers outlined in orange are located within the non-recombining regions of the X and Y chromosome. Markers indicated in black are in the pseudoautosomal region. Dotted lines indicate contigs 30 and 43 are each probably misassembled from separate linkage groups (see Supplemental Table 2). Asterisks indicate contigs in the non-recombining region that were only placed in one linkage map
Fig. 4
Fig. 4
SATC analysis. A Principal component analysis of variance in depth of coverage between samples. Groups predicted to be homogametic or heterogametic by SATC are indicated with dashed lines. Yellow circles are samples phenotyped as females, blue circles are samples phenotyped as males. B Venn diagram of the number of genes located in the non-recombining region of linkage group 4 (NRR), on SATC-flagged contigs (SATC), or having an unusually low depth of coverage in females. (Diagram created with https://bioinformatics.psb.ugent.be/webtools/Venn/)

References

    1. Capel B. Vertebrate sex determination: evolutionary plasticity of a fundamental switch. Nat Rev Genet. 2017;18:675–689. doi: 10.1038/nrg.2017.60. - DOI - PubMed
    1. Picard MAL, Vicoso B, Bertrand S, Escriva H. Diversity of modes of reproduction and sex determination systems in invertebrates, and the putative contribution of genetic conflict. Genes. 2021;12(8):1136. doi: 10.3390/genes12081136. - DOI - PMC - PubMed
    1. Adolfi MC, Herpin A, Schartl M. The replaceable master of sex determination: bottom-up hypothesis revisited. Philos Trans R Soc Lond B Biol Sci. 2021;376:20200090. doi: 10.1098/rstb.2020.0090. - DOI - PMC - PubMed
    1. Wilkins AS. Moving up the hierarchy: a hypothesis on the evolution of a genetic sex determination pathway. BioEssays. 1995;17:71–77. doi: 10.1002/bies.950170113. - DOI - PubMed
    1. Graham P, Penn JKM, Schedl P. Masters change, slaves remain. BioEssays. 2003;25:1–4. doi: 10.1002/bies.10207. - DOI - PubMed

Publication types