

Concentration gradients of monoamines, their precursors and metabolites in serial lumbar cerebrospinal fluid of neurologically healthy patients determined with a novel LC-MS/MS technique
- PMID: 36782208
- PMCID: PMC9923930
- DOI: 10.1186/s12987-023-00413-8
Concentration gradients of monoamines, their precursors and metabolites in serial lumbar cerebrospinal fluid of neurologically healthy patients determined with a novel LC-MS/MS technique
Abstract
Background: Potential biomarkers for neuropsychiatric disorders are cerebrospinal fluid (CSF) monoamines and their corresponding precursors and metabolites. During CSF sampling, CSF flows towards the lumbar sampling site from more cranial regions. To compare the results of studies in which different CSF volumes were acquired, it is important to know if ventricular-lumbar concentration gradients exist. This has only been addressed for a few biogenic amines, and almost exclusively in neurologically unwell patients due to the burden of a lumbar puncture (necessary to obtain CSF). The aim of our study was to determine if concentration gradients exist for routinely measured CSF constituents and biogenic amines in neurologically healthy patients. We applied a novel ultrasensitive liquid chromatography mass spectrometry (LC-MS/MS) method for the simultaneous quantification of multiple monoamines, precursors and metabolites in CSF and plasma.
Methods: CSF and blood samples were collected from twenty neurologically healthy patients undergoing spinal anaesthesia. Ten mL of lumbar CSF was collected in five consecutive two mL fractions. We determined leucocyte and erythrocyte counts, glucose, albumin and protein concentrations and quantified monoamines, precursors and metabolites on each of the fractions using LC-MS/MS.
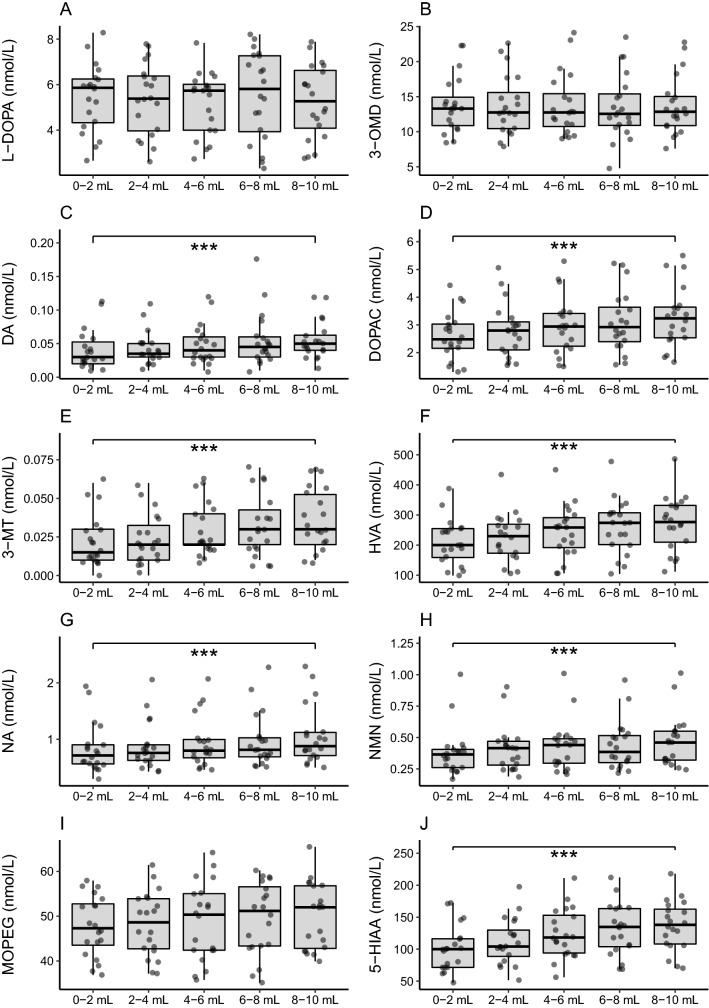
Results: In twenty patients (60% male; median age: 46 years), dopamine, DOPAC, 3-MT, HVA, noradrenaline, normetanephrine and 5-HIAA concentrations increased from the first to the last CSF fraction (all p < 0.001). CSF adrenaline concentrations were below the detection limit, whereas serotonin measurements were regarded as unreliable. Albumin and total protein levels decreased significantly across CSF fractions.
Conclusions: A ventricular-lumbar CSF concentration gradient existed for most of the investigated analytes. This is a novel finding for dopamine, noradrenaline, 3-MT and normetanephrine. These results contribute to the understanding of the neurobiology and underline the importance of standardized procedures for CSF handling to allow comparisons between studies.
Keywords: Biogenic amines; Cerebrospinal fluid (CSF); Concentration gradients; LC–MS/MS.
© 2023. The Author(s).
Conflict of interest statement
The authors declare that they have no competing interests.
Figures

Similar articles
-
[Concentrations of monoamines and monoamine metabolites in cerebrospinal fluid determined by high-performance liquid chromatography with electrochemical detection].No To Shinkei. 1982 Nov;34(11):1099-106. No To Shinkei. 1982. PMID: 6186264 Japanese.
-
Concentration gradients for monoamine metabolites in lumbar cerebrospinal fluid.J Neural Transm Park Dis Dement Sect. 1993;5(1):5-15. doi: 10.1007/BF02260910. J Neural Transm Park Dis Dement Sect. 1993. PMID: 7679905
-
Sampling issues of cerebrospinal fluid and plasma monoamines: Investigation of the circadian rhythm and rostrocaudal concentration gradient.Neurochem Int. 2019 Sep;128:154-162. doi: 10.1016/j.neuint.2019.04.015. Epub 2019 Apr 26. Neurochem Int. 2019. PMID: 31034914
-
Biochemical diagnosis of dopaminergic disturbances in paediatric patients: analysis of cerebrospinal fluid homovanillic acid and other biogenic amines.Clin Biochem. 2008 Nov;41(16-17):1306-15. doi: 10.1016/j.clinbiochem.2008.08.077. Epub 2008 Sep 3. Clin Biochem. 2008. PMID: 18790694 Review.
-
Monoamine metabolites in human cerebrospinal fluid: indicators of neuronal activity?Med Biol. 1985;63(1):1-17. Med Biol. 1985. PMID: 2582215 Review.
Cited by
-
Rifampicin and protein concentrations in paired spinal versus ventricular cerebrospinal fluid samples of children with tuberculous meningitis.J Antimicrob Chemother. 2024 Feb 1;79(2):280-286. doi: 10.1093/jac/dkad371. J Antimicrob Chemother. 2024. PMID: 38101948 Free PMC article.
-
A hitchhiker's guide to cerebrospinal fluid biomarkers for neuro-oncology.Neuro Oncol. 2025 Jun 21;27(5):1165-1179. doi: 10.1093/neuonc/noae276. Neuro Oncol. 2025. PMID: 39786477 Free PMC article. Review.
-
Biomarker changes in suspected idiopathic normal-pressure hydrocephalus patients undergoing external lumbar drainage: a pilot study.Croat Med J. 2024 Aug 31;65(4):328-338. doi: 10.3325/cmj.2024.65.328. Croat Med J. 2024. PMID: 39219196 Free PMC article.
References
-
- Seehusen DA, Reeves MM, Fomin DA. Cerebrospinal fluid analysis. Am Fam Physician. 2003;68(6):1103–1108. - PubMed
MeSH terms
Substances
LinkOut - more resources
Full Text Sources
