. 2023 Feb 13;21(1):53.
doi: 10.1186/s12916-023-02740-x.

Plasma lipidomic profiling reveals metabolic adaptations to pregnancy and signatures of cardiometabolic risk: a preconception and longitudinal cohort study

Affiliations

Plasma lipidomic profiling reveals metabolic adaptations to pregnancy and signatures of cardiometabolic risk: a preconception and longitudinal cohort study

Li Chen et al. BMC Med. .

Abstract

Background: Adaptations in lipid metabolism are essential to meet the physiological demands of pregnancy and any aberration may result in adverse outcomes for both mother and offspring. However, there is a lack of population-level studies to define the longitudinal changes of maternal circulating lipids from preconception to postpartum in relation to cardiometabolic risk factors.

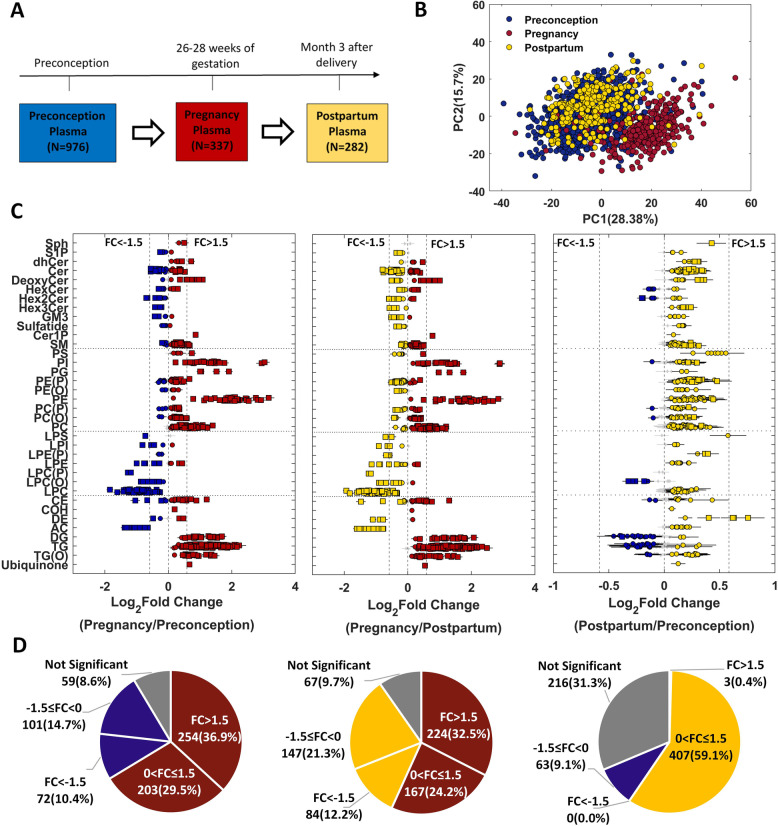
Methods: LC-MS/MS-based quantification of 689 lipid species was performed on 1595 plasma samples collected at three time points in a preconception and longitudinal cohort, Singapore PREconception Study of long-Term maternal and child Outcomes (S-PRESTO). We mapped maternal plasma lipidomic profiles at preconception (N = 976), 26-28 weeks' pregnancy (N = 337) and 3 months postpartum (N = 282) to study longitudinal lipid changes and their associations with cardiometabolic risk factors including pre-pregnancy body mass index, body weight changes and glycaemic traits.

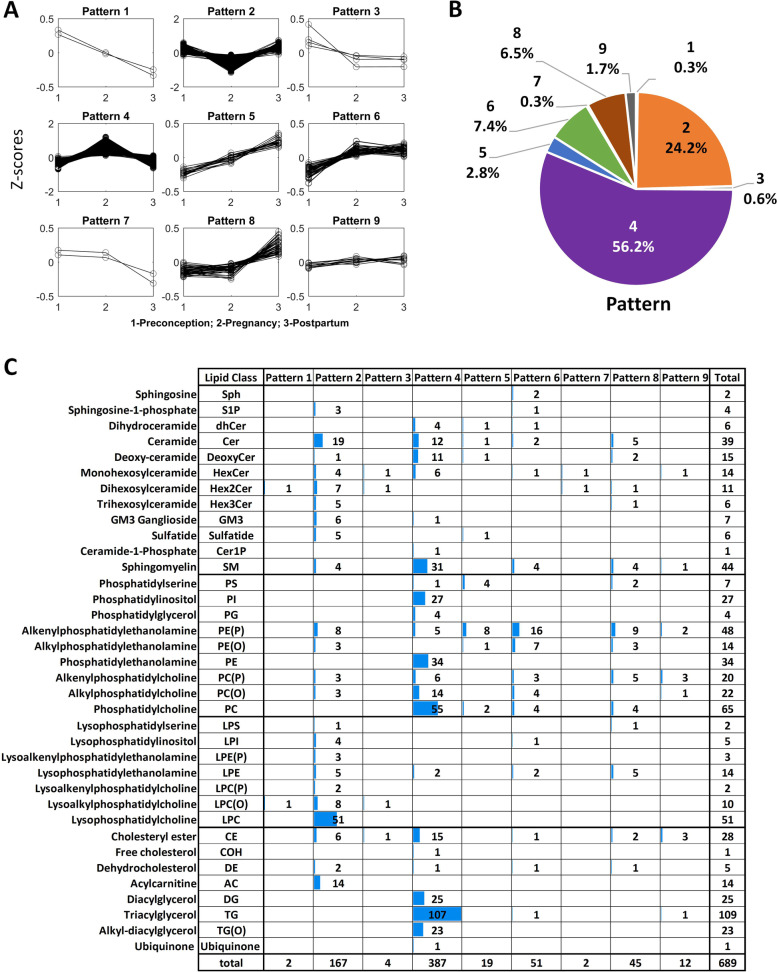
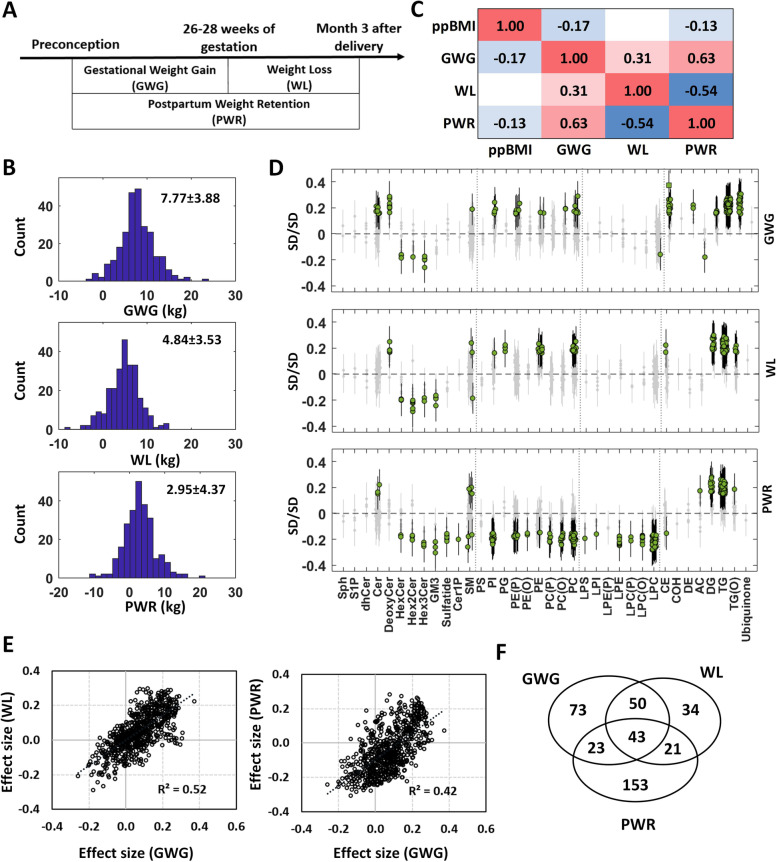
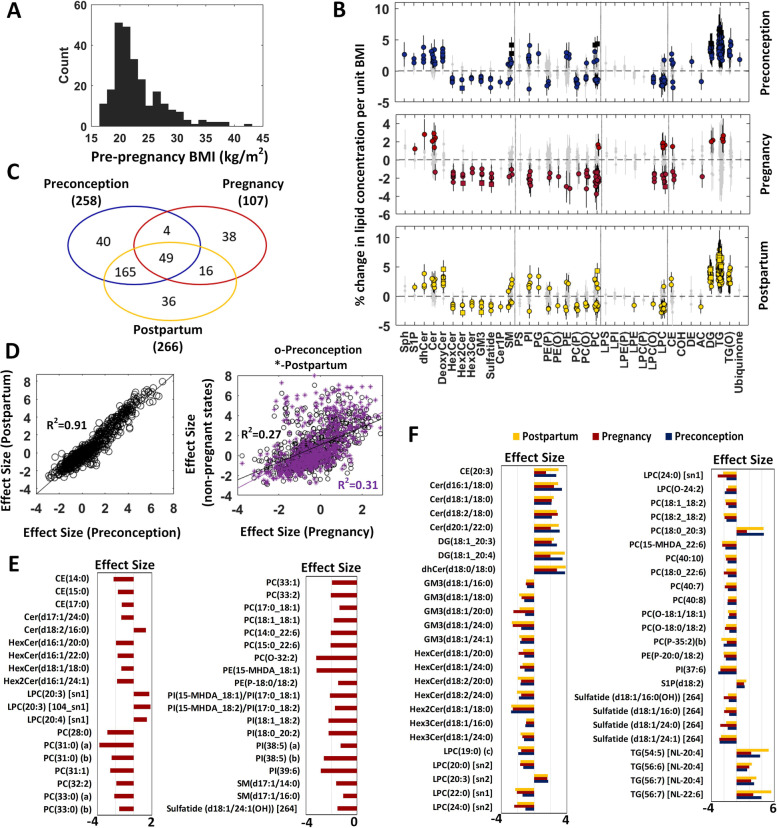
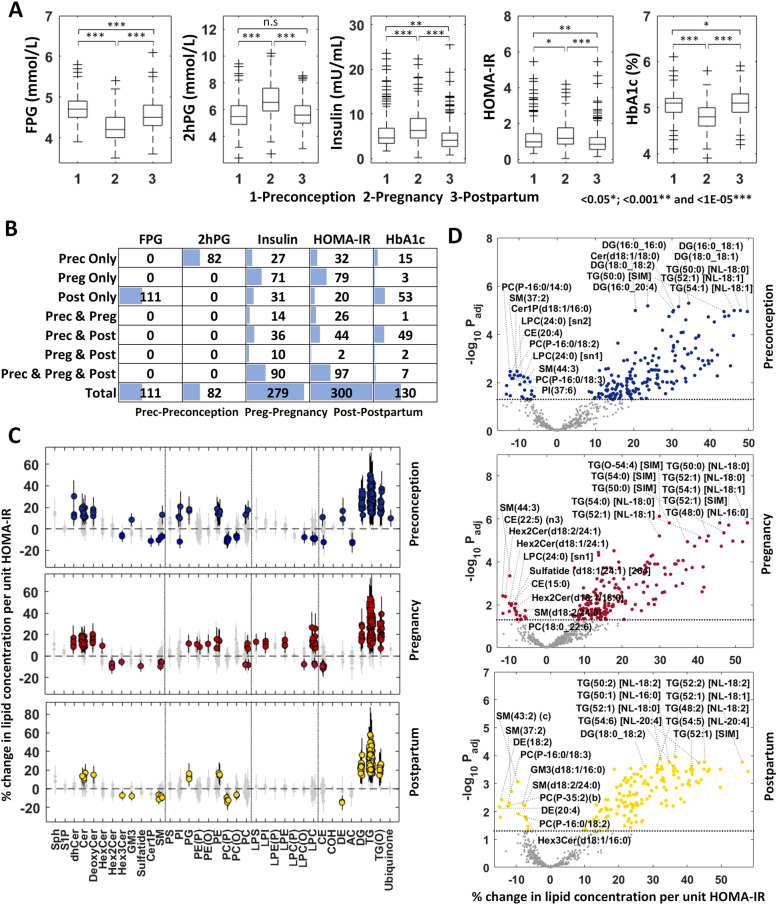
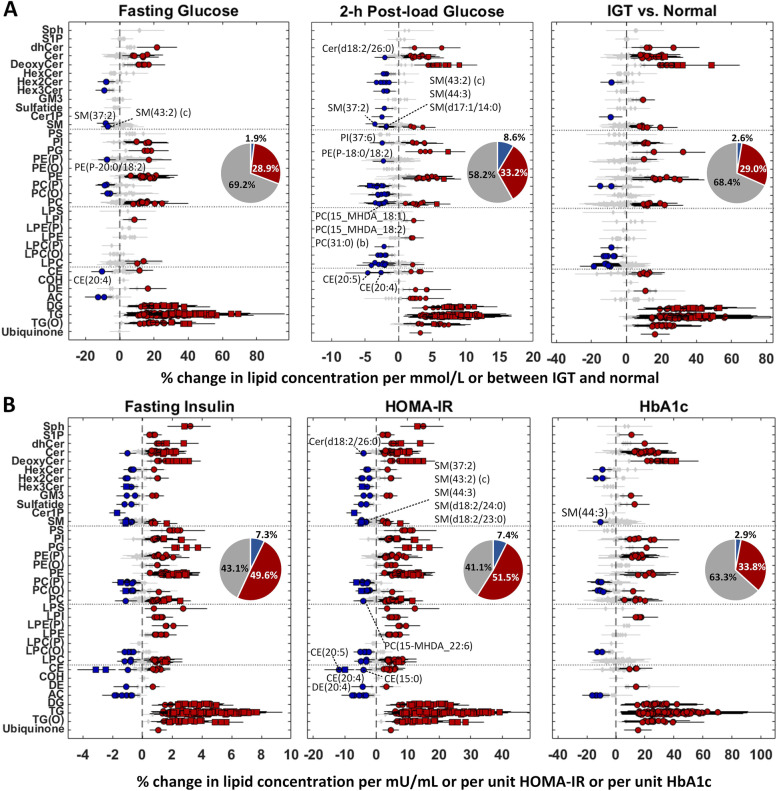
Results: Around 56% of the lipids increased and 24% decreased in concentration in pregnancy before returning to the preconception concentration at postpartum, whereas around 11% of the lipids went through significant changes in pregnancy and their concentrations did not revert to the preconception concentrations. We observed a significant association of body weight changes with lipid changes across different physiological states, and lower circulating concentrations of phospholipids and sphingomyelins in pregnant mothers with higher pre-pregnancy BMI. Fasting plasma glucose and glycated haemoglobin (HbA1c) concentrations were lower whereas the homeostatic model assessment of insulin resistance (HOMA-IR), 2-h post-load glucose and fasting insulin concentrations were higher in pregnancy as compared to both preconception and postpartum. Association studies of lipidomic profiles with these glycaemic traits revealed their respective lipid signatures at three physiological states. Assessment of glycaemic traits in relation to the circulating lipids at preconception with a large sample size (n = 936) provided an integrated view of the effects of hyperglycaemia on plasma lipidomic profiles. We observed a distinct relationship of lipidomic profiles with different measures, with the highest percentage of significant lipids associated with HOMA-IR (58.9%), followed by fasting insulin concentration (56.9%), 2-h post-load glucose concentration (41.8%), HbA1c (36.7%), impaired glucose tolerance status (31.6%) and fasting glucose concentration (30.8%).

Conclusions: We describe the longitudinal landscape of maternal circulating lipids from preconception to postpartum, and a comprehensive view of trends and magnitude of pregnancy-induced changes in lipidomic profiles. We identified lipid signatures linked with cardiometabolic risk traits with potential implications both in pregnancy and postpartum life. Our findings provide insights into the metabolic adaptations and potential biomarkers of modifiable risk factors in childbearing women that may help in better assessment of cardiometabolic health, and early intervention at the preconception period.

Trial registration: ClinicalTrials.gov, NCT03531658.

Keywords: Cardiometabolic risk; Glucose homeostasis; Insulin resistance; Lipidomics; Metabolic adaptations; Postpartum; Preconception; Pregnancy; Weight changes.


Conflict of interest statement

The authors declare that they have no competing interests.

Figures

Fig. 1
Fig. 1
Pregnancy-induced changes in plasma lipidomic profiles. A Sample size and collection time points for maternal plasma samples. B PCA plot of lipidomics data (N = 1595). C Forest plots of three comparative studies using 263 trio subjects (pregnancy vs. preconception, pregnancy vs. postpartum and postpartum vs. preconception). Effect size—log2 of fold change (FC) and error bar—95% confidence interval. Diamond—Padj ≥ 0.05 (grey), circle—Padj < 0.05 and square—Padj < 1.00E−10. The full names of lipid classes refer to Fig. 2C. D Pie charts of percentages of significant lipids in three comparative studies. Colour codes in (D) are consistent with (C)
Fig. 2
Fig. 2
Patterns of longitudinal changes in plasma lipidomic profiles from preconception to postpartum using trio subjects (= 263). A Nine patterns of lipid change profiles (z-scores of log-transformed lipidomic data). B Pie chart of nine patterns. C Distribution of nine patterns in lipid classes
Fig. 3
Fig. 3
Associations of body weight changes with the changes in lipidomic profiles. A Gestational weight gain (GWG), weight loss (WL) and postpartum weight retention (PWR). B Histograms of GWG (n = 261), WL (n = 253) and PWR (n = 253). C Pairwise Pearson correlation (R) heat map between pre-pregnancy BMI (ppBMI) and body weight changes. D Forest plots (error bar: 95% CI) of three association results. Diamond—Padj ≥ 0.05 (grey), circle—Padj < 0.05 and square—Padj < 1.00E−5. E Scatter plots of effect sizes (SD/SD). Effect size is SD change in log2FC for one SD increase in body weight change. F Venn diagram of significant lipid species in three analyses
Fig. 4
Fig. 4
Association of pre-pregnancy BMI (ppBMI) with plasma lipidomic profiles at preconception, pregnancy and postpartum using trio subjects (= 252). A Histogram of ppBMI. B Forest plots (error bar: 95% CI) of the ppBMI association studies at three time points. Diamond—Padj ≥ 0.05 (grey), circle—Padj < 0.05 and square—Padj < 1.00E−5. C Venn diagram of significant lipid species in three studies. D Scatter plots of effect sizes (% change in lipid concentration per unit BMI). E Thirty-eight unique pregnancy-related lipid signatures. F Forty-nine common lipid signatures in three studies
Fig. 5
Fig. 5
Association of measures of glucose homeostasis and insulin resistance with plasma lipidomic profiles at preconception, pregnancy and postpartum using trio subjects. A Box plots of fasting glucose (n = 249), 2-h post-load glucose (n = 226), fasting insulin (n = 243), HOMA-IR (n = 240) and HbA1c (n = 249) at three time points. The p-values are calculated by paired t-test. B Number of significant lipid species at three time points (Padj < 0.05). C, D Forest plots (error bar: 95% CI) and volcano plots of the HOMA-IR studies at three time points. Diamond—Padj ≥ 0.05 (grey), circle—Padj < 0.05 and square—Padj < 1.00E−5 in forest plots. Top 10 lipid species with positive and negative associations are labelled in (D). The horizontal dotted line in D indicates Padj = 0.05
Fig. 6
Fig. 6
Association of measures of glucose homeostasis and insulin resistance with plasma lipidomic profiles at preconception (n = 936). A Forest plots (error bar: 95% CI) of fasting glucose concentration (mmol/L), 2-h post-load glucose concentrations (mmol/L) and impaired glucose tolerance status (86 IGT vs. 850 Normal). B Forest plots (error bar: 95% CI) of fasting insulin concentration (mU/mL), HOMA-IR and HbA1c (%). Diamond—Padj ≥ 0.05 (grey), circle—Padj <0.05 and square—Padj <1.00E−5. Pie chart—percentage of lipids with significant (positive: red and negative: blue) or insignificant (grey) associations

References

    1. Alvarez JJ, Montelongo A, Iglesias A, Lasuncion MA, Herrera E. Longitudinal study on lipoprotein profile, high density lipoprotein subclass, and postheparin lipases during gestation in women. J Lipid Res. 1996;37(2):299–308. doi: 10.1016/S0022-2275(20)37617-3. - DOI - PubMed
    1. Montelongo A, Lasuncion MA, Pallardo LF, Herrera E. Longitudinal study of plasma lipoproteins and hormones during pregnancy in normal and diabetic women. Diabetes. 1992;41(12):1651–1659. doi: 10.2337/diab.41.12.1651. - DOI - PubMed
    1. Okala SG, Sise EA, Sosseh F, Prentice AM, Woollett LA, Moore SE. Maternal plasma lipid levels across pregnancy and the risks of small-for-gestational age and low birth weight: a cohort study from rural Gambia. BMC Pregnancy Childbirth. 2020;20(1):153. doi: 10.1186/s12884-020-2834-1. - DOI - PMC - PubMed
    1. Ryckman KK, Spracklen CN, Smith CJ, Robinson JG, Saftlas AF. Maternal lipid levels during pregnancy and gestational diabetes: a systematic review and meta-analysis. BJOG. 2015;122(5):643–651. doi: 10.1111/1471-0528.13261. - DOI - PubMed
    1. Jin WY, Lin SL, Hou RL, Chen XY, Han T, Jin Y, Tang L, Zhu ZW, Zhao ZY. Associations between maternal lipid profile and pregnancy complications and perinatal outcomes: a population-based study from China. BMC Pregnancy Childbirth. 2016;16:60. doi: 10.1186/s12884-016-0852-9. - DOI - PMC - PubMed

Publication types

Associated data