. 2023 Feb 13;15(1):22.
doi: 10.1186/s13148-023-01439-3.

Identification of m7G regulator-mediated RNA methylation modification patterns and related immune microenvironment regulation characteristics in heart failure

Affiliations

Identification of m7G regulator-mediated RNA methylation modification patterns and related immune microenvironment regulation characteristics in heart failure

Chaoqun Ma et al. Clin Epigenetics. .

Abstract

Background: N7-methylguanosine (m7G) modification has been reported to regulate RNA expression in multiple pathophysiological processes. However, little is known about its role and association with immune microenvironment in heart failure (HF).

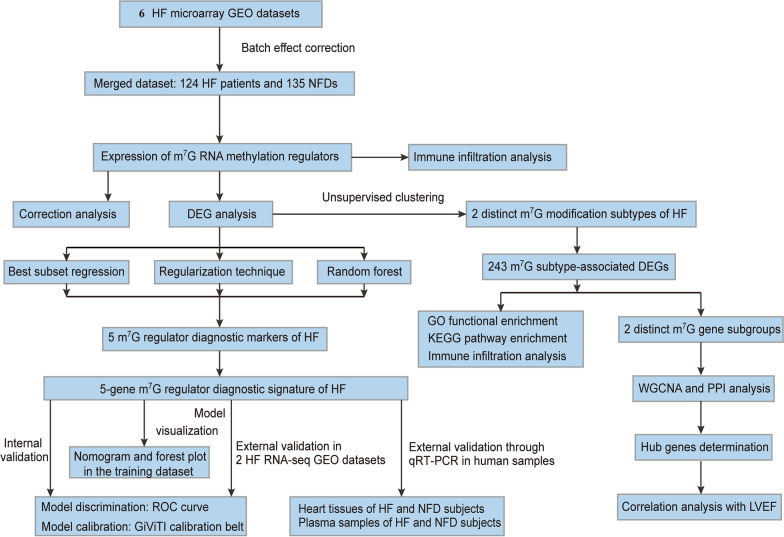
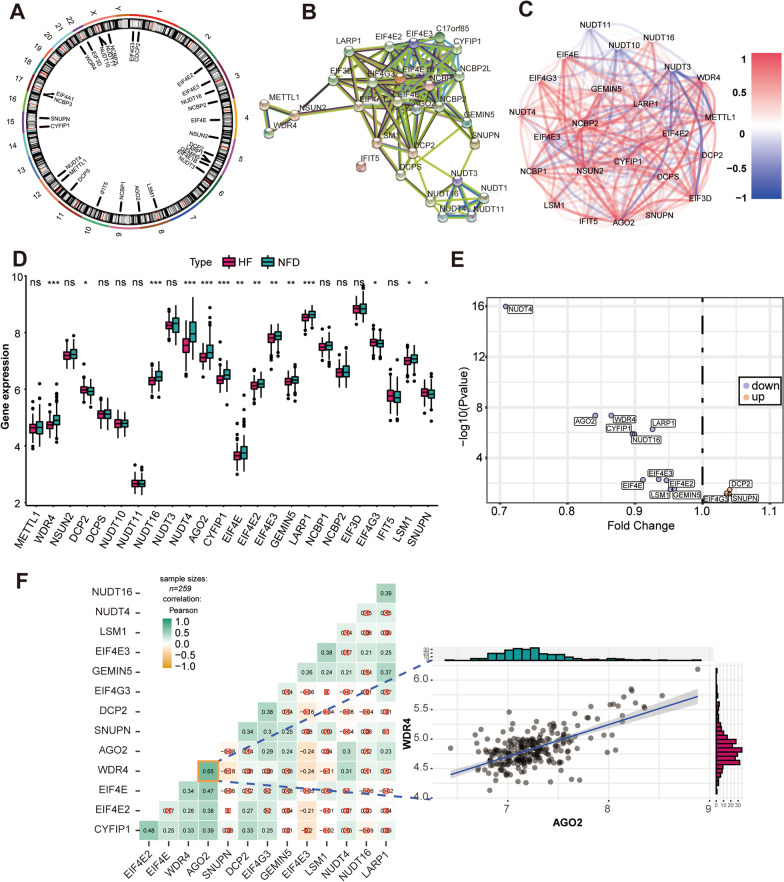
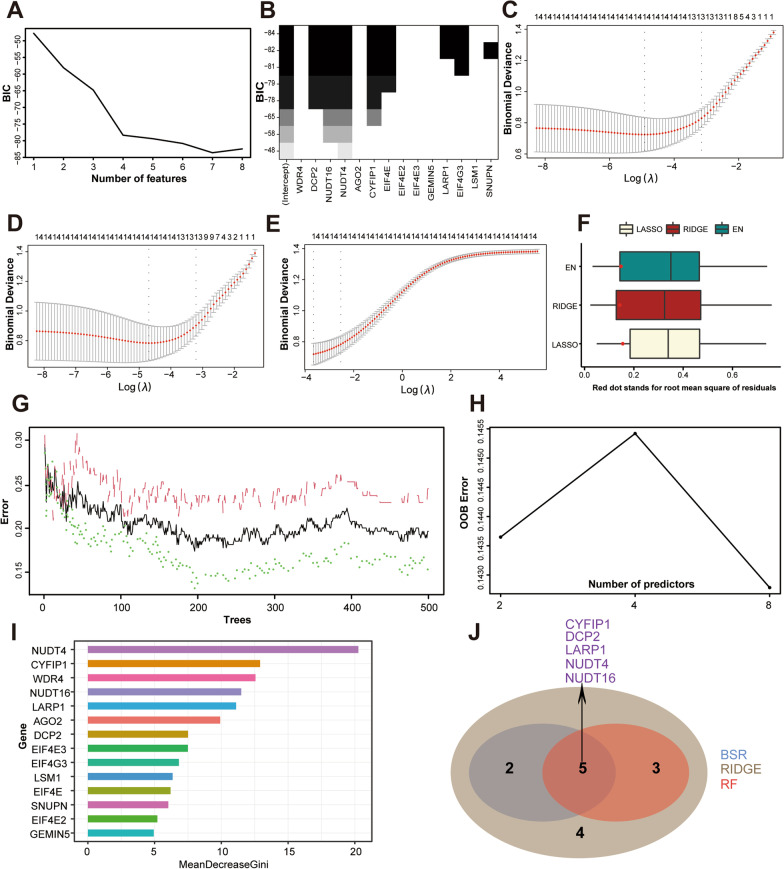
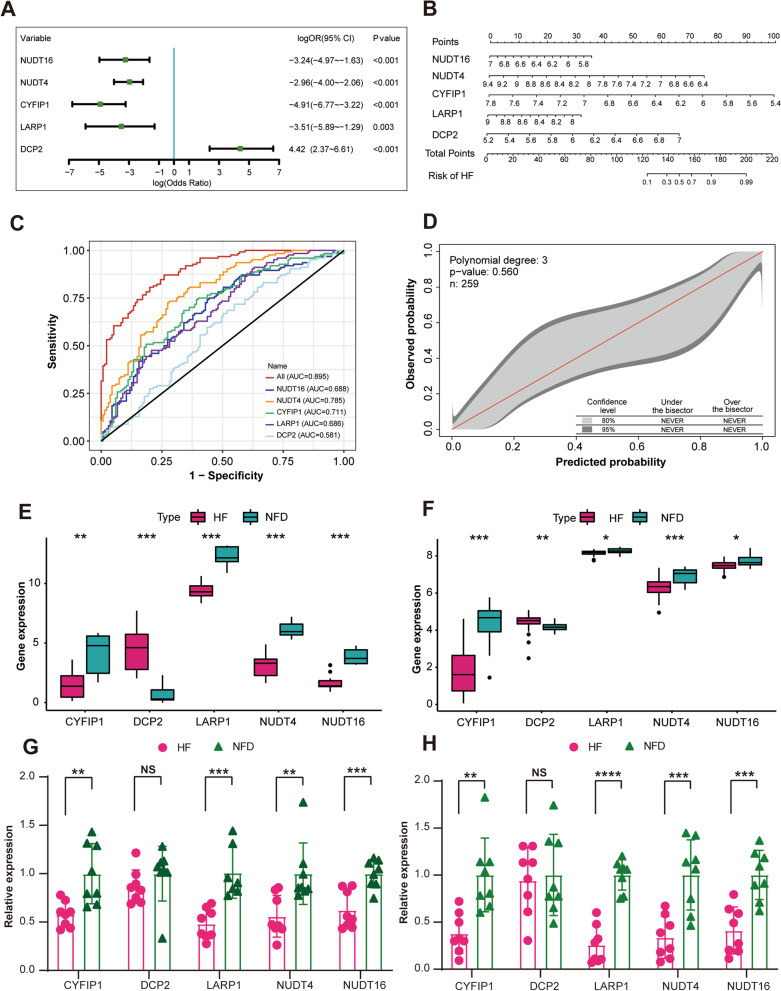
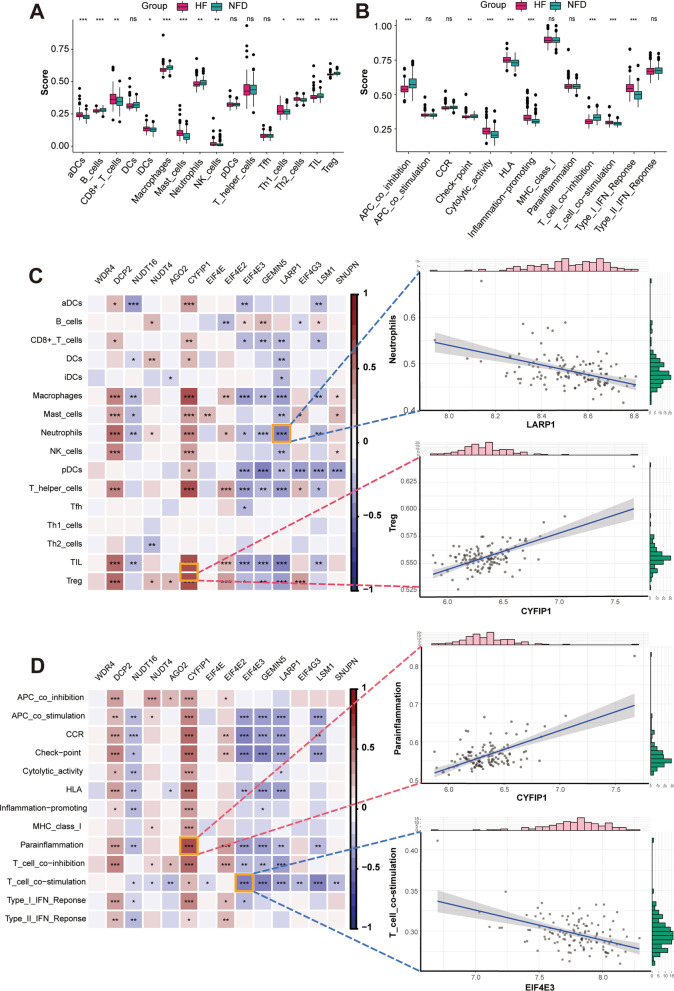
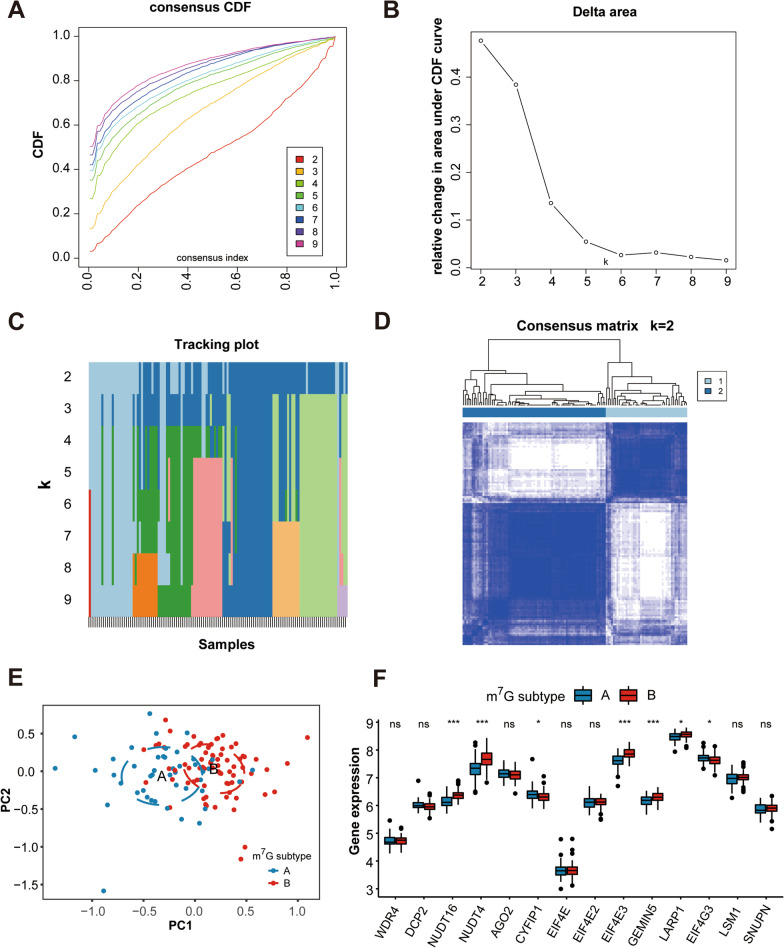
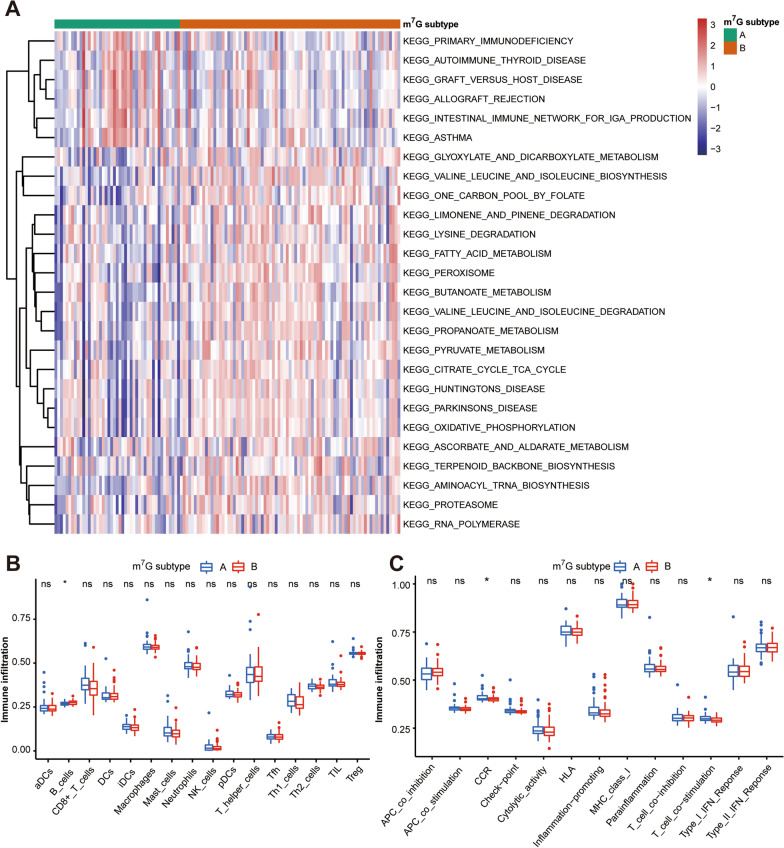
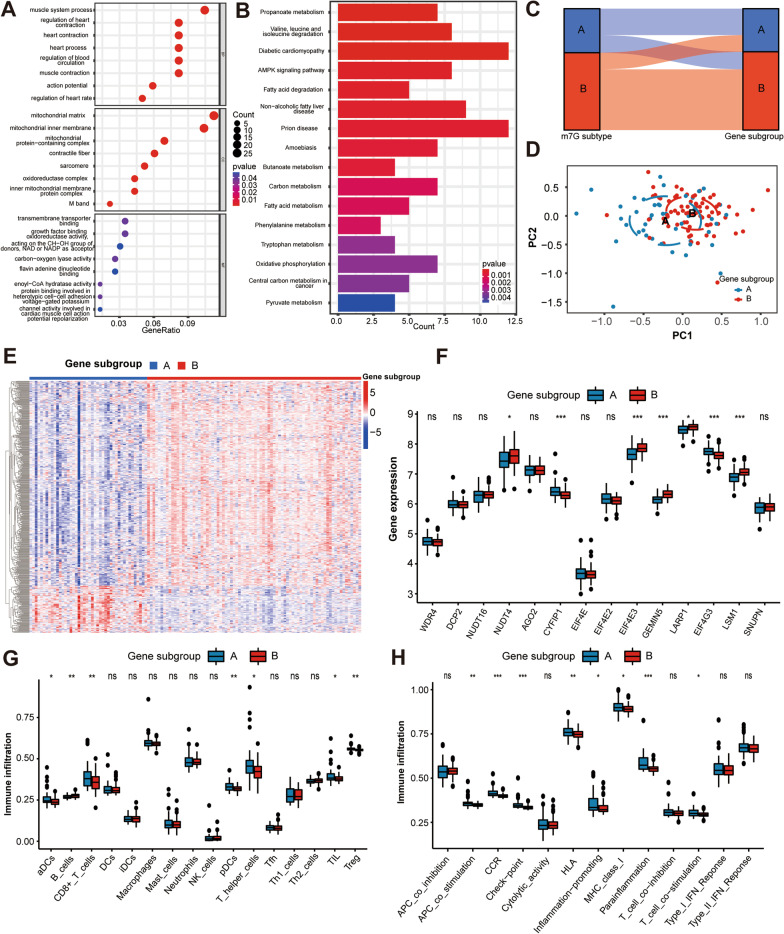
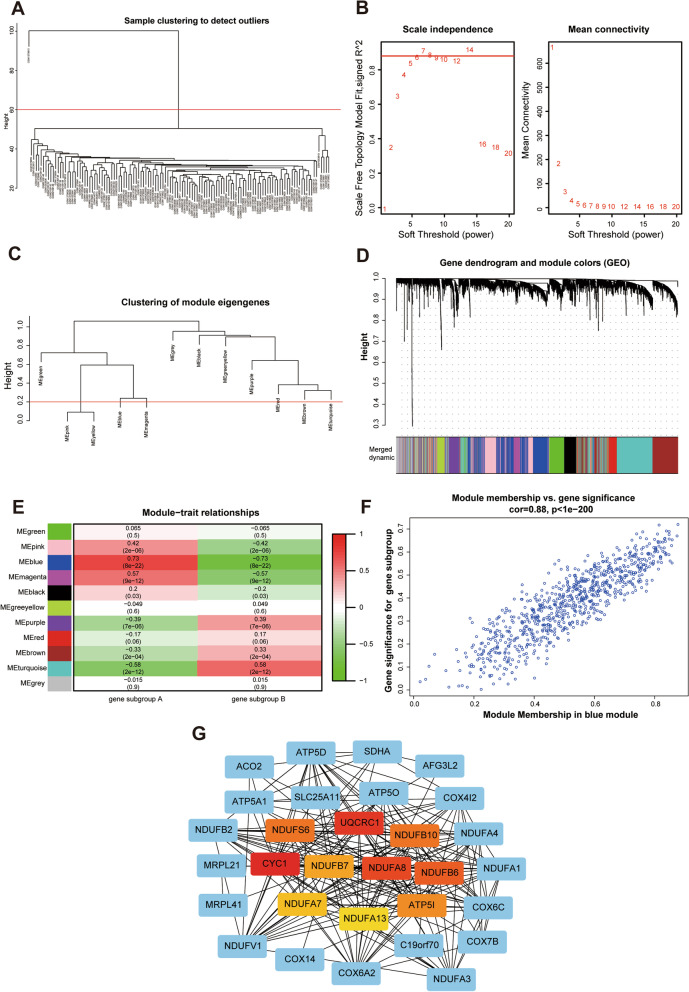
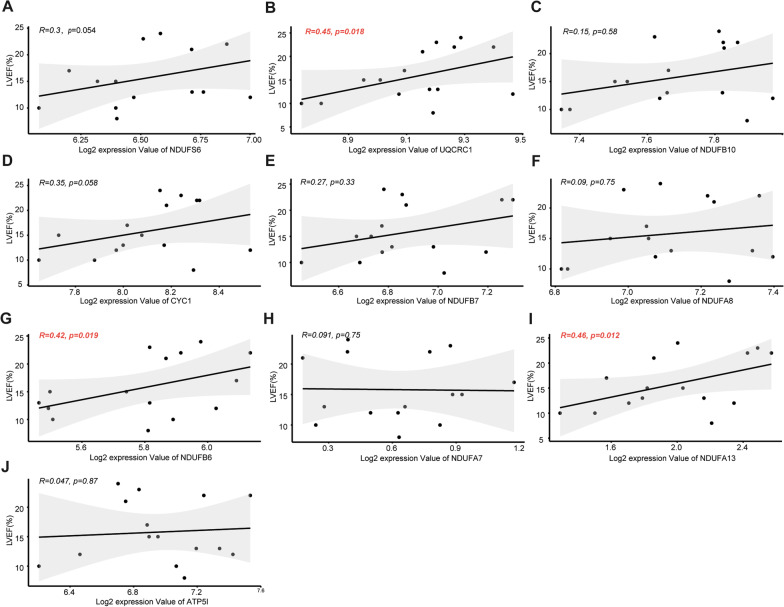
Results: One hundred twenty-four HF patients and 135 nonfailing donors (NFDs) from six microarray datasets in the gene expression omnibus (GEO) database were included to evaluate the expression profiles of m7G regulators. Results revealed that 14 m7G regulators were differentially expressed in heart tissues from HF patients and NFDs. Furthermore, a five-gene m7G regulator diagnostic signature, NUDT16, NUDT4, CYFIP1, LARP1, and DCP2, which can easily distinguish HF patients and NFDs, was established by cross-combination of three machine learning methods, including best subset regression, regularization techniques, and random forest algorithm. The diagnostic value of five-gene m7G regulator signature was further validated in human samples through quantitative reverse-transcription polymerase chain reaction (qRT-PCR). In addition, consensus clustering algorithms were used to categorize HF patients into distinct molecular subtypes. We identified two distinct m7G subtypes of HF with unique m7G modification pattern, functional enrichment, and immune characteristics. Additionally, two gene subgroups based on m7G subtype-related genes were further discovered. Single-sample gene-set enrichment analysis (ssGSEA) was utilized to assess the alterations of immune microenvironment. Finally, utilizing protein-protein interaction network and weighted gene co-expression network analysis (WGCNA), we identified UQCRC1, NDUFB6, and NDUFA13 as m7G methylation-associated hub genes with significant clinical relevance to cardiac functions.

Conclusions: Our study discovered for the first time that m7G RNA modification and immune microenvironment are closely correlated in HF development. A five-gene m7G regulator diagnostic signature for HF (NUDT16, NUDT4, CYFIP1, LARP1, and DCP2) and three m7G methylation-associated hub genes (UQCRC1, NDUFB6, and NDUFA13) were identified, providing new insights into the underlying mechanisms and effective treatments of HF.

Keywords: Bioinformatic analysis; Heart failure; Immune infiltration; Machine learning; N7-methylguanosine; Unsupervised clustering.


Conflict of interest statement

The authors declare that they have no competing interests.

Figures

Fig. 1
Fig. 1
Study flow diagram. HF, heart failure; NFD Nonfailing donor, GEO Gene expression omnibus, NFDs Nonfailing donors, m7G, N7-methylguanosine, DEG Differentially expressed gene, qRT-PCR Quantitative reverse-transcription polymerase chain reaction, GO Gene ontology, KEGG Kyoto Encyclopedia of Genes and Genomes, RNA-seq RNA-sequencing, WGCNA Weighted gene co-expression network analysis, PPI Protein–protein interaction, LVEF Left ventricular ejection fraction, ROC Receiver operating characteristic
Fig. 2
Fig. 2
Landscape of m7G RNA methylation regulators in HF. A Circus plot of chromosome distributions of the 29 m7G regulators. B protein–protein interaction (PPI) network among the 29 m7G RNA methylation regulators. C Correlations among the 24 m7G regulators in heart samples from HF patients and NFDs. A positive correlation is indicated by red, while a negative correlation is indicated by blue. D Expression profiles of m7G RNA methylation regulators between HF patients and NFDs. ns = not significant, *p < 0.05, **p < 0.01, and ***p < 0.001 vs. the NFD group. E Volcano plot showing the differential expression of 14 m7G regulators between HF patients and NFDs. F Correlation analysis among 14 differentially expressed m7G regulators in HF patients. ☒ in red stands for nonsignificant at p < 0.05. The scatter plot demonstrated the m7G regulators pair with the highest differential correlation, WDR4 and AGO2 with the most positive correlation
Fig. 3
Fig. 3
Screening m7G regulator diagnostic markers by three feature selection algorithms. A Bayesian information criterion score by feature inclusion of best subset regression (BSR) analysis. B Model performance based on different feature subsets in BSR analysis. C Least absolute shrinkage and selection operator (LASSO) regression algorithm to identify diagnostic markers. D RIDGE regression algorithm to identify diagnostic markers. E Elastic net (EN) regression algorithm to identify diagnostic markers for HF. F Root mean squared error (RMSE) of three regularization technique models in the internal validation dataset. G Out-of-bag (OOB) error rate of the random forest (RF) model. H Search for the optimal value of mtry for RF model. I Variable importance plot for the RF model. The features are ranked by the mean decrease in classification accuracy when they are permuted. The more the Gini coefficient decreases on average, the more important the variable is. J Venn diagram showing the intersected genes of BSR analysis, RIDGE regression and RF algorithm
Fig. 4
Fig. 4
Development and validation of the m7G regulator diagnostic signature for HF. A Forest plot of the multivariate logistic regression analysis to investigated the relationship between the five m7G regulator diagnostic markers and HF. B Nomogram of the five-gene m7G regulator diagnostic signature for HF probability. C receiver operating characteristic (ROC) curve of the five-gene m7G regulator diagnostic signature in the merged dataset. D The GiViTi calibration belts of the five-gene m7G regulator diagnostic signature in the merged dataset. E The expression profiles of the five m7G regulators diagnostic markers in the external validation dataset GSE116250. **p < 0.01, and ***p < 0.001 vs. the NFD group. F The expression profiles of five m7G regulators diagnostic markers in the external validation dataset GSE46224. *p < 0.05, **p < 0.01, and ***p < 0.001 vs. the NFD group. G Validation of the 5 m7G regulators diagnostic markers expression (CYFIP1, DCP2, LARP1, NUDT4, and NUDT16) by quantitative real-time reverse-transcription PCR (qRT-PCR) using human heart tissues from HF patients and NFDs. Data are presented with mean ± standard deviation (SD), n = 8. **p < 0.01, and ***p < 0.001 vs. the NFD group. NS, no significance. H Validation of the 5 m7G regulators diagnostic markers expression by qRT-PCR using plasma samples from HF patients and NFDs. Data are presented with mean ± SD, n = 8. NS**p < 0.01, ***p < 0.001, and ****p < 0.0001 vs. the NFD group. NS, no significance
Fig. 5
Fig. 5
m7G regulators are associated with immune characteristics of HF. A The infiltrating scores of 16 immune cells in cardiac tissues from HF patients and NFDs. ns = not significant, *p < 0.05, **p < 0.01, and ***p < 0.001 vs. the NFD group. B The infiltrating scores of 13 immune-related functions in cardiac tissues from HF patients and NFDs. ns = not significant, **p < 0.01, and ***p < 0.001 vs. the NFD group. C Correlations between 14 differentially expressed m7G regulators and 16 immune cells infiltrations in HF, as visualized by heat map. The two scatter plots displayed the most positively or negatively correlated immune cells-m7G regulator pair. D Correlations between 14 differentially expressed m7G regulators and 13 immune-related functions in HF, as visualized by heat map. The two scatter plots displayed the most positively or negatively correlated immune function-m7G regulator pair
Fig. 6
Fig. 6
Identification of two distinct m7G modification subtypes across HF samples. A Consensus clustering model with cumulative distribution function (CDF) for k = 2–9. k means cluster count. B Relative change in the area under the CDF curve for k = 2–9. C The consensus cluster of items (in column) at k = 2–9 (in row). D Consensus matrix heatmap defining two subtypes (k = 2) and their correlation area. E Principal component analysis (PCA) showing a remarkable difference in transcriptomes between the two subtypes of HF. F The two m7G subtypes exhibit distinct expression profiles of the 14 m7G RNA methylation regulators
Fig. 7
Fig. 7
Immune signature and pathways of two distinct m7G subtypes. A Gene-set variation analysis (GSVA) of biological pathways enrichment between two m7G subtypes. B The infiltration scores of 16 immune cells between two m7G subtypes. ns = not significant, *p < 0.05 vs. the m7G subtype A. C The infiltration scores of 13 immune-related functions between two m7G subtypes. ns = not significant, *p < 0.05 vs. the m7G subtype A
Fig. 8
Fig. 8
Determination of HF gene subgroups based on m7G subtype-associated DEGs. A GO enrichment analysis of DEGs between two m7G subtypes. BP, biological process, CC, cellular components, MF, molecular functions. B KEGG enrichment analysis of DEGs between two m7G subtypes. C Alluvial diagram showing the changes of m7G subtypes and m7G gene subgroups of HF. D PCA plot showing a remarkable difference in transcriptomes between two HF gene subgroups. E Heatmap of DEGs between two m7G gene subgroups. F The two HF gene subgroups exhibit distinct expression profiles of the 14 m7G RNA methylation regulators. ns = not significant, *p < 0.05, ***p < 0.010 vs. gene subgroup A. G The infiltration scores of 16 immune cells between two m7G gene subgroups. ns = not significant, *p < 0.05, **p < 0.01 vs. gene subgroup A. H The infiltration scores of 13 immune-related functions between two m7G gene subgroups. ns = not significant, *p < 0.05, **p < 0.01, and ***p < 0.001 vs. gene subgroup A. DEGs Differentially expressed genes, GO Gene ontology, KEGG Kyoto Encyclopedia of Genes and Genomes, PCA Principal component analysis
Fig. 9
Fig. 9
Identification of m7G methylation-related hub genes in HF. A Sample clustering was conducted based on the expression data of all HF samples. The top 25% variation genes were used for WGCNA, and outlier samples were excluded. The red line indicates the cutoff threshold (60). B Scale-free topology index analysis and mean connectivity of soft threshold power from 1 to 20. The red line indicates the scale-free R2 (0.879). C Clustering dendrogram of module eigengenes. The red line indicates the cut height (0.20). D Gene dendrogram obtained by average linkage hierarchical clustering. The genes were clustered into different modules through hierarchical clustering and merged when the correlation of the modules is > 0.8. E Heatmap of the correlation between module eigengenes and HF gene subgroups. F Correlation between module membership (X-axis) and gene significance (Y-axis) of genes from the blue module. G Protein–protein interaction (PPI) network of genes from the blue module. The central nodes in PPI network are marked in red, yellow, and orange
Fig. 10
Fig. 10
Relationship between m7G markers expression levels and LVEF in HF patients. LVEF Left ventricular ejection fraction

References

    1. Gupta A, Yu Y, Tan Q, Liu S, Masoudi FA, Du X, Zhang J, Krumholz HM, Li J. Quality of care for patients hospitalized for heart failure in China. JAMA Netw Open. 2020;3(1):e1918619. doi: 10.1001/jamanetworkopen.2019.18619. - DOI - PMC - PubMed
    1. Murphy SP, Kakkar R, McCarthy CP, Januzzi JL, Jr., Inflammation in heart failure: JACC state-of-the-art review. J Am Coll Cardiol. 2020;75(11):1324–1340. doi: 10.1016/j.jacc.2020.01.014. - DOI - PubMed
    1. Swirski FK, Nahrendorf M. Cardioimmunology: the immune system in cardiac homeostasis and disease. Nat Rev Immunol. 2018;18(12):733–744. doi: 10.1038/s41577-018-0065-8. - DOI - PubMed
    1. Komal S, Zhang LR, Han SN. Potential regulatory role of epigenetic RNA methylation in cardiovascular diseases. Biomed Pharmacother. 2021;137:111376. doi: 10.1016/j.biopha.2021.111376. - DOI - PubMed
    1. Jiang X, Liu B, Nie Z, Duan L, Xiong Q, Jin Z, Yang C, Chen Y. The role of m6A modification in the biological functions and diseases. Signal Transduct Target Ther. 2021;6(1):74. doi: 10.1038/s41392-020-00450-x. - DOI - PMC - PubMed

Publication types