

Transcriptomics secondary analysis of severe human infection with SARS-CoV-2 identifies gene expression changes and predicts three transcriptional biomarkers in leukocytes
- PMID: 36785619
- PMCID: PMC9908618
- DOI: 10.1016/j.csbj.2023.02.003
Transcriptomics secondary analysis of severe human infection with SARS-CoV-2 identifies gene expression changes and predicts three transcriptional biomarkers in leukocytes
Abstract
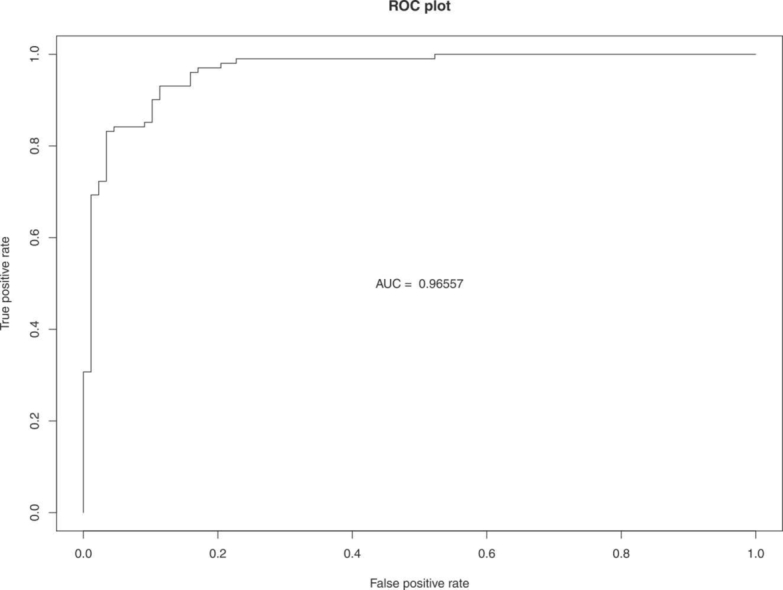
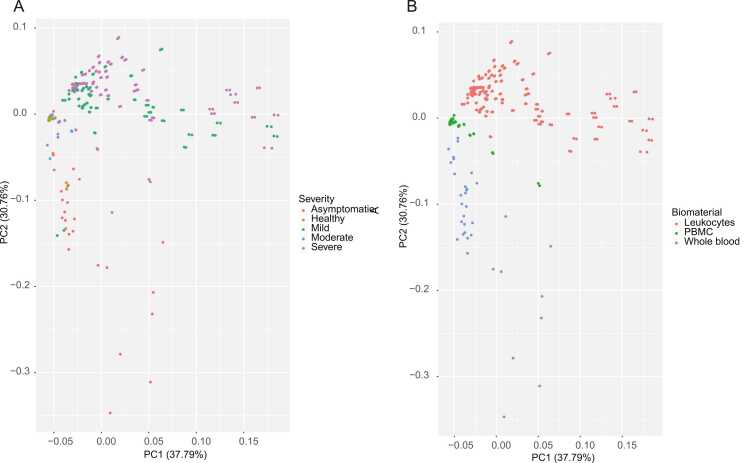
SARS-CoV-2 is the causative agent of COVID-19, which has greatly affected human health since it first emerged. Defining the human factors and biomarkers that differentiate severe SARS-CoV-2 infection from mild infection has become of increasing interest to clinicians. To help address this need, we retrieved 269 public RNA-seq human transcriptome samples from GEO that had qualitative disease severity metadata. We then subjected these samples to a robust RNA-seq data processing workflow to calculate gene expression in PBMCs, whole blood, and leukocytes, as well as to predict transcriptional biomarkers in PBMCs and leukocytes. This process involved using Salmon for read mapping, edgeR to calculate significant differential expression levels, and gene ontology enrichment using Camera. We then performed a random forest machine learning analysis on the read counts data to identify genes that best classified samples based on the COVID-19 severity phenotype. This approach produced a ranked list of leukocyte genes based on their Gini values that includes TGFBI, TTYH2, and CD4, which are associated with both the immune response and inflammation. Our results show that these three genes can potentially classify samples with severe COVID-19 with accuracy of ∼88% and an area under the receiver operating characteristic curve of 92.6--indicating acceptable specificity and sensitivity. We expect that our findings can help contribute to the development of improved diagnostics that may aid in identifying severe COVID-19 cases, guide clinical treatment, and improve mortality rates.
Keywords: AUC, Area under the curve; Bioinformatics; Biomarkers; COVID-19; COVID-19, Coronavirus Disease of 2019; DEG, Differentially expressed gene; Data mining; GEO, Gene Expression Omnibus; GO, Gene Ontology; RNA; RNA-sequencing; ROC, Receiver-operator characteristic; SARS-CoV-2; SARS-CoV-2, Severe Acute Respiratory Syndrome Coronavirus 2; Virus.
© 2023 The Author(s).
Conflict of interest statement
The authors declare that they have no known competing financial interests or personal relationships that could have appeared to influence the work reported in this paper.
Figures


Similar articles
-
Genome-wide screening of SARS-CoV-2 infection-related genes based on the blood leukocytes sequencing data set of patients with COVID-19.J Med Virol. 2021 Sep;93(9):5544-5554. doi: 10.1002/jmv.27093. Epub 2021 May 28. J Med Virol. 2021. PMID: 34009691 Free PMC article.
-
Bioinformatics analyses of significant genes, related pathways, and candidate diagnostic biomarkers and molecular targets in SARS-CoV-2/COVID-19.Gene Rep. 2020 Dec;21:100956. doi: 10.1016/j.genrep.2020.100956. Epub 2020 Nov 4. Gene Rep. 2020. PMID: 33553808 Free PMC article.
-
Differential gene expression profiling reveals potential biomarkers and pharmacological compounds against SARS-CoV-2: Insights from machine learning and bioinformatics approaches.Front Immunol. 2022 Aug 17;13:918692. doi: 10.3389/fimmu.2022.918692. eCollection 2022. Front Immunol. 2022. PMID: 36059456 Free PMC article.
-
Gene Expression Meta-Analysis Reveals Interferon-Induced Genes Associated With SARS Infection in Lungs.Front Immunol. 2021 Jul 23;12:694355. doi: 10.3389/fimmu.2021.694355. eCollection 2021. Front Immunol. 2021. PMID: 34367154 Free PMC article.
-
Molecular and Clinical Prognostic Biomarkers of COVID-19 Severity and Persistence.Pathogens. 2022 Mar 2;11(3):311. doi: 10.3390/pathogens11030311. Pathogens. 2022. PMID: 35335635 Free PMC article. Review.
Cited by
-
Secondary Transcriptomic Analysis of Triple-Negative Breast Cancer Reveals Reliable Universal and Subtype-Specific Mechanistic Markers.Cancers (Basel). 2024 Oct 2;16(19):3379. doi: 10.3390/cancers16193379. Cancers (Basel). 2024. PMID: 39409999 Free PMC article.
-
Pediatric Crohn's disease diagnosis aid via genomic analysis and machine learning.Front Pediatr. 2023 Mar 23;11:991247. doi: 10.3389/fped.2023.991247. eCollection 2023. Front Pediatr. 2023. PMID: 37033178 Free PMC article.
-
Secondary Analysis of Human Bulk RNA-Seq Dataset Suggests Potential Mechanisms for Letrozole Resistance in Estrogen-Positive (ER+) Breast Cancer.Curr Issues Mol Biol. 2024 Jul 6;46(7):7114-7133. doi: 10.3390/cimb46070424. Curr Issues Mol Biol. 2024. PMID: 39057065 Free PMC article.
-
Comparison of B-Cell Lupus and Lymphoma Using a Novel Immune Imbalance Transcriptomics Algorithm Reveals Potential Therapeutic Targets.Genes (Basel). 2024 Sep 17;15(9):1215. doi: 10.3390/genes15091215. Genes (Basel). 2024. PMID: 39336806 Free PMC article.
-
Differential gene expression analysis pipelines and bioinformatic tools for the identification of specific biomarkers: A review.Comput Struct Biotechnol J. 2024 Mar 1;23:1154-1168. doi: 10.1016/j.csbj.2024.02.018. eCollection 2024 Dec. Comput Struct Biotechnol J. 2024. PMID: 38510977 Free PMC article. Review.
References
-
- Cevik M., Kuppalli K., Kindrachuk J., Peiris M. Virology, transmission, and pathogenesis of SARS-CoV-2. BMJ. 2020;371:m3862. - PubMed
LinkOut - more resources
Full Text Sources
Research Materials
Miscellaneous