

Analyzing the diffusion and duration of antibodies to SARS-CoV-2 during the natural infection and comparison with vaccination
- PMID: 36785809
- PMCID: PMC9909149
- DOI: 10.1140/epjp/s13360-023-03732-9
Analyzing the diffusion and duration of antibodies to SARS-CoV-2 during the natural infection and comparison with vaccination
Abstract
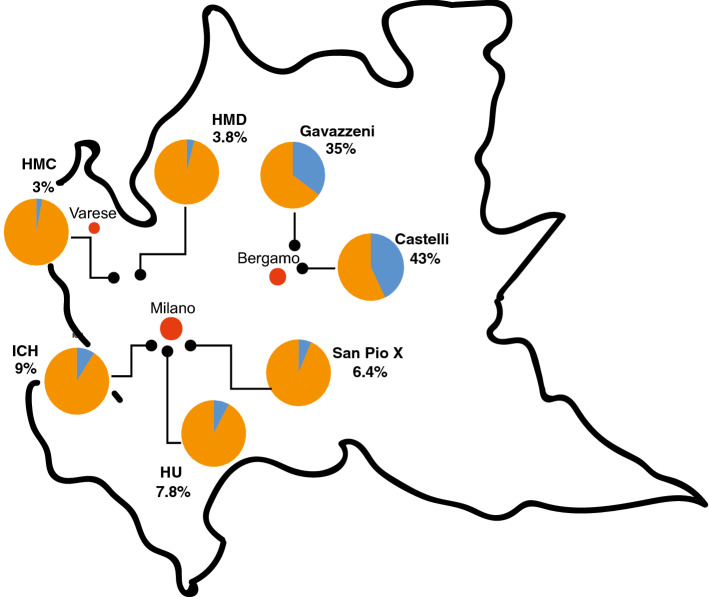
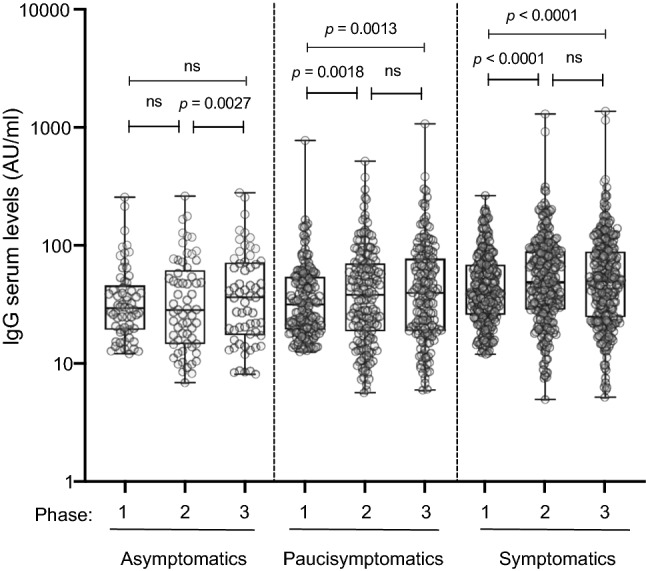
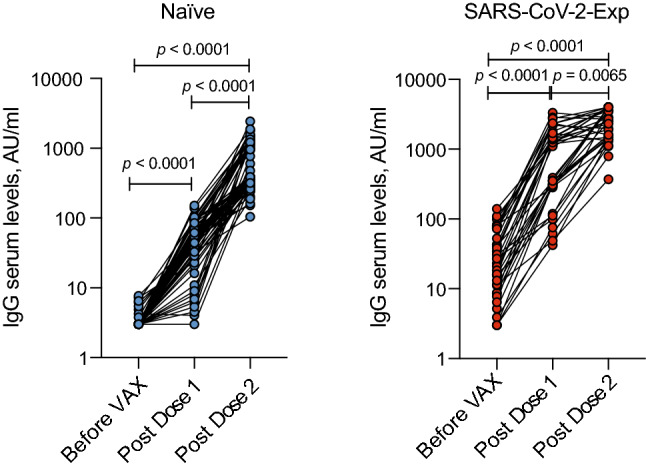
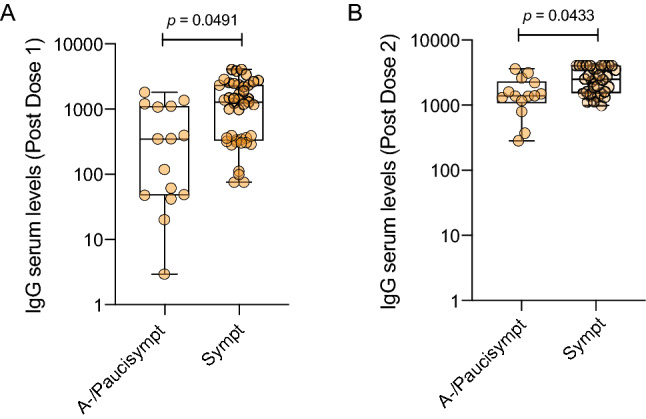
To monitor SARS-CoV-2 diffusion, we measured anti-Spike S1/S2 IgGs in the serum of nearly 4000 workers employed in several healthcare facilities for one year. We found that the antibody response persists at least over 8 months in symptomatic subjects, particularly in individuals with anosmia/dysgeusia. Moreover, analyzing a smaller cohort (124 healthcare employees of which 57 had a previous history of SARS-CoV-2 exposure) vaccinated with two doses of Comirnaty vaccine, we observed that in symptomatic subjects previously exposed to SARS-CoV-2 one dose vaccine was sufficient to stimulate very high levels of antibodies, suggesting that these subjects should take only one dose of vaccine.
© The Author(s), under exclusive licence to Società Italiana di Fisica and Springer-Verlag GmbH Germany, part of Springer Nature 2023, Springer Nature or its licensor (e.g. a society or other partner) holds exclusive rights to this article under a publishing agreement with the author(s) or other rightsholder(s); author self-archiving of the accepted manuscript version of this article is solely governed by the terms of such publishing agreement and applicable law.
Conflict of interest statement
Conflict of interestThe authors declare that they have no conflicts of interest.
Figures
Similar articles
-
Differing kinetics of anti-spike protein IgGs and neutralizing antibodies against SARS-CoV-2 after Comirnaty (BNT162b2) immunization.J Appl Microbiol. 2022 May;132(5):3987-3994. doi: 10.1111/jam.15463. Epub 2022 Feb 6. J Appl Microbiol. 2022. PMID: 35083832
-
[Antibody Response After Two Doses of Inactivated SARS-CoV-2 Vaccine in Healthcare Workers with and without Previous COVID-19 Infection: A Prospective Observational Study].Mikrobiyol Bul. 2022 Jan;56(1):36-48. doi: 10.5578/mb.20229904. Mikrobiyol Bul. 2022. PMID: 35088958 Turkish.
-
Dynamics of Antibody Response to BNT162b2 mRNA COVID-19 Vaccine: A 7-Month Follow-Up Study.Medicina (Kaunas). 2021 Dec 5;57(12):1330. doi: 10.3390/medicina57121330. Medicina (Kaunas). 2021. PMID: 34946275 Free PMC article.
-
Comprehensive characterization of the antibody responses to SARS-CoV-2 Spike protein finds additional vaccine-induced epitopes beyond those for mild infection.Elife. 2022 Jan 24;11:e73490. doi: 10.7554/eLife.73490. Elife. 2022. PMID: 35072628 Free PMC article.
-
A randomized, double-blind, placebo-controlled phase III clinical trial to evaluate the efficacy and safety of SARS-CoV-2 vaccine (inactivated, Vero cell): a structured summary of a study protocol for a randomised controlled trial.Trials. 2021 Apr 13;22(1):276. doi: 10.1186/s13063-021-05180-1. Trials. 2021. PMID: 33849629 Free PMC article.
Cited by
-
Olfactory Epithelium Infection by SARS-CoV-2: Possible Neuroinflammatory Consequences of COVID-19.Complex Psychiatry. 2024 Oct 15;10(1-4):59-70. doi: 10.1159/000540982. eCollection 2024 Jan-Dec. Complex Psychiatry. 2024. PMID: 39545135 Free PMC article. Review.
References
LinkOut - more resources
Full Text Sources
Miscellaneous