

The Slowdown of Growth Rate Controls the Single-Cell Distribution of Biofilm Matrix Production via an SinI-SinR-SlrR Network
- PMID: 36786593
- PMCID: PMC10134886
- DOI: 10.1128/msystems.00622-22
The Slowdown of Growth Rate Controls the Single-Cell Distribution of Biofilm Matrix Production via an SinI-SinR-SlrR Network
Abstract
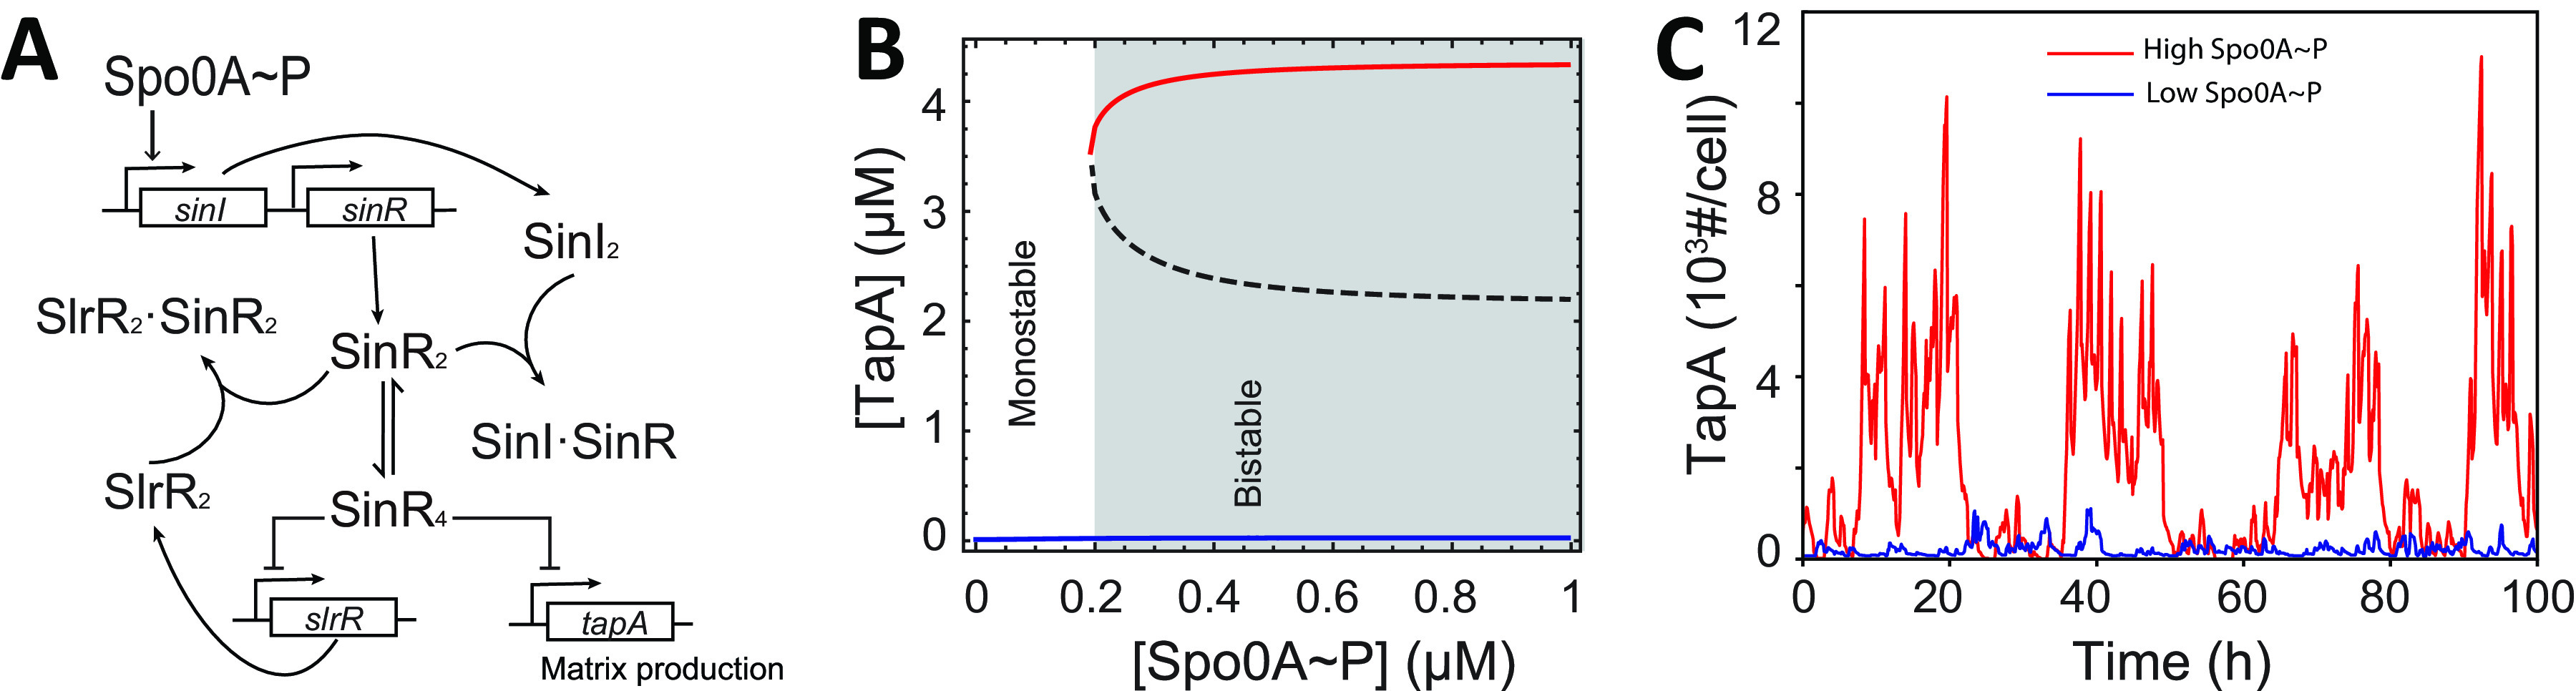
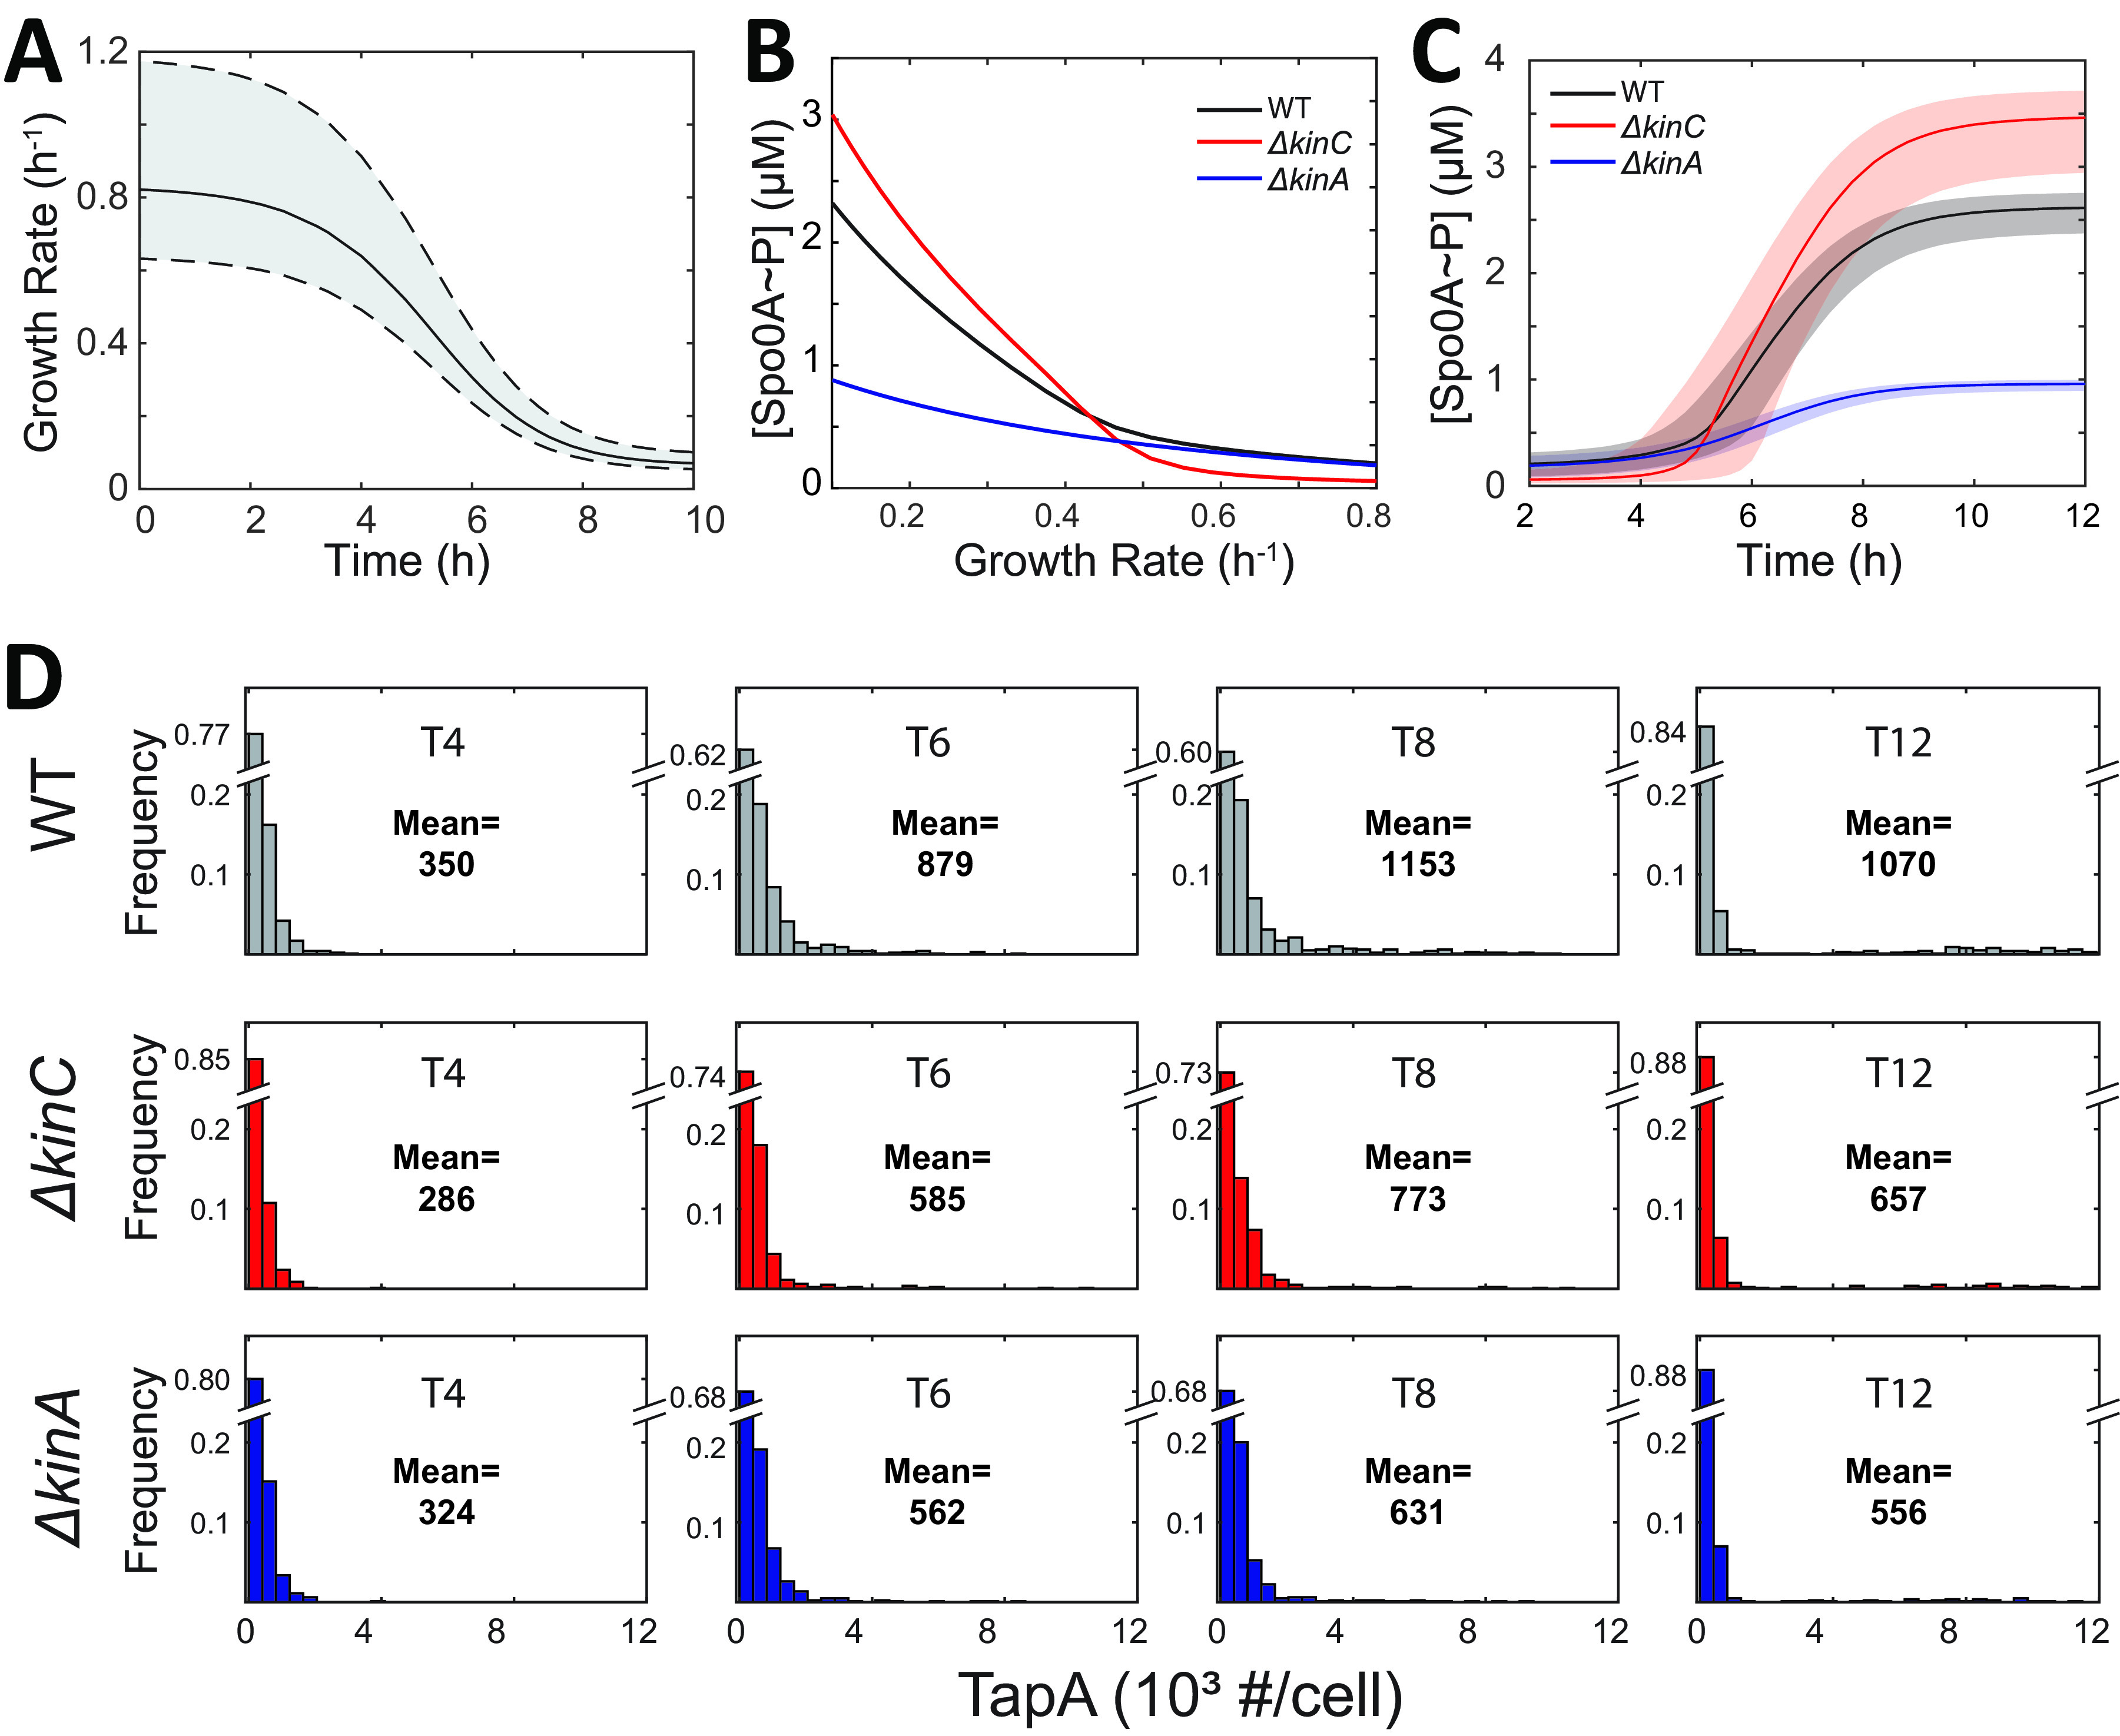
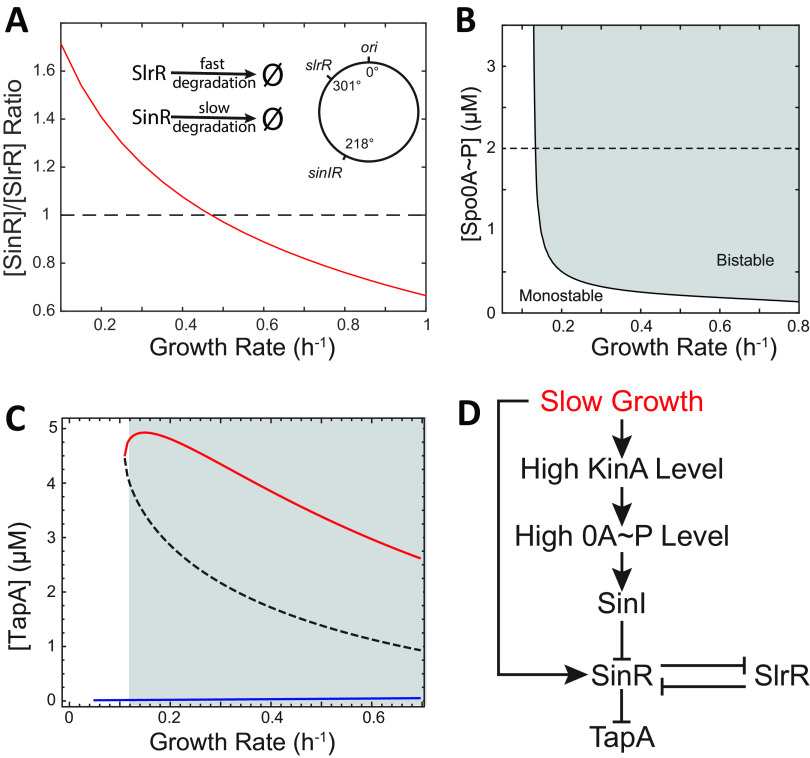
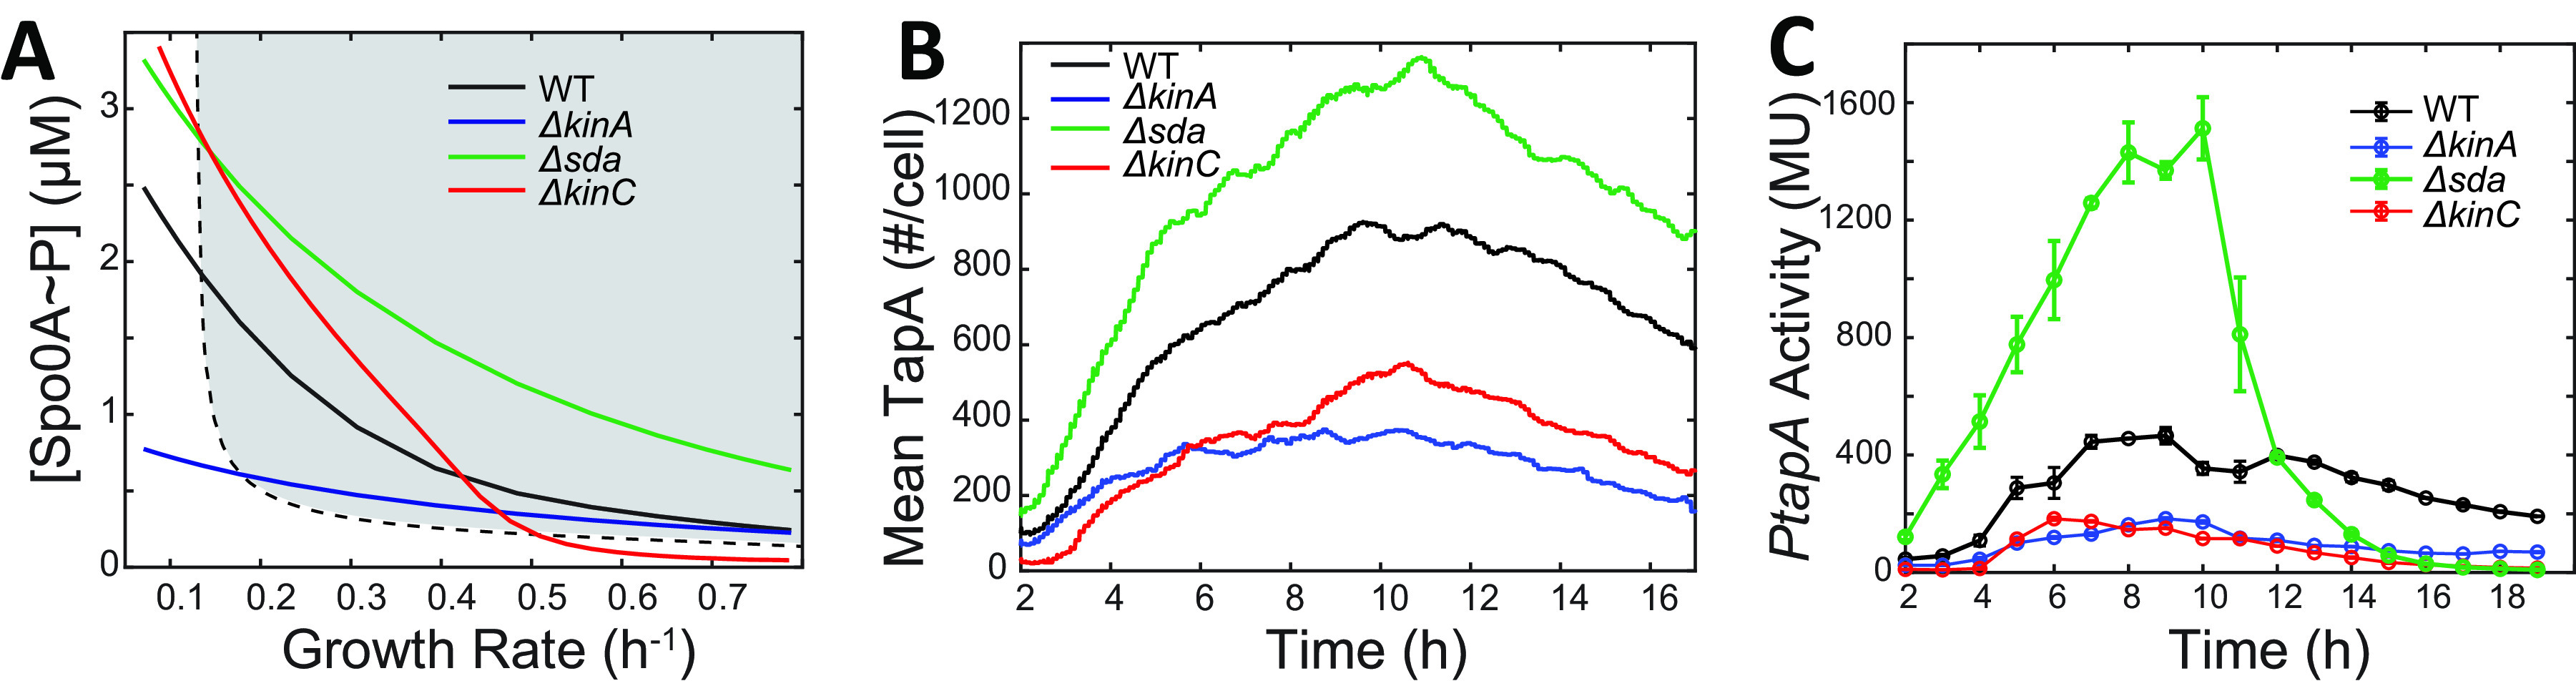
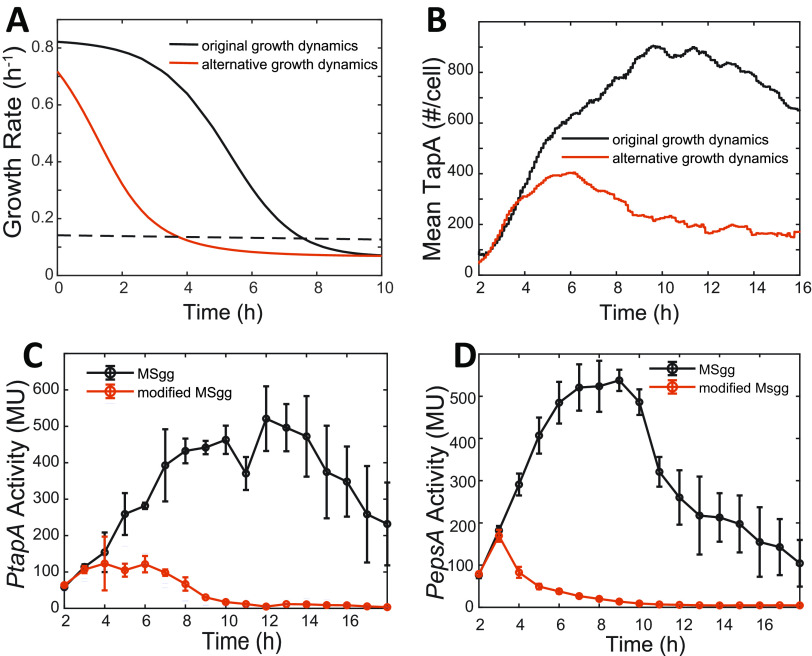
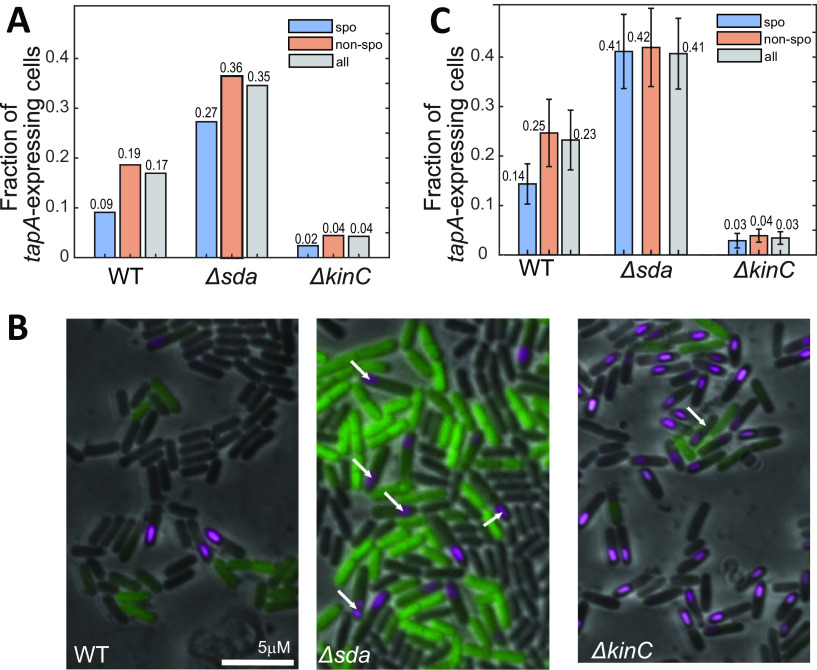
In Bacillus subtilis, master regulator Spo0A controls several cell-differentiation pathways. Under moderate starvation, phosphorylated Spo0A (Spo0A~P) induces biofilm formation by indirectly activating genes controlling matrix production in a subpopulation of cells via an SinI-SinR-SlrR network. Under severe starvation, Spo0A~P induces sporulation by directly and indirectly regulating sporulation gene expression. However, what determines the heterogeneity of individual cell fates is not fully understood. In particular, it is still unclear why, despite being controlled by a single master regulator, biofilm matrix production and sporulation seem mutually exclusive on a single-cell level. In this work, with mathematical modeling, we showed that the fluctuations in the growth rate and the intrinsic noise amplified by the bistability in the SinI-SinR-SlrR network could explain the single-cell distribution of matrix production. Moreover, we predicted an incoherent feed-forward loop; the decrease in the cellular growth rate first activates matrix production by increasing in Spo0A phosphorylation level but then represses it via changing the relative concentrations of SinR and SlrR. Experimental data provide evidence to support model predictions. In particular, we demonstrate how the degree to which matrix production and sporulation appear mutually exclusive is affected by genetic perturbations. IMPORTANCE The mechanisms of cell-fate decisions are fundamental to our understanding of multicellular organisms and bacterial communities. However, even for the best-studied model systems we still lack a complete picture of how phenotypic heterogeneity of genetically identical cells is controlled. Here, using B. subtilis as a model system, we employ a combination of mathematical modeling and experiments to explain the population-level dynamics and single-cell level heterogeneity of matrix gene expression. The results demonstrate how the two cell fates, biofilm matrix production and sporulation, can appear mutually exclusive without explicitly inhibiting one another. Such a mechanism could be used in a wide range of other biological systems.
Keywords: biofilms; biosystems; gene expression; stochasticity.
Conflict of interest statement
The authors declare no conflict of interest.
Figures
Similar articles
-
Bacillus subtilis Histidine Kinase KinC Activates Biofilm Formation by Controlling Heterogeneity of Single-Cell Responses.mBio. 2022 Feb 22;13(1):e0169421. doi: 10.1128/mbio.01694-21. Epub 2022 Jan 11. mBio. 2022. PMID: 35012345 Free PMC article.
-
Regulation of biofilm gene expression by DNA replication in Bacillus subtilis.J Cell Mol Med. 2024 Jun;28(12):e18481. doi: 10.1111/jcmm.18481. J Cell Mol Med. 2024. PMID: 38899542 Free PMC article.
-
The motility-matrix production switch in Bacillus subtilis-a modeling perspective.J Bacteriol. 2024 Jan 25;206(1):e0004723. doi: 10.1128/jb.00047-23. Epub 2023 Dec 13. J Bacteriol. 2024. PMID: 38088582 Free PMC article.
-
The Biofilm Regulatory Network from Bacillus subtilis: A Structure-Function Analysis.J Mol Biol. 2023 Feb 1;435(3):167923. doi: 10.1016/j.jmb.2022.167923. Epub 2022 Dec 16. J Mol Biol. 2023. PMID: 36535428 Review.
-
Generation of multiple cell types in Bacillus subtilis.FEMS Microbiol Rev. 2009 Jan;33(1):152-63. doi: 10.1111/j.1574-6976.2008.00148.x. Epub 2008 Nov 19. FEMS Microbiol Rev. 2009. PMID: 19054118 Review.
Cited by
-
Redefining development in Streptomyces venezuelae: integrating exploration into the classical sporulating life cycle.mBio. 2024 Apr 10;15(4):e0242423. doi: 10.1128/mbio.02424-23. Epub 2024 Mar 12. mBio. 2024. PMID: 38470267 Free PMC article.
-
A model industrial workhorse: Bacillus subtilis strain 168 and its genome after a quarter of a century.Microb Biotechnol. 2023 Jun;16(6):1203-1231. doi: 10.1111/1751-7915.14257. Epub 2023 Apr 1. Microb Biotechnol. 2023. PMID: 37002859 Free PMC article. Review.
-
Biophysical modeling reveals the transcriptional regulatory mechanism of Spo0A, the master regulator in starving Bacillus subtilis.mSystems. 2025 May 20;10(5):e0007225. doi: 10.1128/msystems.00072-25. Epub 2025 Apr 29. mSystems. 2025. PMID: 40298394 Free PMC article.
-
Changes in Spo0A~P pulsing frequency control biofilm matrix deactivation.PLoS Comput Biol. 2025 Jul 7;21(7):e1013263. doi: 10.1371/journal.pcbi.1013263. eCollection 2025 Jul. PLoS Comput Biol. 2025. PMID: 40623113 Free PMC article.
-
Molecular profiling and bioinformatics approaches of biofilm formation in ionizing radiation-resistant Bacillus subtilis, isolated from geothermal spring in Ramsar, the North of Iran.World J Microbiol Biotechnol. 2025 Mar 8;41(3):97. doi: 10.1007/s11274-025-04307-9. World J Microbiol Biotechnol. 2025. PMID: 40055277
References
-
- Storz G, Hengge R. 2011. Bacterial stress responses, second edition. American Society of Microbiology, Washington DC.
Publication types
MeSH terms
Substances
LinkOut - more resources
Full Text Sources
Molecular Biology Databases
