. 2023 Apr 3;222(4):e202204093.
doi: 10.1083/jcb.202204093. Epub 2023 Feb 14.

Quantifying organellar ultrastructure in cryo-electron tomography using a surface morphometrics pipeline

Affiliations

Quantifying organellar ultrastructure in cryo-electron tomography using a surface morphometrics pipeline

Benjamin A Barad et al. J Cell Biol. .

Abstract

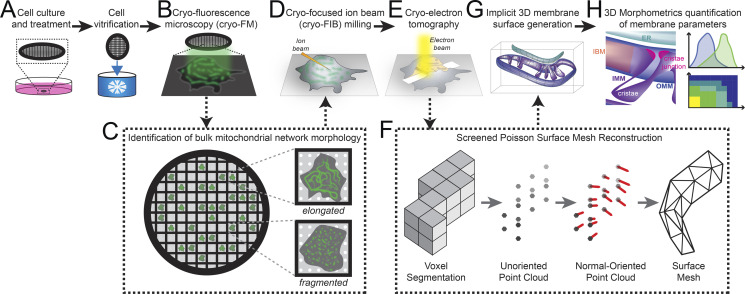
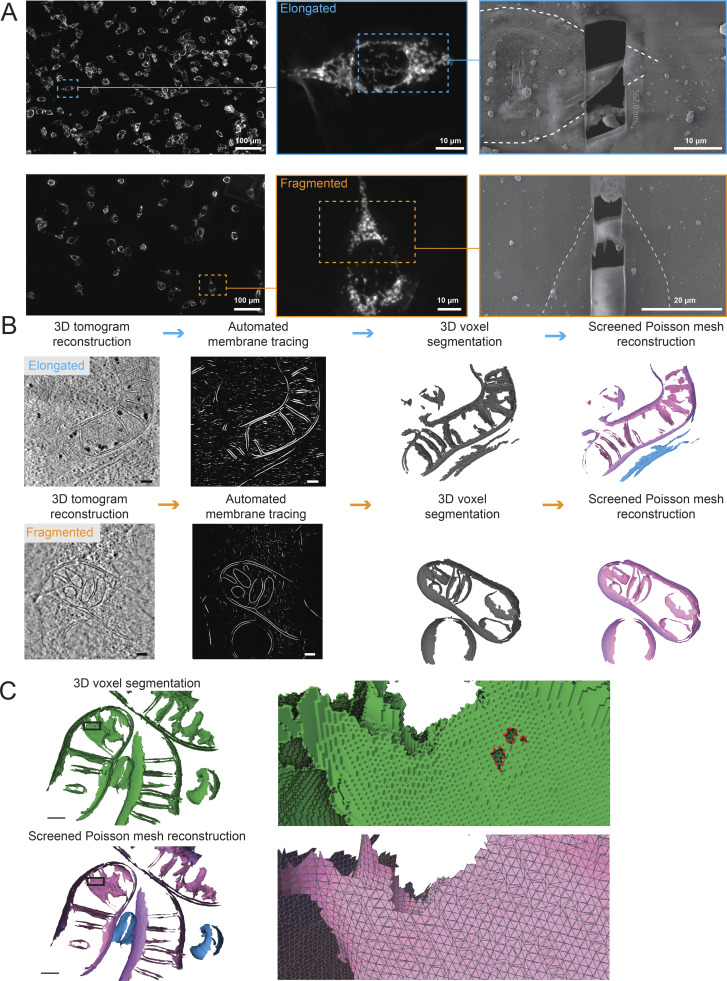
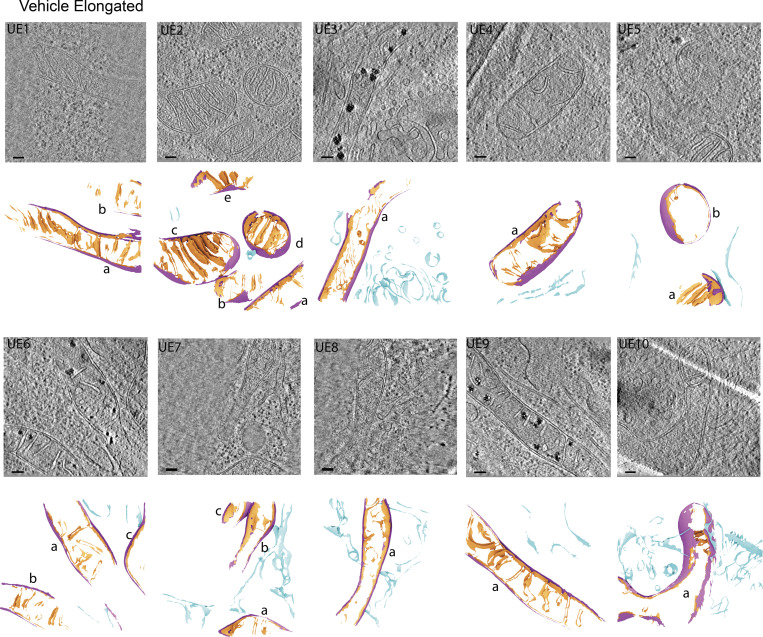
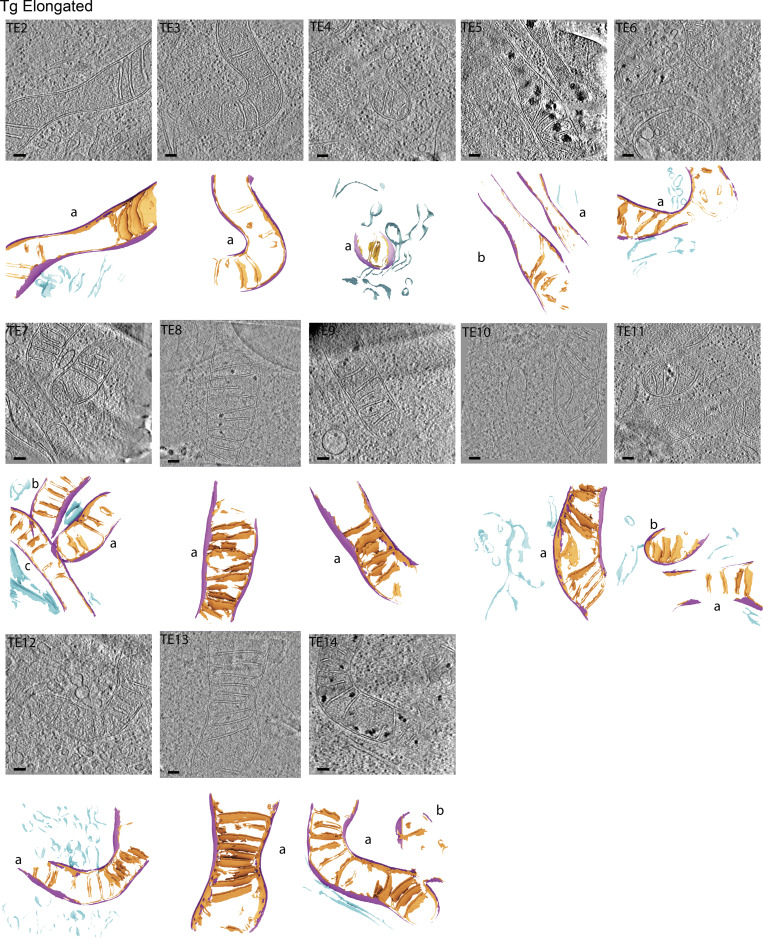
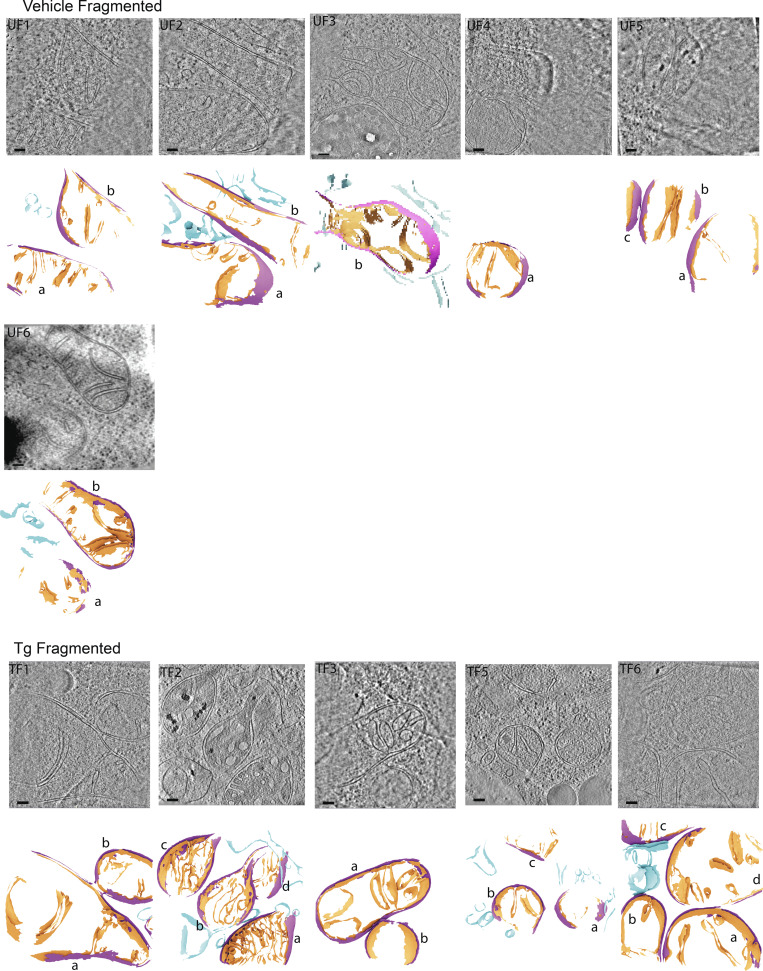
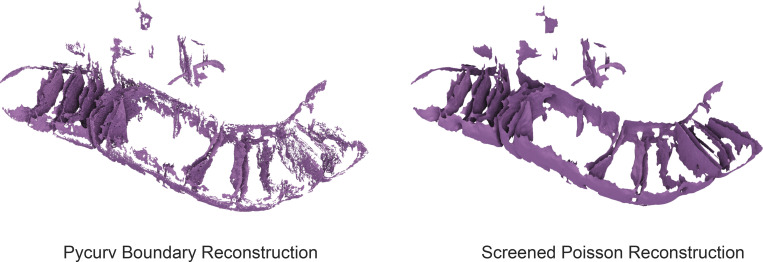
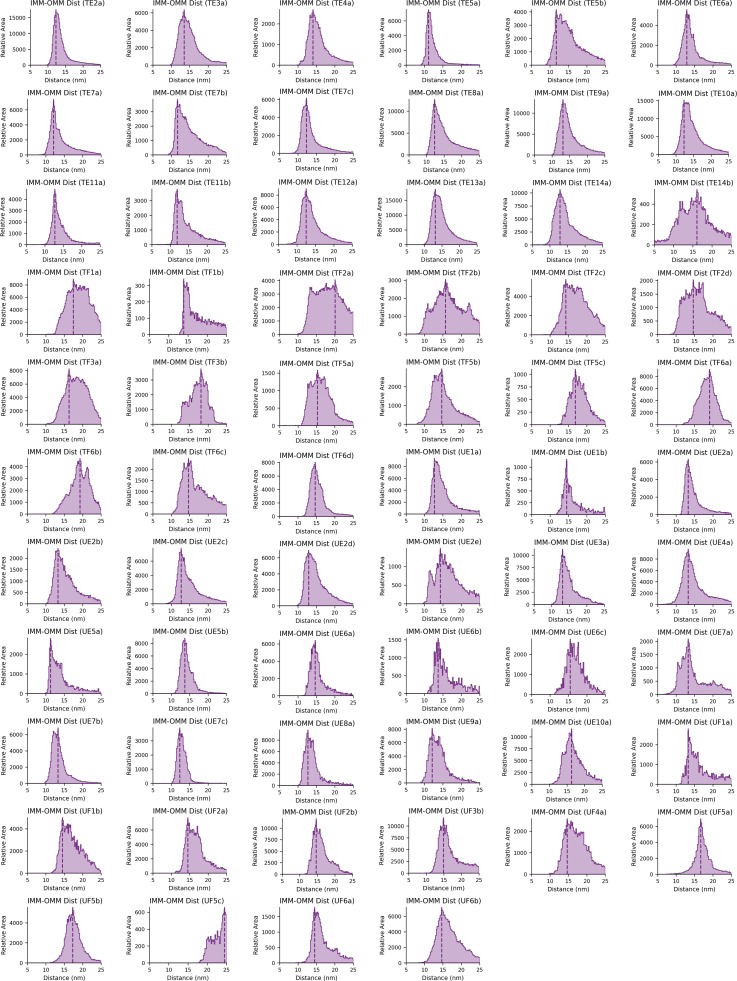
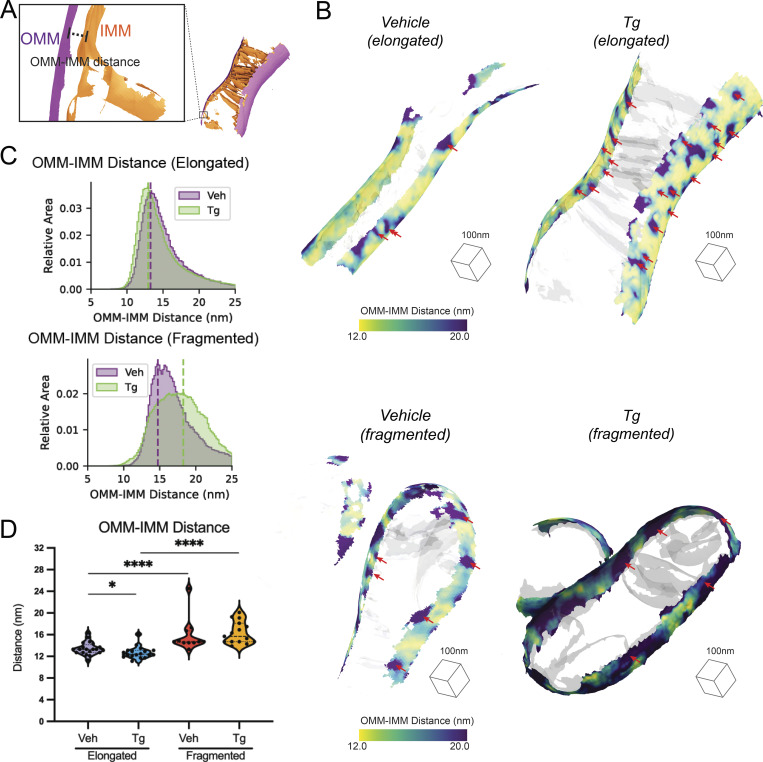
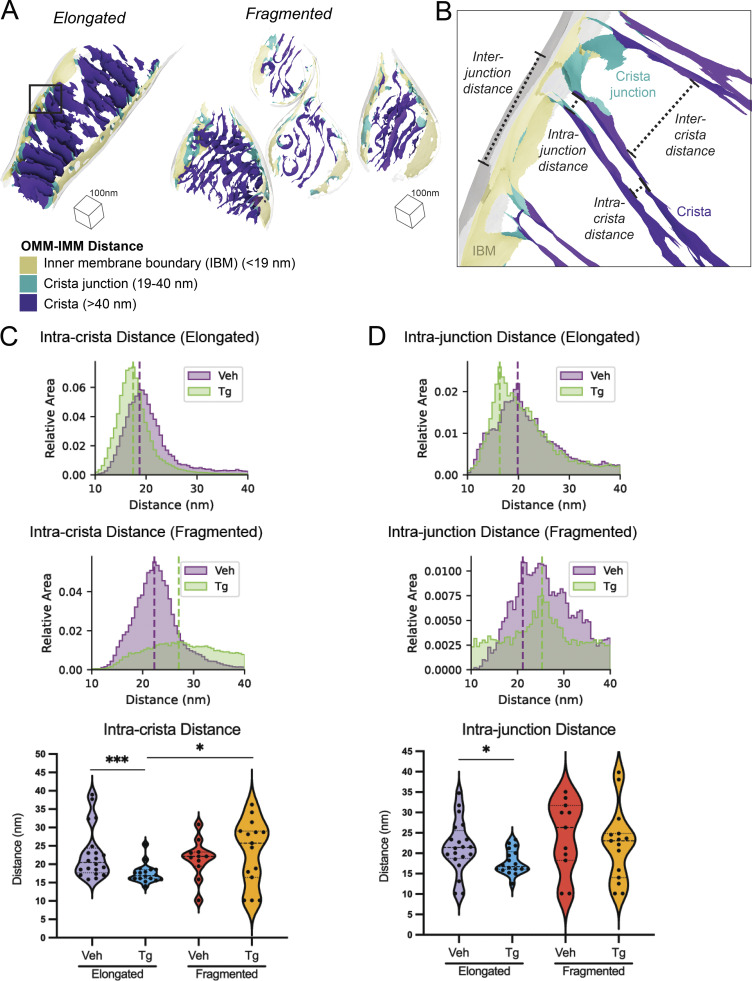
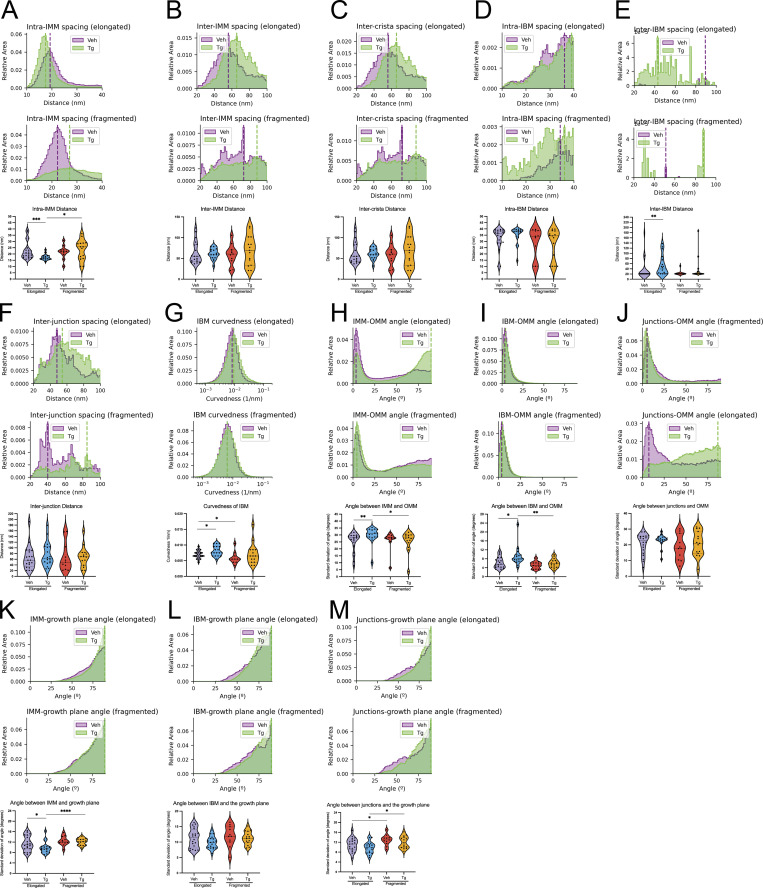
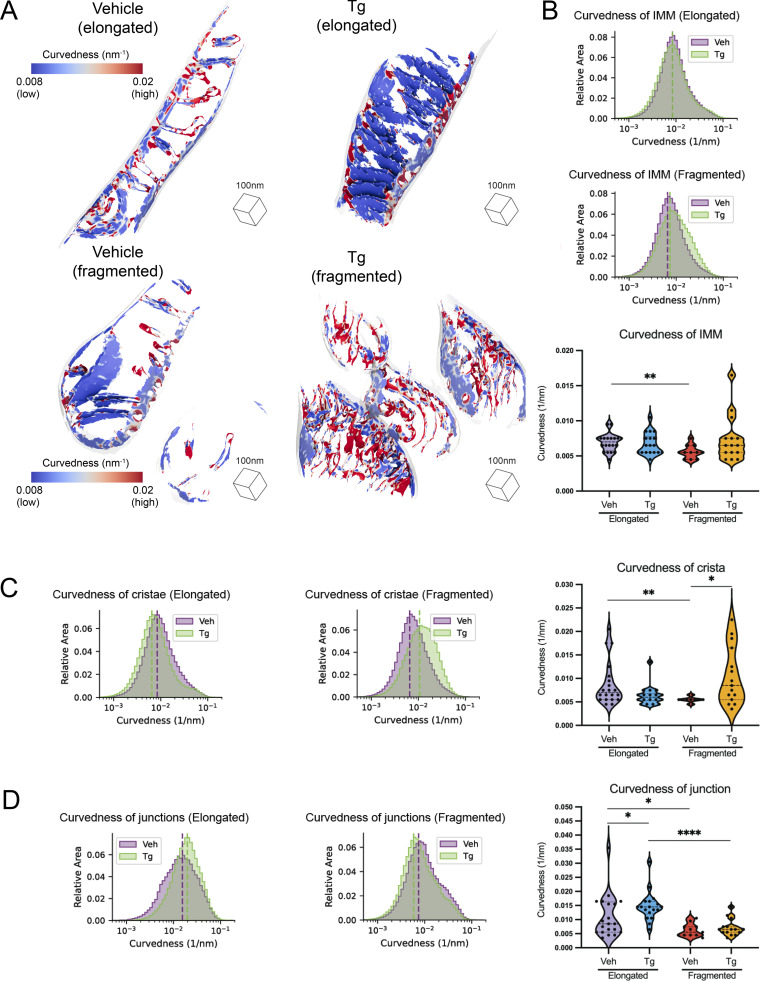
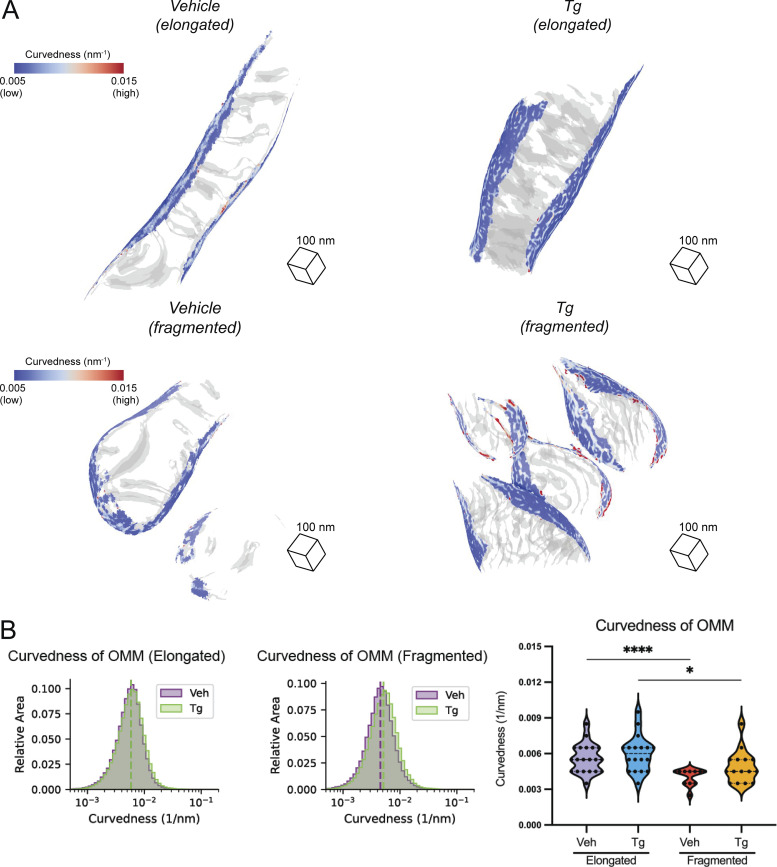
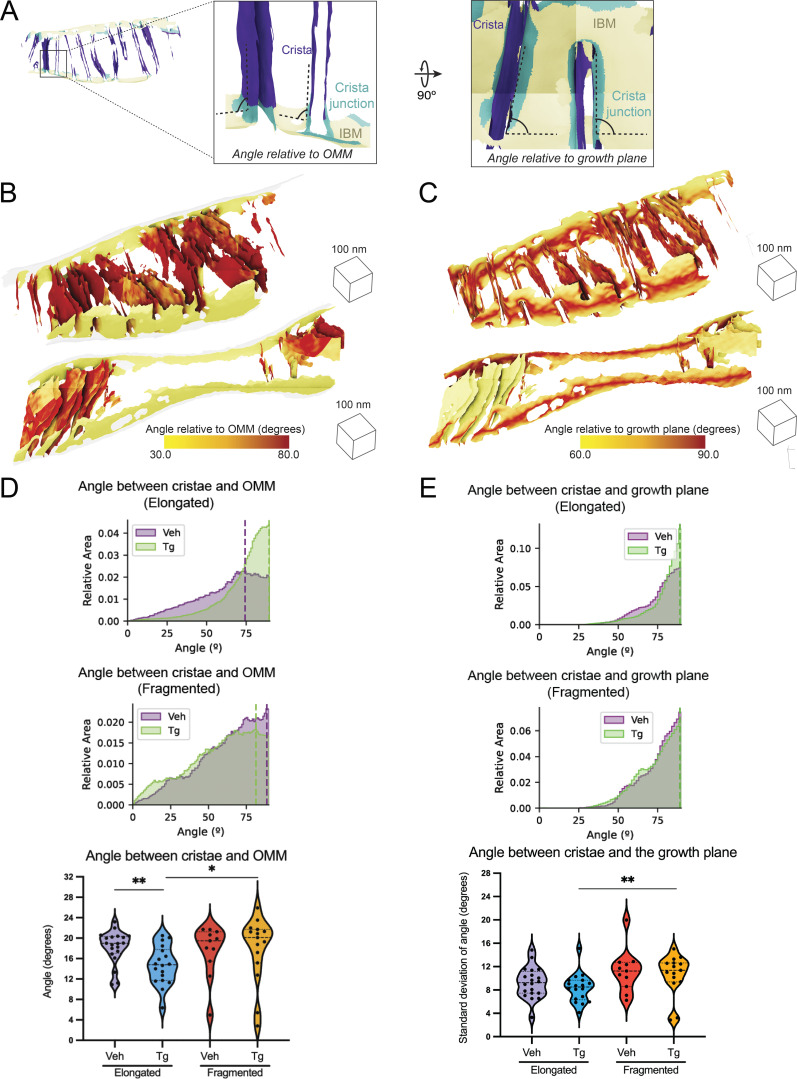
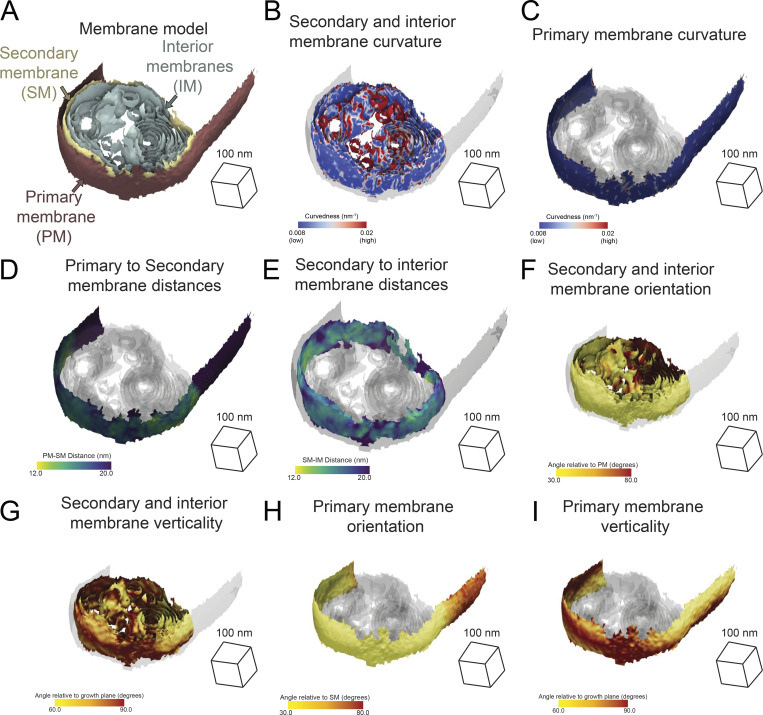
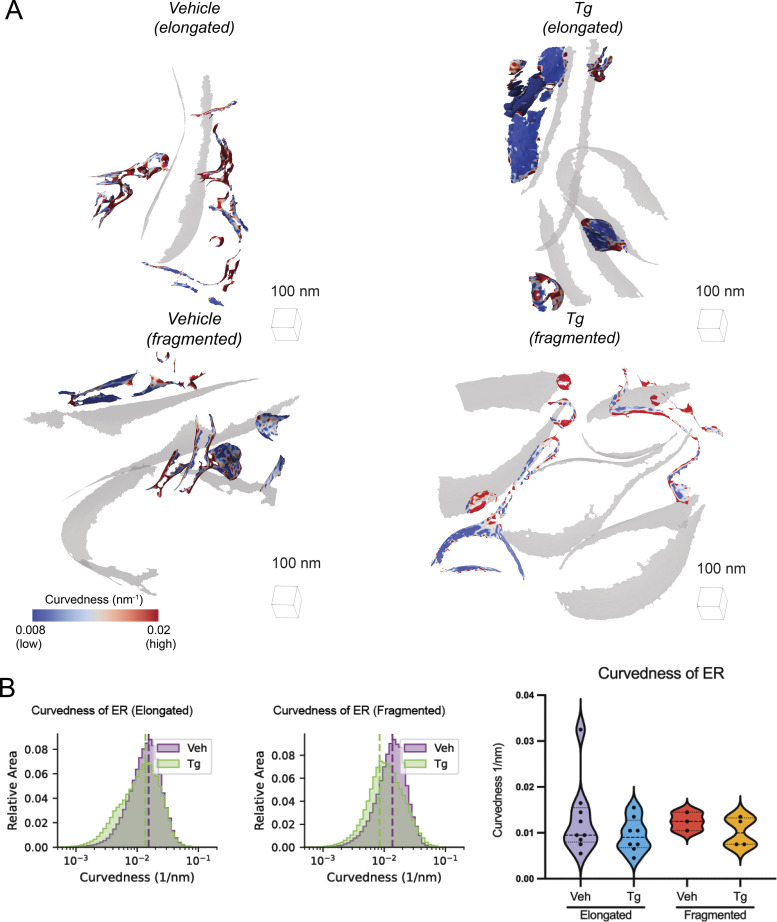
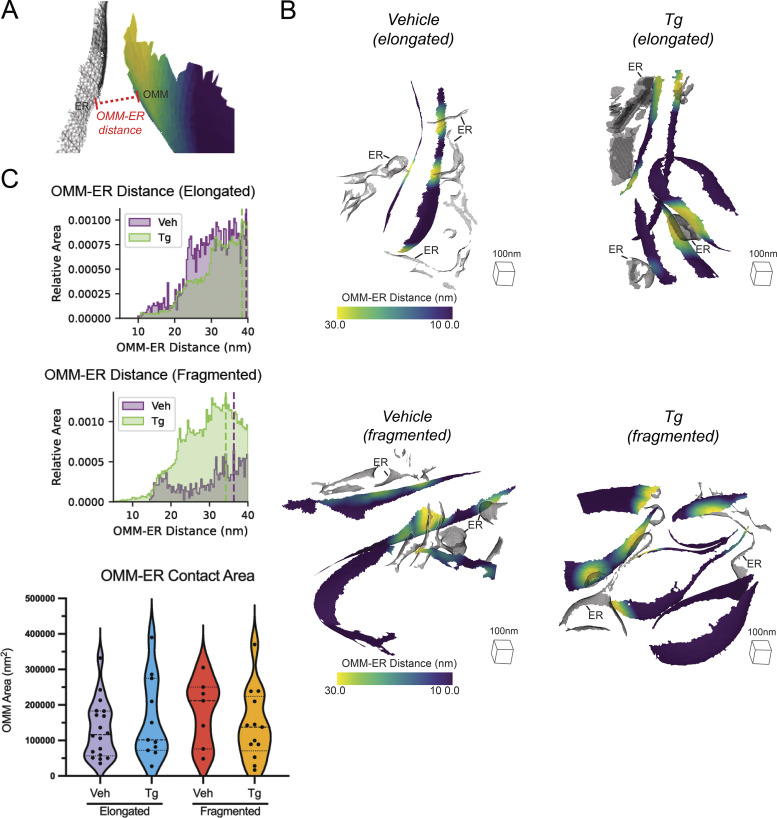
Cellular cryo-electron tomography (cryo-ET) enables three-dimensional reconstructions of organelles in their native cellular environment at subnanometer resolution. However, quantifying ultrastructural features of pleomorphic organelles in three dimensions is challenging, as is defining the significance of observed changes induced by specific cellular perturbations. To address this challenge, we established a semiautomated workflow to segment organellar membranes and reconstruct their underlying surface geometry in cryo-ET. To complement this workflow, we developed an open-source suite of ultrastructural quantifications, integrated into a single pipeline called the surface morphometrics pipeline. This pipeline enables rapid modeling of complex membrane structures and allows detailed mapping of inter- and intramembrane spacing, curvedness, and orientation onto reconstructed membrane meshes, highlighting subtle organellar features that are challenging to detect in three dimensions and allowing for statistical comparison across many organelles. To demonstrate the advantages of this approach, we combine cryo-ET with cryo-fluorescence microscopy to correlate bulk mitochondrial network morphology (i.e., elongated versus fragmented) with membrane ultrastructure of individual mitochondria in the presence and absence of endoplasmic reticulum (ER) stress. Using our pipeline, we demonstrate ER stress promotes adaptive remodeling of ultrastructural features of mitochondria including spacing between the inner and outer membranes, local curvedness of the inner membrane, and spacing between mitochondrial cristae. We show that differences in membrane ultrastructure correlate to mitochondrial network morphologies, suggesting that these two remodeling events are coupled. Our pipeline offers opportunities for quantifying changes in membrane ultrastructure on a single-cell level using cryo-ET, opening new opportunities to define changes in ultrastructural features induced by diverse types of cellular perturbations.


Conflict of interest statement

Disclosures: The authors declare no competing interests exist.

Figures

Figure 1.
Figure 1.
Correlative cellular cryo-ET workflow for robust quantitative analysis of membrane ultrastructures between distinct mitochondrial network morphologies and treatment conditions. (A) MEFmtGFP cells were cultured on transmission EM grids (black mesh circle) and treated with vehicle or Tg (500 nM) for 8 h prior to vitrification via plunge freezing in ethane/propane mixture. (B) Vitrified MEFmtGFP cells were imaged using cryo-fluorescence microscopy (cryo-FM). (C) Cryo-FM facilitated the identification of single cells with distinct elongated or fragmented bulk mitochondrial network morphologies. (D) These cells were targeted for cryo-FIB milling to generate thin sections (lamellae). (E) Lamella were imaged using standard cryo-ET imaging parameters to generate tilt series that were further reconstructed to generate 3D cryo-tomograms. (F) Voxel segmentations labeling distinct cellular membranes were generated using a semiautomated approach (Martinez-Sanchez et al., 2014) prior to conversion to point clouds. Next, a normal-oriented vector is estimated for each point (Cignoni et al., 2008). Normal-oriented point clouds were used to generate surface meshes using a novel application of a screened Poisson reconstruction method followed by masking to the original voxel segmentation (Kazhdan and Hoppe, 2013; Cignoni et al., 2008). (G) Surface meshes model the implicit 3D ultrastructure of distinct organellar membranes. Surface coloring: IMM, purple; OMM, blue; ER, teal. (H) Implicit geometries encoded within surface meshes are then used to perform 3D morphometrics to quantify several parameters that define membrane ultrastructure across mitochondria from distinct morphological and treatment conditions.
Figure 2.
Figure 2.
Application of correlative workflow to visualize cellular membrane ultrastructures in elongated and fragmented mitochondrial networks in MEFmtGFP cells. (A) Identification by cryo-FM of elongated (top; cyan outline) and fragmented (bottom; orange outline) mitochondrial morphologies from mixed populations of MEFmtGFP cells. Cryo-FM images of bulk mitochondrial morphology are then used for targeted cryo-FIB milling to generate thin lamellae of 95–233 nm. MEFmtGFP cell periphery is outlined in dashed white line. (B) Virtual slides of tomograms of MEFmtGFP cells containing elongated (top) and fragmented (bottom) mitochondria are traced using the automated TomoSegMemTV program (Martinez-Sanchez et al., 2014), followed by manual cleanup using AMIRA software to generate 3D voxel segmentations. 3D voxel segmentations are then converted into implicit surface meshes using the screened Poisson mesh reconstruction. Scale bars = 100 nm. Surface coloring: IMM in pink, OMM in purple, ER in blue. (C) Detailed views of voxel (green) and triangle surface mesh (IMM: pink, OMM: purple, ER: blue) show the improved smoothness and hole-filling of surfaces generated with the screened Poisson mesh approach. Zoomed insets are rotated backward 20° to highlight features. Holes are outlined in red on the voxel segmentation.
Figure S1.
Figure S1.
Gallery of cellular membranes used for downstream quantifications from cells with elongated mitochondrial networks in the absence of ER stress. Virtual slices of tomograms (upper panels) and corresponding reconstructed surface mesh models (lower panels) of mitochondrial membranes (IMM, orange; OMM, purple) and ER membranes (blue). The surfaces (lower panels) are labeled according to treatment conditions (U, untreated/vehicle-treated), mitochondrial morphology (E, elongated), and tomogram number. For example, “UE1” is untreated, elongated, tomogram 1. Individual mitochondria in the tomograms are labeled by letters (e.g., a, b, c). These labels correspond to the title labels of the histograms of individual mitochondria shown in Fig. S5. Meshes have been tilted backward by 20° for visualization. Scale bar = 100 nm. Vehicle-treated cells with elongated mitochondrial networks, n = 10 tomograms.
Figure S2.
Figure S2.
Gallery of cellular membranes used for downstream quantifications from cells with elongated mitochondrial networks in the presence of ER stress. Virtual slices of tomograms (upper panels) and corresponding reconstructed surface mesh models (lower panels) of mitochondrial membranes (IMM, orange; OMM, purple) and ER membranes (blue). The surfaces (lower panels) are labeled according to treatment conditions (U, untreated/vehicle-treated), mitochondrial morphology (E, elongated), and tomogram number. For example, “TE1” is Tg-treated, elongated, tomogram 1. Individual mitochondria in the tomograms are labeled by letters (e.g., a, b, c). These labels correspond to the title labels of the histograms of individual mitochondria shown in Fig. S5. Meshes have been tilted backward by 20° for visualization. Scale bar = 100 nm. Tg-treated cells  with elongated mitochondrial networks, n = 13 tomograms.
Figure S3.
Figure S3.
Gallery of cellular membranes used for downstream quantifications from cells with fragmented mitochondrial networks in the absence and presence of ER stress. Virtual slices of tomograms (upper panels) and corresponding reconstructed surface mesh models (lower panels) of mitochondrial membranes (IMM, orange; OMM, purple) and ER membranes (blue). The surfaces (lower panels) are labeled according to treatment conditions (U, untreated/vehicle-treated), mitochondrial morphology (E, elongated), and tomogram number. For example, “TF1” is Tg-treated, fragmented, tomogram 1. Individual mitochondria in the tomograms are labeled by letters (e.g., a, b, c). These labels correspond to the title labels of the histograms of individual mitochondria shown in Fig. S5. Meshes have been tilted backward by 20° for visualization. Scale bar = 100 nm. Vehicle-treated cells with fragmented mitochondrial networks, n = 6 tomograms; and Tg-treated cells with fragmented mitochondrial networks, n = 5 tomograms.
Figure S4.
Figure S4.
Comparison of surface reconstruction algorithms. The same IMM segmentation was subjected to the boundary segmentation surface reconstruction algorithm used in the pycurv software (Salfer et al., 2020; Hoppe et al., 1992; left) as well as our new reconstruction approach based on the screened Poisson algorithm (Kazhdan and Hoppe, 2013; right) show the improvements in smoothness and completeness enabled by the new surface reconstruction algorithm. While the left algorithm was made part of the pycurv software, it was not used for extensive analysis in the cited manuscript, in favor of algorithms using compartment segmentations.
Figure S5.
Figure S5.
Gallery of IMM–OMM distance histograms for individual mitochondria. The distribution of distances between the IMM and OMM was plotted for each mitochondrion individually for all Tg-treated, elongated (TE), Tg-treated, fragmented (TF), vehicle (i.e., untreated), elongated (UE), and vehicle (i.e., untreated), fragmented (UF). The peak position is plotted for each and is used for the violin plot in Fig. 3 D. The histograms are titled based on the measurement (i.e., IMM-IMM Dist) and correspond to the treatment conditions, morphologies, and individual mitochondria labels shown in Fig. S1 (e.g., “TE2a” corresponds to a Tg-treated [T], elongated [E], tomogram “2,” mitochondrion labeled “a”).
Figure 3.
Figure 3.
Distance between IMMs and OMMs is dependent on mitochondrial network morphology and presence or absence of ER stress. (A) Surface membrane reconstruction defining OMM (purple) and IMM (orange) distance measurement. (B) Representative membrane surface reconstructions of elongated (top) and fragmented (bottom) mitochondria in MEFmtGFP cells treated with vehicle and Tg (500 nM, 8 h). The OMM surface is colored by outer-to-inner (OMM–IMM) membrane distance, and the IMM surface is shown in transparent gray. Red arrows indicate regions on OMM with large OMM–IMM distances that correspond to cristae junctions. (C) Combined histogram of OMM–IMM distances of elongated (top) and fragmented (bottom) mitochondria in MEFmtGFP cells treated with vehicle and Tg. Dashed vertical lines correspond to peak histogram values of pooled data. (D) Quantification of peak histogram values from each mitochondrion within the indicated treatment and mitochondrial morphology class. Quantifications from vehicle elongated n = 20, Tg elongated n = 18, vehicle fragmented n = 11, and Tg fragmented n = 15 mitochondria are shown. P values from Mann–Whitney U test are indicated. *P < 0.05; ****P < 0.001.
Figure 4.
Figure 4.
Spacing within and between mitochondrial cristae is differentially altered by Tg-induced ER stress in fragmented and elongated populations. (A) Representative membrane surface reconstructions of elongated (left) and fragmented (right) mitochondria in MEFmtGFP cells treated with Tg (500 nM, 8 h) showing subdivision of IMM compartments (IBM, tan; junction, cyan; crista, purple) as defined by OMM–IMM distance. The OMM surface is represented as a transparent gray mesh. (B) Enlarged inset of boxed region in elongated example from A showing surface membrane reconstruction colored by inner membrane compartments defining intra- and intercrista and junction measurements. (C) Combined histogram of intracrista membrane distances of elongated (top) and fragmented (middle) mitochondria in MEFmtGFP cells treated with vehicle and Tg. Dashed vertical lines correspond to peak histogram values of pooled data. Graph (bottom) showing peak histogram values from each mitochondrion within each corresponding treatment and mitochondrial morphology class. Quantifications from vehicle elongated n = 20, Tg elongated n = 18, vehicle fragmented n = 11, and Tg fragmented n = 15 mitochondria are shown. P values from Mann–Whitney U test are indicated. *P < 0.05; ***P < 0.005. (D) Combined histogram of intrajunction membrane distances of elongated (top) and fragmented (middle) mitochondria in MEFmtGFP cells treated with vehicle and Tg. Dashed vertical lines correspond to peak histogram values of pooled data. Graph (bottom) showing peak histogram values from each mitochondrion within each corresponding treatment and mitochondrial morphology class. Quantifications from vehicle elongated n = 20, Tg elongated n = 18, vehicle fragmented n = 11, and Tg fragmented n = 15 mitochondria are shown. P values from Mann–Whitney U test are indicated. *P < 0.05.
Figure S6.
Figure S6.
Additional quantifications of membrane ultrastructure. Additional quantifications output by the surface morphometrics pipeline, which showed non-significant changes or no apparent change. In all cases, quantifications from vehicle elongated n = 20, Tg elongated n = 18, vehicle fragmented n = 11, and Tg fragmented n = 15 mitochondria are shown. (A) Histograms and violin plot showing changes to spacing between closest neighbor segments of IMM. (B) Histograms and violin plot showing changes to spacing to the second nearest segments of IMM. (C) Histograms and violin plot showing changes to spacing between neighboring cristae. (D) Histograms and violin plot showing changes to spacing between closest neighbor segments of IBM. (E) Histograms and violin plot showing changes to spacing to the second nearest segments of IBM. (F) Histograms and violin plot showing changes to spacing between neighboring junctions. (G) Histograms and violin plot showing changes to curvedness of the IBM. (H) Histograms and violin plot showing changes to the angle between IMM and OMM. (I) Histograms and violin plot showing changes to the angle between IBM and OMM. (J) Histograms and violin plot showing changes to the angle between crista junctions and OMM. (K) Histograms and violin plot showing changes to the angle between IMM and the growth plane. (L) Histograms and violin plot showing changes to the angle between IBM and the growth plane. (M) Histograms and violin plot showing changes to the angle between crista junctions and the growth plane. *P < 0.05; **P < 0.01; ***P < 0.005; ****P < 0.001.
Figure 5.
Figure 5.
The curvedness of mitochondrial cristae and crista junctions are dependent both on mitochondrial network morphology and Tg-induced ER stress. (A) Representative membrane surface reconstructions of elongated (top) and fragmented (bottom) mitochondria in MEFmtGFP cells treated with vehicle and Tg (500 nM, 8 h). The IMM surface is colored by membrane curvedness and the OMM surface is represented as a transparent gray mesh. Curvedness is an unsigned combination of the two principal components of curvedness and is used because the surface normal vectors do not have canonical sign. (B) Combined histogram of total IMM curvedness of elongated (top) and fragmented (middle) mitochondria in MEFmtGFP cells treated with vehicle and Tg. Dashed vertical lines correspond to peak histogram values of pooled data. Graph (bottom) showing peak histogram values from each mitochondrion within each corresponding treatment and mitochondrial morphology class. Quantifications from vehicle elongated n = 20, Tg elongated n = 18, vehicle fragmented n = 11, and Tg fragmented n = 15 mitochondria are shown. P values from Mann–Whitney U test are indicated. **P < 0.01. (C) Combined histogram of cristae curvedness of elongated (left) and fragmented (middle) mitochondria in MEFmtGFP cells treated with vehicle and Tg. Dashed vertical lines correspond to peak histogram values of pooled data. Graph (right) showing peak histogram values from each mitochondrion within each corresponding treatment and mitochondrial morphology class. Quantifications from vehicle elongated n = 20, Tg elongated n = 18, vehicle fragmented n = 11, and Tg fragmented n = 15 mitochondria are shown. P values from Mann–Whitney U test are indicated. *P < 0.05; **P < 0.01. (D) Combined histogram of cristae junction curvedness of elongated (left) and fragmented (middle) mitochondria in MEFmtGFP cells treated with vehicle and Tg. Dashed vertical lines correspond to peak histogram values of pooled data. Graph (right) showing peak histogram values from each mitochondrion within each corresponding treatment and mitochondrial morphology class. Quantifications from vehicle elongated n = 20, Tg elongated n = 18, vehicle fragmented n = 11, and Tg fragmented n = 15 mitochondria are shown. P values from Mann–Whitney U test are indicated. *P < 0.05; ****P < 0.001.
Figure S7.
Figure S7.
OMM curvature analysis. (A) Representative membrane surface reconstructions of elongated (top) and fragmented (bottom) mitochondria in MEFmtGFP cells treated with vehicle and Tg (500 nM, 8 h). The OMM surface is colored by membrane curvedness and the IMM surface is represented as a transparent gray mesh. (B) Combined histogram of total OMM curvedness of elongated (left) and fragmented (middle) mitochondria in MEFmtGFP cells treated with vehicle and Tg. Dashed vertical lines correspond to peak histogram values of pooled data. Graph (right) showing peak histogram values from each mitochondrion within each corresponding treatment and mitochondrial morphology class. Quantifications from vehicle elongated n = 20, Tg elongated n = 18, vehicle fragmented n = 11, and Tg fragmented n = 15 mitochondria are shown. *P < 0.05; ****P < 0.001.
Figure 6.
Figure 6.
Tg-induced ER stress drives changes in crista orientation in elongated mitochondrial networks. (A) Surface membrane reconstruction colored by inner membrane compartments (IBM, tan; junction, cyan; crista, purple) defining angular measurements between the surface and the nearest OMM or to the growth plane of the cell. (B) Two representative membrane surface reconstructions of lamellar Tg-treated elongated mitochondria, colored by the angle of IMM relative to OMM. (C) Two representative membrane surface reconstructions of a less rigidly oriented Tg-treated elongated mitochondria, colored by an angle of IMM relative to the growth plane of the cell. (D) Combined histogram of the angle of cristae relative to OMM in elongated (top) and fragmented (middle) mitochondria in MEFmtGFP cells treated with vehicle and Tg. Dashed vertical lines correspond to peak histogram values of pooled data. Graph (bottom) showing distribution of standard deviations within each corresponding treatment and mitochondrial morphology class. Quantifications from vehicle elongated n = 20, Tg elongated n = 18, vehicle fragmented n = 11, and Tg fragmented n = 15 mitochondria are shown. *P < 0.05; **P < 0.01. (E) Combined histogram of the angle of cristae relative to growth plane in elongated (top) and fragmented (middle) mitochondria in MEFmtGFP cells treated with vehicle and Tg. Dashed vertical lines correspond to peak histogram values of pooled data. Graph (bottom) showing distribution of standard deviations within each corresponding treatment and mitochondrial morphology class. Quantifications from vehicle elongated n = 20, Tg elongated n = 18, vehicle fragmented n = 11, and Tg fragmented n = 15 mitochondria are shown. P values from Mann–Whitney U test are indicated. **P < 0.01.
Figure S8.
Figure S8.
Gallery of multilamellar membrane structures used for quantifications. Virtual slices of tomograms (left panels) and corresponding reconstructed surface mesh models (right panels) of multilamellar membrane structures. Primary membrane shown in red. Secondary membrane shown in yellow. Interior membranes shown in sage green. Meshes have been tilted 20° relative to tomography slice for visualization. Scale bar = 100 nm. n = 3 tomograms.
Figure S9.
Figure S9.
Multilamellar membrane structure morphometric analysis. (A) Exemplar multilamellar membrane structure surfaces with membranes labeled. Primary membrane in red. Secondary membrane in yellow. Interior membranes in sage green. (B) Secondary and interior membrane surfaces colored by membrane curvedness; the primary membrane is represented as a transparent gray. (C) Primary surface is colored by membrane curvedness; the secondary and interior membranes are represented as a transparent gray. (D) Primary surface is colored by primary-to-secondary membrane distance; the secondary and interior membrane surfaces are shown in transparent gray. (E) Secondary surface colored by secondary to nearest interior (secondary–interior) membrane distance; the primary and interior membrane surfaces are shown in transparent gray. (F) Secondary and interior membranes surfaces are colored by angle relative to the primary membrane. Primary membrane surface is shown in transparent gray. (G) Secondary and interior membrane surfaces are colored by an angle relative to the growth plane of the cell. Primary membrane surface shown in transparent gray. (H) Primary membrane surface is colored by relative angle to the secondary membrane. Secondary and interior membrane surfaces are shown in transparent gray. (I) Primary membrane surface colored by relative angle to the growth plane of the cell. Secondary and interior membranes are shown in transparent gray.
Figure S10.
Figure S10.
ER membrane curvature analysis. (A) Representative membrane surface reconstructions of the ER in MEFmtGFP cells treated with vehicle and Tg (500 nM, 8 h) and associated with defined mitochondrial populations (elongated and fragmented). The ER surface is colored by membrane curvedness, and the OMM surface is represented as a transparent gray mesh. (B) Combined histograms of total ER curvedness of elongated (left) and fragmented (middle) mitochondria in MEFmtGFP cells treated with vehicle and Tg. Dashed vertical lines correspond to peak histogram values of pooled data. Graph (right) showing peak histogram values from each ER membrane within each corresponding treatment and mitochondrial morphology class. Quantifications from vehicle elongated n = 9, Tg elongated n = 8, vehicle fragmented n = 3, and Tg fragmented n = 4 ER are shown.
Figure S11.
Figure S11.
Surface analysis of mitochondria–ER contact sites. (A) Surface membrane reconstruction defining OMM (blue-yellow gradient) and ER (transparent mesh) distance measurement. (B) Representative membrane surface reconstructions of elongated (top) and fragmented (bottom) mitochondria in MEFmtGFP cells treated with vehicle and Tg (500 nM) colored by OMM to ER (OMM–ER) membrane distance. (C) Combined histogram of OMM–ER distances of elongated (top) and fragmented (bottom) mitochondria in MEFmtGFP cells treated with vehicle and Tg. Dashed vertical lines correspond to peak histogram values of pooled data. (D) Graph showing peak histogram values from each tomogram within each corresponding treatment and mitochondrial morphology class. Quantifications from vehicle elongated n = 18, Tg elongated n = 11, vehicle fragmented n = 7, Tg fragmented n = 13 mitochondria are shown.

References

    1. Aaltonen, M.J., Friedman J.R., Osman C., Salin B., di Rago J.-P., Nunnari J., Langer T., and Tatsuta T.. 2016. MICOS and phospholipid transfer by Ups2-Mdm35 organize membrane lipid synthesis in mitochondria. J. Cell Biol. 213:525–534. 10.1083/jcb.201602007 - DOI - PMC - PubMed
    1. Ader, N.R., Hoffmann P.C., Ganeva I., Borgeaud A.C., Wang C., Youle R.J., and Kukulski W.. 2019. Molecular and topological reorganizations in mitochondrial architecture interplay during Bax-mediated steps of apoptosis. Elife. 8:e40712. 10.7554/eLife.40712 - DOI - PMC - PubMed
    1. Ahrens, J., Geveci B. and Law C.. 2005. Paraview: An end-user tool for large data visualization. Visual. Handb. 717. 10.1016/B978-012387582-2/50038-1 - DOI
    1. Albert, S., Wietrzynski W., Lee C.-W., Schaffer M., Beck F., Schuller J.M., Salomé P.A., Plitzko J.M., Baumeister W., and Engel B.D.. 2020. Direct visualization of degradation microcompartments at the ER membrane. Proc. Natl. Acad. Sci. USA. 117:1069–1080. 10.1073/pnas.1905641117 - DOI - PMC - PubMed
    1. Barad, B. 2023. TFS Autoscript Tools. Zenodo. 10.5281/zenodo.7576550 - DOI

Publication types

MeSH terms