. 2023 Feb 14;16(772):eabq7842.
doi: 10.1126/scisignal.abq7842. Epub 2023 Feb 14.

Catalytic site mutations confer multiple states of G protein activation

Affiliations

Catalytic site mutations confer multiple states of G protein activation

Natalie Hewitt et al. Sci Signal. .

Abstract

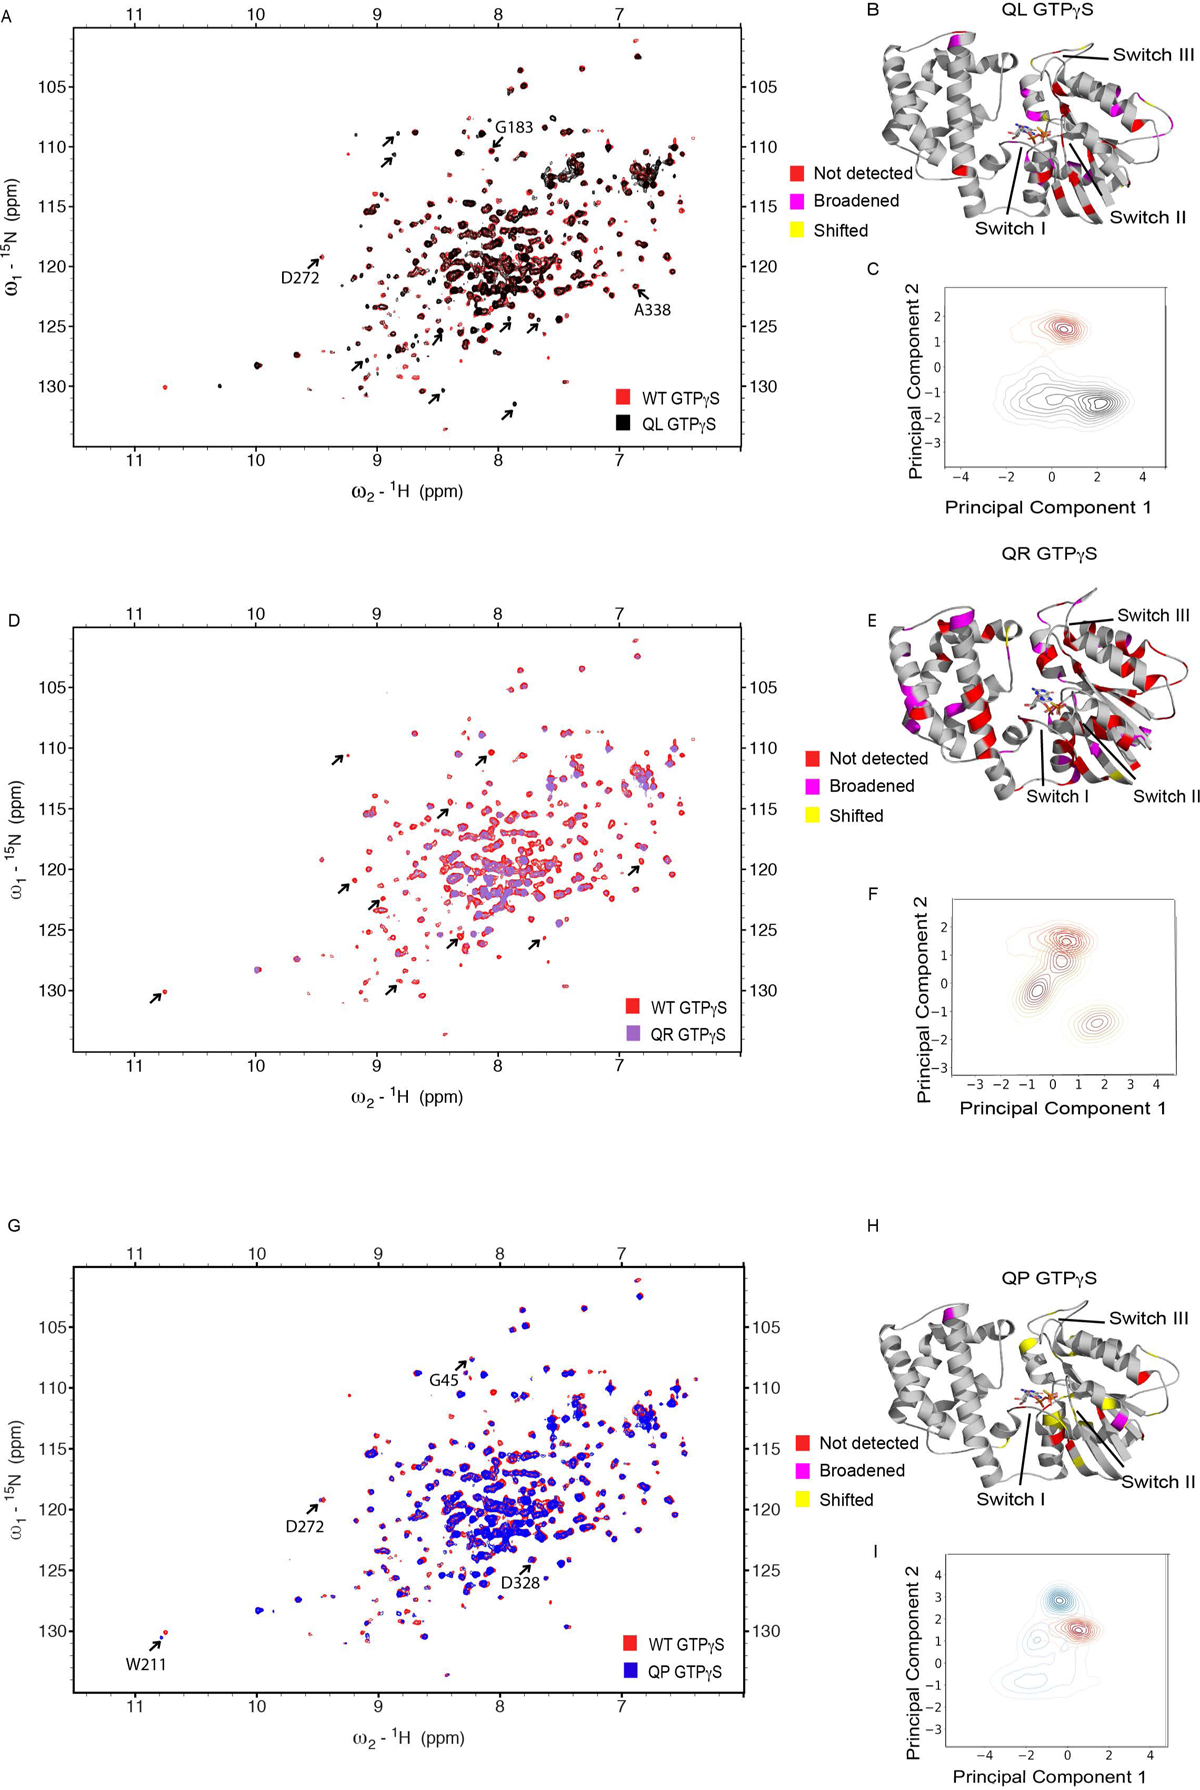
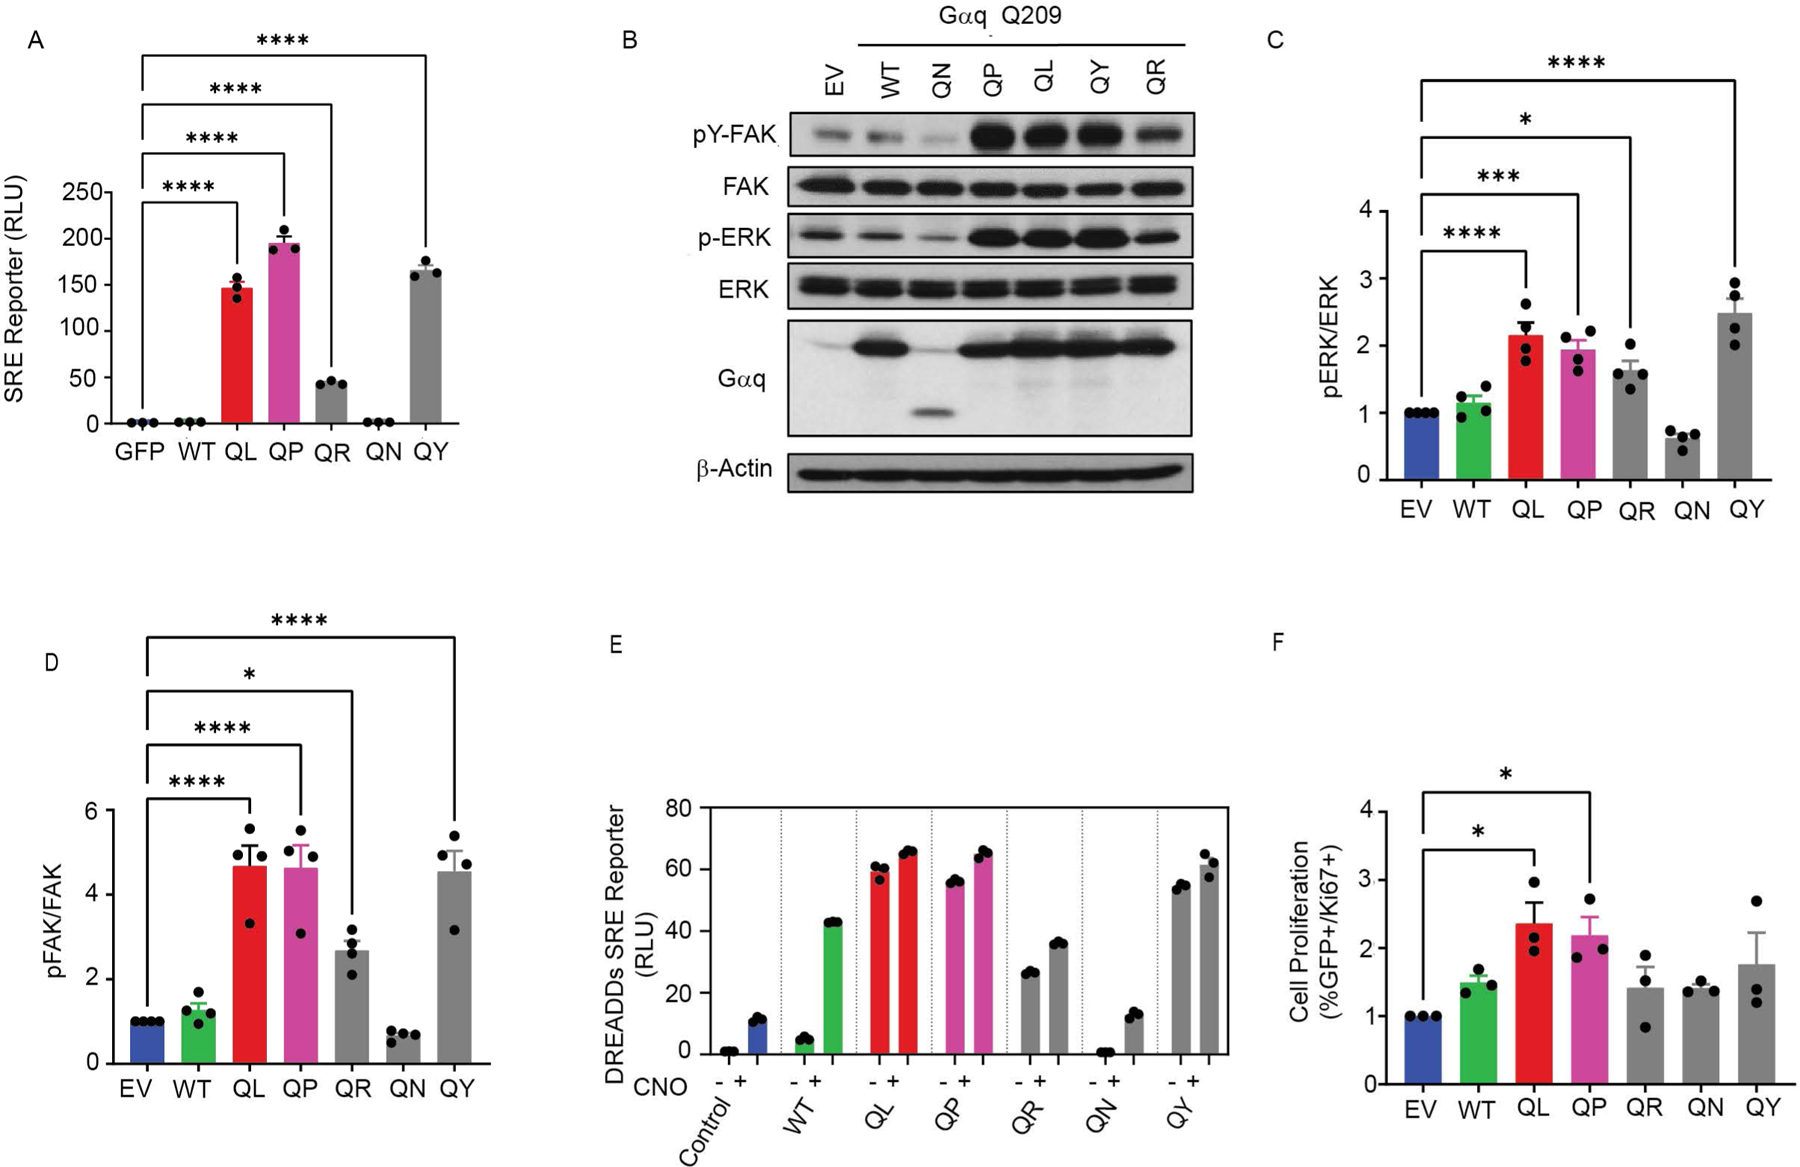
Heterotrimeric guanine nucleotide-binding proteins (G proteins) that function as molecular switches for cellular growth and metabolism are activated by GTP and inactivated by GTP hydrolysis. In uveal melanoma, a conserved glutamine residue critical for GTP hydrolysis in the G protein α subunit is often mutated in Gαq or Gα11 to either leucine or proline. In contrast, other glutamine mutations or mutations in other Gα subtypes are rare. To uncover the mechanism of the genetic selection and the functional role of this glutamine residue, we analyzed all possible substitutions of this residue in multiple Gα isoforms. Through cell-based measurements of activity, we showed that some mutants were further activated and inactivated by G protein-coupled receptors. Through biochemical, molecular dynamics, and nuclear magnetic resonance-based structural studies, we showed that the Gα mutants were functionally distinct and conformationally diverse, despite their shared inability to hydrolyze GTP. Thus, the catalytic glutamine residue contributes to functions beyond GTP hydrolysis, and these functions include subtype-specific, allosteric modulation of receptor-mediated subunit dissociation. We conclude that G proteins do not function as simple on-off switches. Rather, signaling emerges from an ensemble of active states, a subset of which are favored in disease and may be uniquely responsive to receptor-directed ligands.


Conflict of interest statement

Competing interests: J.S.G. reports consulting fees from Domain Pharmaceuticals, Pangea Therapeutics, and io9, and is founder of Kadima Pharmaceuticals. All other authors declare that they have no competing interests.

Figures

Fig. 1.
Fig. 1.. Prevalence and distribution of catalytic glutamine mutations in cancer.
(A) Graphical view of all of the mutations found in GNAQ from patient samples curated by COSMIC (v94). (B) Pie chart showing the distribution of observed substitutions in Gαq from patient samples. (C) Pie chart showing the tissue distribution of catalytic glutamine mutations.
Fig. 2.
Fig. 2.. Catalytic glutamine mutations confer distinct Gα- and Gβγ-mediated signaling outputs.
(A) The yeast mating pathway is activated by the binding of pheromone to the GPCR (Ste2). Ste2 catalyzes the exchange of GDP for GTP and dissociation of Gα (Gpa1) from Gβγ (Ste4/Ste18). Ste4/Ste18 activates a MAPK kinase kinase (Ste11), a MAPK kinase (Ste7), and the terminal MAPK (Fus3). Fus3 promotes induction of mating genes. Gpa1 binds to the sole phosphatidylinositol 3-kinase in yeast, Vps34, and the Gβ-like regulatory subunit, Vps15, which promote autophagy under nitrogen-deficient conditions. (B) The autophagy biosensor Rosella was used to measure Gpa1-dependent cytoplasm-to-vacuole targeting in BY4741 bar1Δ (wild-type) cells. Time-course of vacuole targeting initiated by nitrogen depletion in wild-type cells with plasmids expressing Gpa1 wild-type (WT), the indicated Gpa1 mutants, or vector with no insert (pRS316). Fluorescence was measured every 30 min for 8 hours.(C) Rosella assay values measured at 8 hours. (D) The FUS1-lacZ transcriptional reporter was used to measure Ste4/18-dependent transcription in wild-type cells transformed with Gpa1 WT, Gpa1 mutants, or vector with no insert (pRS316). Cells were treated with 0 to 3 μM α-factor pheromone, and fluorescence was measured after 90 min. Data represent the percentage of maximum transcriptional activity in cells relative to that in cells with empty vector. (E) Transcriptional reporter activity when no α-factor was added. Symbols in (B) and bars in (C) are means ± SD from three independent experiments with two measurements each. Pair-wise comparisons with vector are *P < 0.05, **P < 0.01, ***P < 0.001, and ****P < 0.0001 by one-way ANOVA. Symbols in (D) and bars in (E) are the means of two independent experiments with two measurements each.
Fig. 3.
Fig. 3.. Catalytic glutamine mutations confer substitution- and subtype-specific activation by GPCRs.
(A to I) G protein subunit dissociation was measured with TRUPATH biosensors consisting of Gα-RLuc8 (donor), Gβ3, and Gγ9-GFP2 (acceptor), which were activated by stimulation of the neurotensin receptor 1 (NTR1) in HEK293T cells. Cells were treated with the indicated concentrations of neurotensin, and the ratio of GFP2 to RLuc8 was measured. (A) BRET for wild-type (WT, green), QL (red), QP (magenta), and 17 other (gray) mutant forms of Gαq. (B) Net BRET at the highest agonist concentration, in bar-graph form. (C) Gαs BRET. (D) Net BRET for Gαs. (E) Gαi3 BRET. (F) Net BRET Gαi3. (G) BRET for WT Gαq without (green) or with (blue) SBI-553 allosteric ligand treatment. (H) BRET for Gαq QL without (green) or with (blue) SBI-553 treatment. (I) BRET for Gαq QP without (green) or with (blue) SBI-553 treatment. Data in (A), (C), (E) and (G to I) are means (symbols) from two measurements and are representative of three independent experiments. Data in (B), (D), and (F) are means ± SD from three independent experiments (symbols) with two measurements each. In (B), all pair-wise comparisons with WT were P < 0.0001 by one-way ANOVA. In (D), pair-wise comparisons with WT were *P < 0.05, **P < 0.01, ***P < 0.001, and ****P < 0.0001 by one-way ANOVA.
Fig. 4.
Fig. 4.. Catalytic glutamine mutations confer substitution- and subtype-specific interaction energies.
(A) Structure of the Gαi1βγ trimer (PDB ID: 1GP2). The red region is Switch II, the blue region is the N terminus of the Gα unit. (B) Interaction energies between Gαi Switch II and Gβ, averaged across the three MD simulation runs, for WT-GTP/GDP and the indicated mutants. The error bars indicate the SD across the three simulations. (C) Interaction energies between the Gαi N terminus and Gβ, averaged across the MD simulation trajectories, for WT-GTP/GDP and the indicated mutants. (D) Allosteric communication pipeline (tube in red) starting from the Gαβ interface residues and passing through the nucleotide-binding site to the C-terminal residues in Gαi. The radius of the red tube is proportional to allosteric communication strength. The nucleotide is shown as sticks and Gln204 is shown as a cyan sphere. (E) Normalized allosteric hub score comparison between Gαi and Gαq. A greater score means stronger contribution to the allosteric communication. (F) Allosteric communication pipeline (tube in red) starting from the Gαβ interface and passing through the nucleotide-binding site to the C terminus in Gαq. The radius of the red tube is proportional to allosteric communication strength. The nucleotide is shown as sticks and Gln209 is shown as a cyan sphere. Data in (B) and (C) are means ± SD from three independent simulations.
Fig. 5.
Fig. 5.. Biophysical characterization of glutamine mutants.
(A) Gαi1-GDP was combined with BODIPY-GTP, and binding and hydrolysis were assessed by measuring the increase and decrease in fluorescence, respectively. RFU, relative fluorescence units. (B) Gαi1-GDP was combined with a nonhydrolyzable GTP analog, BODIPY-GTPγS at pH 7. The intrinsic rate of exchange was determined by measuring the increase in fluorescence. (C) Gαi1-GDP was combined with BODIPY-GTPγS at pH 6. (D) Gαi1 bound to BODIPY-GTPγS was combined with excess GTPγS. The rate of dissociation was measured as the decrease in fluorescence. (E to I) Thermostability of Gαi1 in GDP-and GTPγS-bound states, as determined by SYPRO fluorescence labeling of buried hydrophobic regions. (J) Circular dichroism (CD) spectrum analysis for Gαi1 WT and the indicated mutants, in the GTPγS-bound state. Spectral scans ranged from 185 to 260 nm at 30°C (shown), and 70 and 90°C (fig. S3, F and G). (K) Secondary structure predictions based on CD measurements. Data in (A to D) are representative of three independent experiments, and are fit to one phase exponential decay curves. In (B) and (C), pair-wise comparisons of WT and mutants are **P < 0.01 and ****P < 0.0001 respectively, by one-way ANOVA. Data in (E to J) are representative of two independent experiments, and are fit to Boltzmann sigmoidal curves.
Fig. 6.
Fig. 6.. NMR HSQC spectral overlay of GTPγS-bound wild-type Gαi1 with the QL, QR, and QP mutants.
(A) 2D [15N, 1H] HSQC NMR spectra were acquired on a Bruker Avance 850 at 25°C for 100 to 200 μM 15N-enriched Gαi1. Decreases in peak intensity indicate line broadening. Shifts in peak position relative to the assigned WT were considered as chemical shifts. Peaks missing in the mutant spectrum relative to the WT were considered as undetected peaks. Spectral overlay of WT (red) and QL (black) in the GTPγS-bound state. The WT had approximately 310 peaks and the QL mutant had 372 peaks in total. Spectral overlay shows extensive peak broadening relative to chemical shift changes for QL and a subset of 60 peaks not evident in the WT. Labeled arrows indicate examples of broadened residues in the QL spectrum. Unlabeled arrows indicate an example of undetected peaks in the QL spectrum. (B) Structural rendering of the Gαi1 structure with PyMOL (PDB: 1GIL), highlighting undetected peaks (red), shifted peaks (CSP, chemical shift perturbation > 1.4; yellow), and broadened peaks (magenta) in QL. (C) Projecting MD simulation trajectory snapshots of WT (red) and QL (black) onto PC1 and PC2. The contour line is related to population density with a darker color indicating greater density. (D) Spectral overlay of WT Gαi1 (red) and the QR mutant (purple) in the GTPγS-bound state. The QR has 100 fewer peaks than those seen for the WT. Spectral overlay shows extensive resonance-broadening in both the RAS-like and helical domain. Arrows indicate undetected peaks in the QR spectrum. (E) Structural rendering of the Gαi1 structure with PyMOL (PDB:1GIL) highlighting undetected peaks (red), shifted peaks (yellow), and broadened peaks (magenta) in QR. (F) Projecting MD simulation trajectory snapshots of WT (red) and QR (magenta) onto PC1 and PC2. The contour line is related to the population density, with a darker color indicating greater density. (G) Spectral overlay of WT Gαi1 (red) and the QP mutant (blue) in the GTPγS-bound state. QP has 312 peaks in total. Spectral overlay shows chemical shift changes in the RAS-like domain relative to that of the WT. Arrows indicate examples of shifted peaks in the spectrum of QP in putative nucleotide-binding regions (G-boxes). (H) Structural rendering of the Gαi1 structure with PyMOL (PDB: 1GIL) highlighting undetected peaks (red), shifted peaks (yellow), and broadened peaks (magenta) in QP. (I) Projection of MD simulation trajectory snapshots of WT (red) and QP (blue) onto PC1 and PC2. The contour line is related to the population density, with a darker color indicating greater density. Data in (A), (D), and (G) are representative of two independent experiments.
Fig. 7.
Fig. 7.. Catalytic glutamine mutations confer distinct Gα-mediated signaling outputs in mammalian cells.
(A) SRE-luciferase reporter activity in HEK293 cells co-transfected with a plasmid expressing SRE-luc reporter in combination with control vector (GFP), or plasmids encoding Gαq WT or the indicated glutamine mutants. (B) Representative Western blotting analysis of FAK and ERK phosphorylation in HEK293 cells transfected with empty vector (EV) or plasmids encoding Gαq WT or the indicated glutamine mutants. (C) Quantification of the amount of phosphorylated ERK (pERK) relative to that of total ERK from the experiments shown in (B). (D) Quantification of the amount of phosphorylated FAK (pFAK) relative to that of total FAK from the experiments shown in (B). (E) SRE-luciferase reporter activity in HEK293 cells cotransfected with the SRE-luc reporter and Gαq-DREADD in combination with empty vector control (EV) or plasmids encoding Gαq WT or the indicated glutamine mutants. Reporter activity was measured under basal conditions and in response to 1 μM CNO for 6 hours. (F) Cell proliferation in NIH3T3 cells co-transfected with GFP and empty vector control (EV) or plasmids encoding Gαq WT or the indicated glutamine mutants. Measurement of the percentage of GFP+/Ki67+ cells was used to assess the proportion of transfected proliferative cells. Data in (A) and (C to F) are means ± SEM from three independent experiments (symbols) with three measurements each. *P < 0.05,***P < 0.001, and ****P < 0.0001 by one-way ANOVA. Data in (B) are representative of three independent experiments.

Similar articles

Cited by

References

    1. Wacker D, Stevens RC, Roth BL, How Ligands Illuminate GPCR Molecular Pharmacology. Cell. 170, 414–427 (2017). - PMC - PubMed
    1. McCudden CR, Hains MD, Kimple RJ, Siderovski DP, Willard FS, G-protein signaling: Back to the future. Cellular and Molecular Life Sciences. 62 (2005), pp. 551–577. - PMC - PubMed
    1. Buck LB, The Molecular Architecture of Odor and Pheromone Sensing in Mammals. Cell. 100, 611–618 (2000). - PubMed
    1. Margolskee RF, Molecular Mechanisms of Bitter and Sweet Taste Transduction. Journal of Biological Chemistry. 277, 1–4 (2002). - PubMed
    1. Arshavsky VY, Lamb TD, Pugh EN, G Proteins and Phototransduction. Annurev.physiol 64, 153–187 (2003). - PubMed

Publication types

MeSH terms