. 2023 Mar 21;4(3):100945.
doi: 10.1016/j.xcrm.2023.100945. Epub 2023 Feb 13.

Loss of IGFBP2 mediates alveolar type 2 cell senescence and promotes lung fibrosis

Affiliations

Loss of IGFBP2 mediates alveolar type 2 cell senescence and promotes lung fibrosis

Chiahsuan Chin et al. Cell Rep Med. .

Abstract

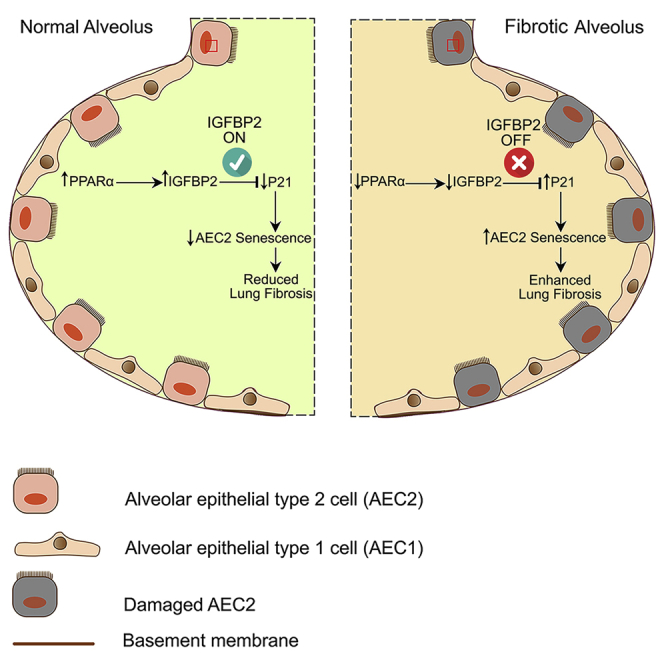
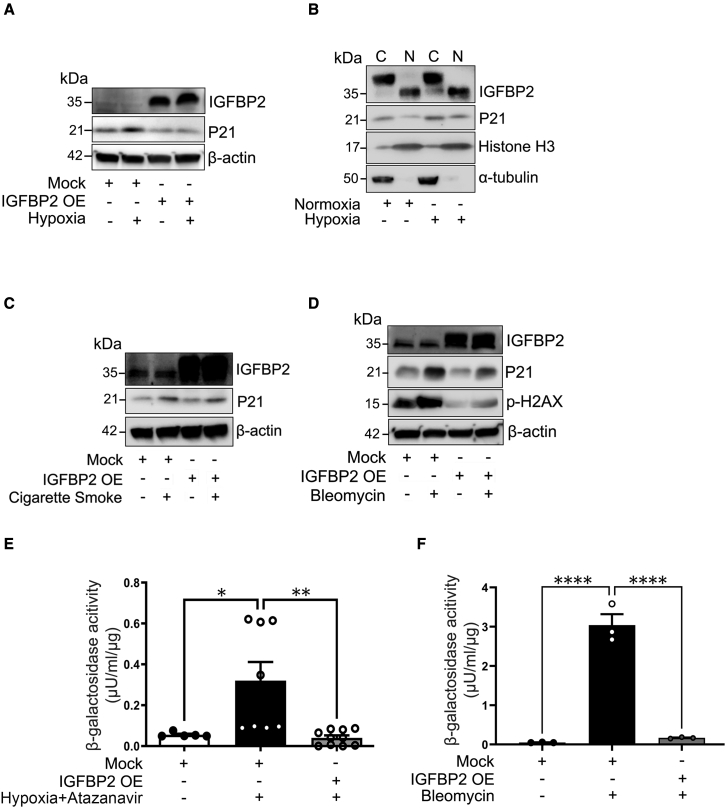
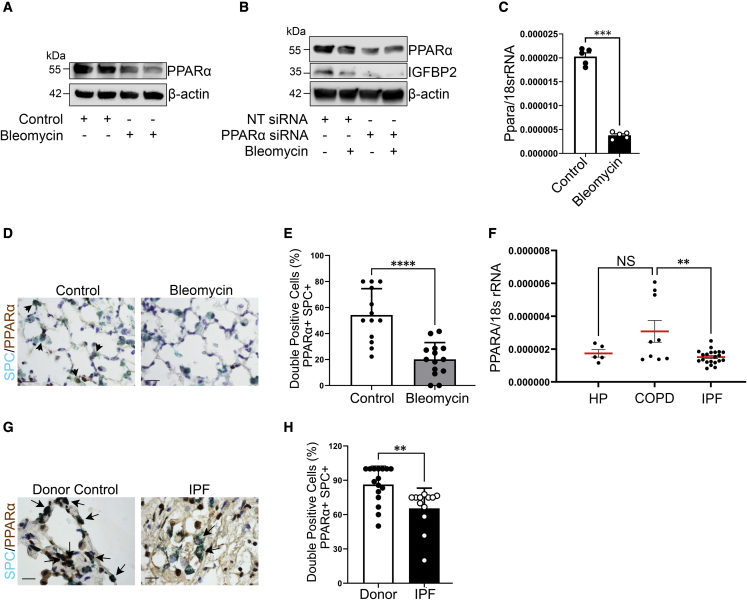
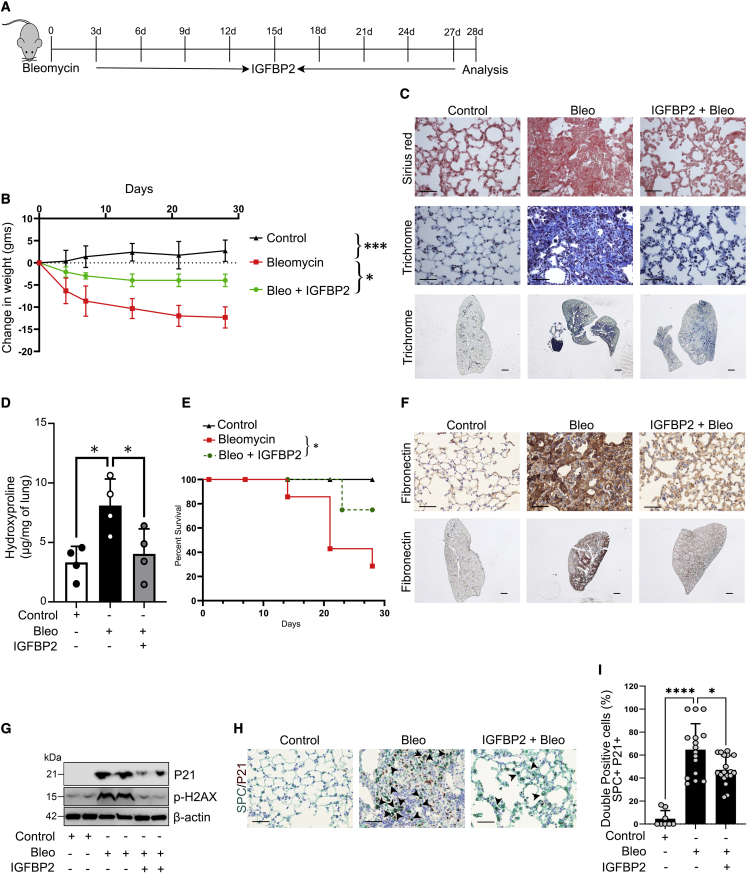
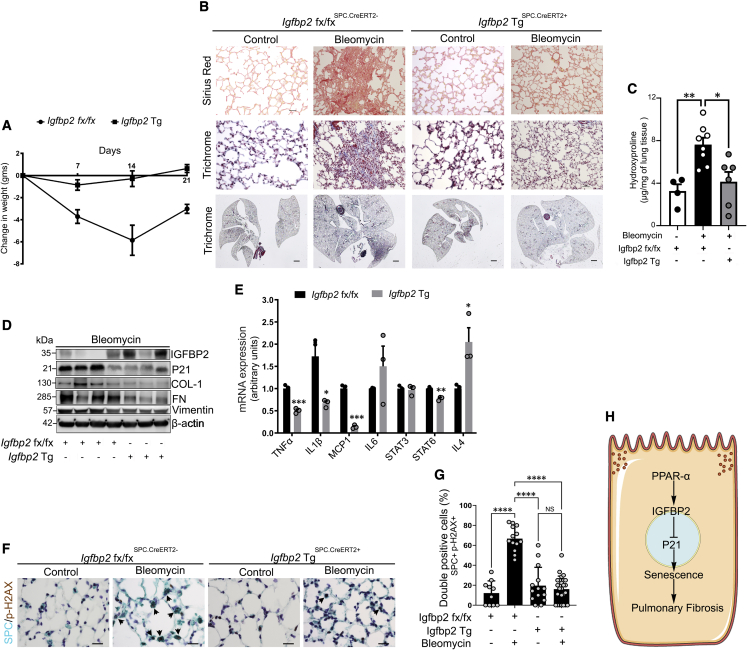
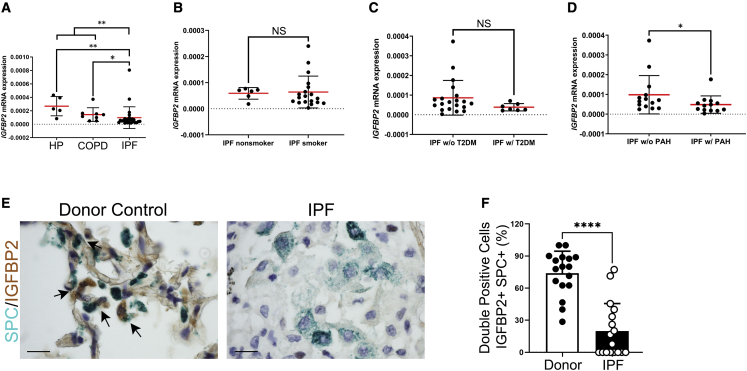
Accumulation of senescent cells contributes to age-related diseases including idiopathic pulmonary fibrosis (IPF). Insulin-like growth factor binding proteins (IGFBPs) regulate many biological processes; however, the functional contributions of IGFBP2 in lung fibrosis remain largely unclear. Here, we report that intranasal delivery of recombinant IGFBP2 protects aged mice from weight loss and demonstrated antifibrotic effects after bleomycin lung injury. Notably, aged human-Igfbp2 transgenic mice reveal reduced senescence and senescent-associated secretory phenotype factors in alveolar epithelial type 2 (AEC2) cells and they ameliorated bleomycin-induced lung fibrosis. Finally, we demonstrate that IGFBP2 expression is significantly suppressed in AEC2 cells isolated from fibrotic lung regions of patients with IPF and/or pulmonary hypertension compared with patients with hypersensitivity pneumonitis and/or chronic obstructive pulmonary disease. Altogether, our study provides insights into how IGFBP2 regulates AEC2-cell-specific senescence and that restoring IGFBP2 levels in fibrotic lungs can prove effective for patients with IPF.

Keywords: IGFBP2; P21; PPAR-α; SASP; aging; fibrosis; lung; senescence; γ-H2AX.


Conflict of interest statement

Declaration of interests The authors declare no competing interests.

Figures

None
Graphical abstract
Figure 1
Figure 1
Low-dose bleomycin induces irreversible pulmonary fibrosis in aged mice (A) Line plot showing body weights of aged wild-type (WT; C57BL/6J) mice 7, 14, and 21 days after intratracheal administration of normal saline (equal volume) or bleomycin (1 U/kg body weight) (n = 8 WT saline; n = 8 WT bleomycin). ∗∗∗p < 0.001, two-way ANOVA with Tukey’s post-hoc test. (B) Representative images of Mason’s trichrome-stained lung sections of aged mice 28 or 50 days after intratracheal administration of bleomycin. Scale bars, 50 μm (top) and 1 mm (bottom) (n = 8 WT saline; n = 8 WT bleomycin). (C) Hydroxyproline content (μg per mg of lung tissue) in the lungs of aged mice 28 or 50 days after intratracheal administration of bleomycin (1 U/kg body weight). ∗∗∗p < 0.001, ∗p < 0.05, one-way ANOVA with Tukey’s post-hoc test. (D) Western blot for expression of IGFBP2, P21, collagen-1, fibronectin, and vimentin in the lung homogenates of aged mice 14 days after low-dose bleomycin challenge. β-actin served as the internal control. Note that same samples were run on different gels (n = 6 WT saline; n = 8 WT bleomycin). (E) Igfbp2 mRNA expression in the lung homogenates of aged mice subjected to low-dose bleomycin challenge after 14 days. (F) IGFBP2 protein expression was determined by ELISA in the serum samples of aged mice 14 days after bleomycin injury (n = 5 WT saline; n = 6 WT bleomycin). (G) Igfbp2 mRNA expression in the primary AEC2 cells isolated from aged mice subjected to low-dose bleomycin challenge after 14 days. Each sample is obtained from 4 mice lungs (n = 3 WT saline; n = 3 WT bleomycin). NS, not significant, ∗∗∗∗p < 0.0001, ∗∗p < 0.01, Student’s unpaired two-tailed t test. (H) Representative multicolor immunohistochemistry of lung sections from aged WT mice subjected to low-dose bleomycin after 28 and 50 days. Green color indicates surfactant protein C (SPC) expression; brown color indicates P21 (top) and phospho-H2AX (bottom) expression. Insets: zoom-in images to show green and brown color localization. Black arrowheads highlight the double-positive AEC2 cells. Scale bars, 10 μm. (I and J) Quantification of double-positive cells for P21 (left) and phospho-H2AX (right) expression in SPC + cells in the lungs of aged WT mice subjected to low-dose bleomycin after 28 and 50 days, respectively. Each data point represents per field image of a sample. Data are mean ± SEM. ∗∗∗∗p < 0.0001, ∗∗p < 0.01, ∗p < 0.05, one-way ANOVA with Tukey’s post-hoc test.
Figure 2
Figure 2
IGFBP2 downregulation in adenoviral TGF-β1-induced pulmonary fibrosis in aged mice (A) Sirius red (top)- or Mason’s trichrome (bottom)-stained lung sections of aged (78–82 weeks old) WT mice 28 days after intratracheal administration of Ad-null or Ad-TGF-β1 virus (5 × 108 PFU). Scale bars, 50 μm (n = 6 Ad-null; n = 6 Ad-TGF-β1). (B) Hydroxyproline content (μg per mg of lung) in the lungs of 18-month-old mice 28 days after intratracheal administration of Ad-null or Ad-TGF-β1 virus (n = 6 Ad-null; n = 6 Ad-TGF-β1). (C) Representative double-color immunohistochemistry lung images of aged WT mice challenged with Ad-Null or Ad-TGF-β1 virus. Green color indicates SPC expression; brown color indicates IGFBP2 or P21 or phospho-H2AX expression. Black arrowheads indicate the double-positive AEC2 cells. Scale bars, 10 μm (n = 6 Ad-null; n = 6 Ad-TGF-β1). (D) Quantification of percentages of double-positive cells for IGFBP2, P21, and phospho-H2AX expression in SPC + cells, respectively. Data are mean ± SEM ∗∗p < 0.01, and ∗∗∗p < 0.001, Student’s unpaired two-tailed t test.
Figure 3
Figure 3
IGFBP2 deficiency increases P21 expression in response to fibrotic stimuli in vitro (A) Western blot for the expression of IGFBP2, P21, and phospho-H2AX in MLE-12 cells pretreated with atazanavir (ATZ; 20 μg/mL) for 1 h and exposed to hypoxia treatment for 72 h. (B) Western blot for the expression of IGFBP2, P21, and phospho-H2AX in MLE-12 cells exposed to absence or presence of chronic exposure to bleomycin (two-hit model; 10 μg/mL). (C) Western blot for the expression of IGFBP2 and P21 in MLE-12 cells exposed to absence or presence of hypoxia treatment at 4 h. β-Actin served as an internal control. (D) Western blot for the expression of IGFBP2 and P21 in the cytosolic and nuclear fractions of MLE-12 cells that were exposed to absence or presence of hypoxia treatment. α-Tubulin and histone-3 served as internal controls. (E) Western blot for the expression of IGFBP2 and P21 in MLE-12 cells exposed to absence or presence of cigarette smoke treatment (100 μg/mL). (F) Non-targeting or Igfbp2 siRNA-transduced MLE-12 cells were exposed to absence or presence of hypoxia treatment at 4 h. Western blot for the expression of IGFBP2 and P21. (G) Non-targeting or Igfbp2 siRNA-transduced MLE-12 cells were challenged with absence or presence of bleomycin exposure (10 μg/mL). Western blot for the expression of IGFBP2, P21, and phospho-H2AX in MLE-12 cells subjected to bleomycin exposure at 4 h. β-Actin served as an internal control. Data are representative of minimum of 3 independent experiments.
Figure 4
Figure 4
Stable transduction with Igfbp2 lentivirus vector decreased P21 expression and β-galactosidase activity in vitro (A) Mock-virus- and Igfbp2 lentivirus-transduced MLE-12 cells in the absence or presence of hypoxia treatment at 4 h. Western blot for the expression of IGFBP2 and P21. β-Actin served as internal control. (B) Western blot for the expression of IGFBP2 and P21 in the cytosolic and nuclear fractions of Igfbp2 lentivirus-transduced MLE-12 cells in the absence or presence of hypoxia treatment at 4 h. α-Tubulin and histone-3 served as internal controls. (C) Western blot for the expression of IGFBP2, P21, and phosph-H2AX in Igfbp2 lentivirus-transduced MLE-12 cells in the absence or presence of cigarette smoke treatment (100 μg/mL). (D) Western blot for the expression of IGFBP2, P21, and phospho-H2AX in Igfbp2 lentivirus-transduced MLE-12 cells in the absence or presence of bleomycin (10 μg/mL). β-Actin served as internal control. (E) Bar graph showing the β-galactosidase activity of MLE-12 cells pretreated with ATZ for 1 h and subjected to hypoxia for 96 h. (F) Bar graph showing the β-galactosidase activity of MLE-12 cells treated with bleomycin for 48 h. Data are representative of minimum of 3 independent experiments. Data are mean ± SEM. ∗p < 0.05, ∗∗p < 0.01, ∗∗∗∗p < 0.0001, one-way ANOVA with Tukey’s post-hoc test.
Figure 5
Figure 5
Reduced PPARA expression in the AEC2 cells from fibrotic lung regions of patients with IPF (A) Western blot for the expression of PPARα and β-actin in MLE-12 cells exposed to absence or presence of bleomycin at 4 h. (B) Non-targeting or Ppara siRNA-transduced MLE-12 cells were exposed to absence or presence of bleomycin treatment at 4 h. Western blot for the expression of PPARα and IGFBP2. β-Actin served as internal control. Data are representative of minimum of 3 independent experiments. (C) Ppara mRNA expression in the primary AEC2 cells isolated from aged mice subjected to low-dose bleomycin challenge after 14 days. Eukaryotic 18S rRNA was used as an endogenous control (n = 5 WT saline; n = 5 WT bleomycin). (D) Representative multicolor color immunohistochemistry of lung sections from aged WT mice 28 days after bleomycin injury. Green color indicates SPC expression; brown color indicates PPARα expression. Scale bars, 10 μm (n = 5 WT saline; n = 5 WT bleomycin). (E) Quantification of percentages of double-positive cells for SPC and PPARα in the lungs of aged WT mice subjected to low-dose bleomycin after 28 days. (F) Ppara mRNA expression was determined by qPCR in the primary AEC2 cells of patients with IPF (n = 21) compared with HP (n = 5) or COPD (n = 9). (G) Representative multicolor immunohistological staining of PPARA and SPC. Arrows indicate examples of SPC-positive and PPARA-positive cells. Staining was performed with lung sections from 2 healthy controls and 2 patients with IPF. (H) Quantification of percentages of double-positive cells for SPC and PPARA in the fibrotic lung regions of patients with IPF and donor (healthy) controls. Data are mean ± SEM. NS, not significant; ∗∗p < 0.01, ∗∗∗p < 0.001, ∗∗∗∗p < 0.0001, one-way ANOVA with Tukey’s post-hoc test (for multiple group comparisons) or Student’s unpaired two-tailed t test (for two group comparisons).
Figure 6
Figure 6
Intranasal treatment of recombinant IGFBP2 alleviates bleomycin-induced pulmonary fibrosis in aged mice (A) Schematic representation of the experimental approach. Aged WT mice were exposed to saline or bleomycin treated with or without recombinant IGFBP2 protein (25 μg/kgwt), containing Curosurf (50 mg/kgwt), by intranasal instillation and euthanized 14 and 28 days later. (B) Body weights of IGFBP2-treated and vehicle-treated mice were measured and represented as bar graph (n = 8 per group). ∗∗∗p < 0.001 and ∗p < 0.05, two-way ANOVA. (C) Representative images of Sirius red (top) and Mason’s trichrome (middle) staining from lung sections at day 28. Representative whole lung images of Mason’s trichrome (below) staining from lung sections at day 28. Scale bars, 50 μm (top and middle) and 1 mm (bottom). (D) Total lung hydroxyproline content was quantitated 28 days after bleomycin treatment and represented as bar graph (n = 4 per group). ∗p < 0.05, one-way ANOVA with Tukey’s post-hoc test. (E) Survival of mice 28 days after intranasal treatment of IGFBP2 presented as line graph (n = 10 mice per group). Animal survival was assessed by the Kaplan-Meier analysis using log-rank test. (F) Representative immunohistochemically stained lung images of fibronectin from aged WT mice 28 days after bleomycin injury (n = 6 per group). Scale bars, 50 μm (top and middle) and 1 mm (below). (G) Western blot for the expression of P21 and fibronectin 14 days after bleomycin injury (n = 4 per group). β-Actin served as internal control. (H) Representative multicolor immunohistochemistry-stained lung images of SPC (red) and P21 (brown) from aged WT mice 14 days after bleomycin injury (n = 8 per group). Black arrowheads indicate the double-positive AEC2 cells. Scale bars, 50 μm. (I) Bar graph showing the percentages of double-positive P21 and SPC AEC2 cells that were quantified. Data are mean ± SEM. ∗p < 0.05, ∗∗∗∗p < 0.001, one way ANOVA with Tukey’s post-hoc test.
Figure 7
Figure 7
Effects of aged human Igfbp2 transgenic mice challenged with bleomycin treatment (A) Line plot showing the change in body weights of aged (36 weeks) WT and human Igfbp2 transgenic (Tg) mice subjected to intratracheal administration of bleomycin treatment (0.75 U/kg bodyweight) (n = 7 Igfbp2 fx/fx; n = 7 Igfbp2 Tg). ∗∗∗p < 0.001 and ∗∗p < 0.01, two-way ANOVA. (B) Sirius red (top)- or Mason’s trichrome (middle)-stained lung sections and whole-lung images (trichrome; below) of aged Igfbp2 fx/fx and human Igfbp2 Tg mice 28 days after intratracheal administration of bleomycin treatment. Scale bars, 50 μm (top and middle) and 1 mm (below) (n = 8 Igfbp2 fx/fx; n = 8 Igfbp2 Tg). (C) Total lung collagen content measured by hydroxyproline assay in aged Igfbp2 fx/fx and human Igfbp2 Tg mice 28 days after intratracheal administration of bleomycin treatment (n = 4 Igfbp2 fx/fx; n = 8 Igfbp2 Tg). ∗∗p < 0.01 and ∗p < 0.05, one way ANOVA with Tukey’s post-hoc test. (D) Western blot for the expression of IGFBP2, P21, collagen-I, fibronectin, and vimentin (n = 6 Igfbp2 fx/fx; n = 8 Igfbp2 Tg). (E) qPCR analysis for mRNA expression of tumor necrosis factor α (TNF-α), IL-1β, MCP-1, IL-6, STAT3, STAT6, and IL-4 in aged WT and human Igfbp2 Tg mice 14 days after intratracheal administration of bleomycin. Each sample is obtained from 4 mice lungs (n = 6 Igfbp2 fx/fx; n = 6 Igfbp2 Tg). ∗∗∗∗p < 0.0001, ∗∗∗p < 0.001, ∗∗p < 0.01, and ∗p < 0.05. Student’s unpaired two-tailed t test. (F) Representative double-color immunohistochemistry-stained lung images of SPC (green) and phospho-H2AX (brown) expression from aged Igfbp2 fx/fx and Igfbp2 Tg mice 28 days after bleomycin injury. Black arrowheads indicate the double-positive AEC2 cells. Scale bars, 10 μm. (G) Bar graph showing the percentages of double-positive p-H2AX and SPC AEC2 cells that were quantified. Data are mean ± SEM. NS, not significant; ∗∗∗∗p < 0.001, one way ANOVA with Tukey’s post-hoc test. (H) Schema represents molecular regulation of IGFBP2 signaling involving senescence in the AEC2 cells of the aged lung.
Figure 8
Figure 8
IGFBP2 expression was suppressed in the primary AEC2 cells of fibrotic lungs obtained from patients with IPF (A) IGFBP2 mRNA expression was determined by qPCR in the primary AEC2 cells isolated from fibrotic lung regions of patients with IPF (n = 27) compared with patients with COPD (n = 9) or HP (n = 5). ∗p < 0.05 and ∗∗p < 0.01, one-way ANOVA with Tukey’s post-hoc test. (B) IGFBP2 mRNA expression in primary AEC2 cells obtained from patients with IPF with smoking history (n = 19) compared with patients with IPF with non-smoking history (n = 6). (C) IGFBP2 mRNA expression in primary AEC2 cells obtained from patients with IPF with type 2 diabetes (n = 4) compared with patients with IPF with no type 2 diabetes (n = 7). (D) IGFBP2 mRNA expression determined by qPCR in the primary AEC2 cells obtained from patients with IPF with pulmonary hypertension (MPAP ≥ 25 mmHg) (n = 13) compared with patients with IPF with no pulmonary hypertension (n = 14). MPAP, mean pulmonary artery pressure. (E) Representative multicolor immunohistological staining of SPC and IGFBP2. Arrows indicate examples of SPC-positive and IGFBP2-positive cells. Staining was performed with lung sections from 2 healthy controls and 2 patients with IPF. (F) Quantification of percentages of double-positive cells for SPC and IGFBP2 in the fibrotic lung regions of patients with IPF and donor (healthy) controls. Data are expressed as mean ± SEM. NS, not significant; ∗p < 0.05, ∗∗p < 0.01, and ∗∗∗∗p < 0.0001, Student’s unpaired two-tailed t test.

References

    1. Meltzer E.B., Noble P.W. Idiopathic pulmonary fibrosis. Orphanet J. Rare Dis. 2008;3:8. doi: 10.1186/1750-1172-3-8. - DOI - PMC - PubMed
    1. Ley B., Collard H.R., King T.E. Clinical course and prediction of survival in idiopathic pulmonary fibrosis. Am. J. Respir. Crit. Care Med. 2011;183:431–440. doi: 10.1164/rccm.201006-0894CI. - DOI - PubMed
    1. Nadrous H.F., Pellikka P.A., Krowka M.J., Swanson K.L., Chaowalit N., Decker P.A., Ryu J.H. Pulmonary hypertension in patients with idiopathic pulmonary fibrosis. Chest. 2005;128:2393–2399. doi: 10.1378/chest.128.4.2393. - DOI - PubMed
    1. Yasui K., Yuda S., Abe K., Muranaka A., Otsuka M., Ohnishi H., Hashimoto A., Takahashi H., Tsuchihashi K., Takahashi H., et al. Pulmonary vascular resistance estimated by Doppler echocardiography predicts mortality in patients with interstitial lung disease. J. Cardiol. 2016;68:300–307. doi: 10.1016/j.jjcc.2016.02.025. - DOI - PubMed
    1. Janssens J.P., Pache J.C., Nicod L.P. Physiological changes in respiratory function associated with ageing. Eur. Respir. J. 1999;13:197–205. doi: 10.1034/j.1399-3003.1999.13a36.x. - DOI - PubMed

Publication types