. 2023 Mar 1;111(5):682-695.e9.
doi: 10.1016/j.neuron.2023.01.013. Epub 2023 Feb 13.

Glioma epileptiform activity and progression are driven by IGSF3-mediated potassium dysregulation

Affiliations

Glioma epileptiform activity and progression are driven by IGSF3-mediated potassium dysregulation

Rachel Naomi Curry et al. Neuron. .

Abstract

Seizures are a frequent pathophysiological feature of malignant glioma. Recent studies implicate peritumoral synaptic dysregulation as a driver of brain hyperactivity and tumor progression; however, the molecular mechanisms that govern these phenomena remain elusive. Using scRNA-seq and intraoperative patient ECoG recordings, we show that tumors from seizure patients are enriched for gene signatures regulating synapse formation. Employing a human-to-mouse in vivo functionalization pipeline to screen these genes, we identify IGSF3 as a mediator of glioma progression and dysregulated neural circuitry that manifests as spreading depolarization (SD). Mechanistically, we discover that IGSF3 interacts with Kir4.1 to suppress potassium buffering and found that seizure patients exhibit reduced expression of potassium handlers in proliferating tumor cells. In vivo imaging reveals that dysregulated synaptic activity emanates from the tumor-neuron interface, which we confirm in patients. Our studies reveal that tumor progression and seizures are enabled by ion dyshomeostasis and identify SD as a driver of disease.

Keywords: brain hyperactivity; glioma; glioma-related epilepsy; potassium dysregulation; spreading depolarization.


Conflict of interest statement

Declaration of interests The authors declare no competing interests.

Figures
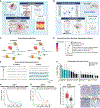
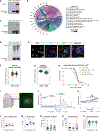
Figure 1.
Figure 1.. Single-cell profiling of glioma patients and a synaptogenic in vivo barcoded screen identify IGSF3 as a novel driver of tumor progression in glioma
(A) Schematic overview showing experimental pipeline of human glioma patients. (B) Schematic overview showing validation using an in vivo barcoded screen. (C) Cluster annotation of 180,139 cells collected from seizure (n = 4) and non-seizure (n = 3) glioma patients. (D) Representative ECoG traces from seizure (n = 9) and non-seizure (n = 5) patients. (E) Select GO analysis of upregulated DEGs in seizure patients (**p < 0.01). (F) Synaptogenic barcoded screen results showing enrichment of genes (n = 22) across tumor mice (n = 4). (G) Kaplan-Meier survival analysis from TCGA of high (12.9 months; n = 85) and low (15.4 months; n = 85) IGSF3 expressors shows high IGSF3 expression is correlated with worse survival outcomes in IDH1 wild-type GBM (*p < 0.05). (H) Kaplan-Meier survival analysis from TCGA of high (25.9 months; n = 167) and low (78.2 months; n = 166) IGSF3 expressors shows high IGSF3 expression is correlated with worse survival outcomes across all glioma subtypes (***p < 0.001). (I) Normalized IGSF3 mRNA expression of TCGA GBM (n = 163) and GTEx non-tumor (n = 207) samples (**p < 0.01). (J) Representative images of IGSF3 expression detected by IHC in normal brain and MG subtypes; scale bars, 50 μm. DEG, differentially expressed genes; ECoG, electrocorticography; GBM, glioblastoma; GO, gene ontology; HGG, high-grade glioma; IHC, immunohistochemistry; LGG, low-grade glioma; and MG, malignant glioma.
Figure 2.
Figure 2.. IGSF3 promotes tumor progression in malignant glioma
(A) Representative H&E coronal sections of end-stage control, IGSF3-GOF and IGSF3-LOF tumors; white dashed line denotes tumor; scale bar = 2 mm. (B) Representative images of end-stage tumors showing H&E staining, IGSF3 expression, and Ki67-marked proliferation; scale bar = 50 μm. (C) Quantification of proliferating cells marked by Ki67 staining in end-stage tumors (n = 3 per experimental group; ****p < 0.0001). (D) Kaplan-Meier survival analysis of IGSF3-GOF (n = 42; **p < 0.01) and IGSF3-LOF (n = 30; ***p < 0.001) tumors as compared to controls (n = 38). (E) Heatmaps of bulk RNA-seq DEGs (p < 0.05, log2(fold change) > 1.5) from IGSF3-GOF (n = 3) and IGSF3-LOF (n = 3) tumors versus controls (n = 3). (F) GO pathway analysis (p < 0.05) of upregulated DEGs in IGSF3-GOF tumors and downregulated DEGs in IGSF3-LOF tumors. (G) GSEA for IGSF3-GOF DEGs enrichment in cationic channel complexes, synapses, and interictal EEG abnormalities (***p < 0.001). EEG, electroencephalography; GSEA, gene set enrichment analysis; and H&E, hematoxylin and eosin.
Figure 3.
Figure 3.. IGSF3 engenders synaptic remodeling and hyperexcitability in malignant glioma
(A) Representative images of excitatory synaptic markers, Vglut1 and Psd95, in control, IGSF3-GOF, and IGSF3-LOF; scale bar, 10 μm. (B) Representative images of inhibitory synaptic markers, Vgat and gephyrin, in control, IGSF3-GOF, and IGSF3-LOF; scale bar, 10 μm. (C) Quantification of excitatory presynaptic, postsynaptic, and colocalized markers in IGSF3-GOF tumors (****p < 0.0001; **p < 0.01). (D) Quantification of inhibitory presynaptic, postsynaptic, and colocalized markers in IGSF3-LOF tumors (**p < 0.01; **p < 0.01). (E) Representative images of excitatory synaptic markers, synapsin and Psd95, on mouse cortical neurons (Map2) co-cultured with IGSF3-GOF or control astrocytes; scale bar, 20 μm (top); 2 μm (bottom). (F) Quantification of excitatory presynaptic and postsynaptic markers from neurons co-cultured with IGSF3-GOF astrocytes (***p < 0.001; ***p < 0.001). (G) Schematic showing electrode placement for iEEG studies of IGSF3-GOF (n = 7), IGSF3-LOF (n = 6) and control (n = 7) tumors. (H) Representative iEEG traces of interictal spikes. (I) Quantification of interictal spiking from IGSF3-LOF tumors (*p < 0.05; **p < 0.01). (J and K) Representative iEEG traces showing SD events (red traces) in IGSF3-GOF tumor mice. (L) Quantification of SD events from IGSF3-GOF tumors (*p < 0.05). (M and N) Representative iEEG traces and quantification of SW events (red traces) from IGSF3-LOF tumor mice. iEEG, intracranial electroencephalography; ROI, region of interest; SD, spreading depolarization; and SW, spike-wave.
Figure 4.
Figure 4.. IGSF3 binds Kir4.1 and impairs potassium buffering in glioma
(A) Western blot of IGSF3 for input (10%), IgG-IP and IGSF3-IP from IGSF3-GOF tumor. (B) Chord plot of the 18 binding partners (p < 0.05; log2(fold change) > 2) and GO analysis (p < 0.05). (C) CoIP of IGSF3 and Kir4.1 from IGSF3-GOF tumor; immunoblot showing input (10%), IgG-IP and Kir4.1-IP. (D) CoIP of IGSF3 and Kir4.1 from human glioma patient with seizures; immunoblot showing input (10%), IgG-IP and Kir4.1-IP. (E) Representative confocal images of IGSF3 and Kir4.1 in primary glioma cells (white arrows); scale bar, 10 μm. (F) Normalized KCNJ10 mRNA expression of TCGA GBM (n = 163) and GTEx non-tumor (n = 207) samples (ns). (G) KCNJ10 expression of TCGA IDH1 mutant (n = 429) versus IDH1 wild-type (n = 233) glioma patients (***p < 0.001). (H) Kaplan-Meier survival analysis for IGSF3-GOF (n = 42; **p < 0.01), Kir4.1-GOF (n = 16; ns), and IGSF3-Kir4.1-GOF (n = 8; ns) tumors. (I) Representative images of coronal tumor-bearing brain slices. (J) Representative traces showing tissue K+ measurements over stepwise changes to K+ bath concentrations. (K) Blue box shows 5 mM K+ bath region in detail. (L) Quantification of K+ measurements for control, IGSF3-GOF, and IGSF3-LOF tumor slices at basal (3 mM) K+ concentrations. (M) Quantification of K+ measurements for control, IGSF3-GOF, and IGSF3-LOF tumor slices at 5 mM K+ concentrations (**p < 0.01). (N–P) Quantification of (N) membrane resistance (ns), (P) cell capacitance (ns), and (O) resting membrane potential measurements. CoIP, coimmunoprecipitation; GBM, glioblastoma; IP, immunoprecipitation; and IP-MS, immunoprecipitation mass spectrometry.
Figure 5.
Figure 5.. Potassium handlers are globally downregulated by tumor cells in GRE
(A) Heatmap of scRNA-seq data from glioma patients potassium channel expression in tumor cells from seizure patients (****p < 0.0001). (B) Correlation plots of TCGA glioma patients showing ATP1A2, ATP1B2, KCNIP1, KCNJ10, and KCNIP4 correlation with cell cycle markers, MKI67 and TOP2A (p values for Pearson correlation coefficient are denoted for each pairwise comparison). (C) scRNA-seq feature plot showing the potassium module score for combined ATP1A2, ATP1B2, KCNIP1, KCNJ10, and KCNIP4 expression. Black dashed lines denote cycling tumor cells. (D) Heatmap of cell cycle genes and potassium module genes shows expression of ATP1A2, ATP1B2, KCNIP1, KCNJ10, and KCNIP4 is downregulated in GRE patients (red box). (E) Ridge plots of ATP1A2, ATP1B2, KCNIP1, KCNJ10, and KCNIP4 expression in cycling tumor cells (****p < 0.0001 for all five genes). (F) scRNA-seq feature plot showing the potassium module score for combined Atp1a2, Atp1b2 and Kcnj10 expression in IGSF3-GOF (n = 3) and control (n = 3) tumor mice. Black dashed lines denote cycling tumor cells. (G) Heatmap of cell cycle genes and potassium module genes shows expression of Atp1a2, Atp1b2, and Kcnj10 in IGSF3-GOF tumors (red box). (H) Ridge plots of Atp1a2, Atp1b2, and Kcnj10 expression in cycling tumor cells in IGSF3-GOF tumors (****p < 0.0001 for all three genes).
Figure 6.
Figure 6.. Dysregulated neuronal activity originates from the tumor-neuron interface in the leading edge
(A and B) Overview of 1-photon and 2-photon live imaging experiments. White dashed lines denote the region of brain visible through 1-photon imaging; black box denotes 1-photon widefield FOV through the cranial window; red box denotes 2-photon FOV containing FUCCI-labeled tumor cells and GCaMP-labeled peritumoral neurons; blue box denotes 2-photon FOV adjacent to the tumor-neuron interface used for calcium imaging studies and neuronal connectivity mapping. (C) Representative 2-photon FOV image stacks showing the tumor-neuron interface. Peritumoral neurons are marked by GCaMP (blue dashed lines); proliferating tumor cells are marked by FUCCI (pink dotted lines); region containing both FUCCI and GCaMP is shaded in white. (D) Quantification of FUCCI-labeled cells containing both FUCCI and GCaMP shown in C (*p < 0.05). (E) Representative ROIs showing FUCCI-labeled tumor cells surrounding individual GCaMP-labeled neurons. (F) Quantification of GCaMP-labeled neuronal soma within the white shaded area of C (ns). (G) Bean plots of GCaMP-labeled calcium transients showing overall activity, frequency, amplitude, duration, and clustering coefficient in IGSF3-GOF peritumoral neurons (n = 128); red arrows indicate medians (****p < 0.0001). (H) Bean plots of GCaMP-labeled calcium transients showing overall activity, frequency, amplitude, and duration (****p < 0.0001) in IGSF3-GOF peritumoral neuropil; red arrows indicate medians (****p < 0.0001). (I) Bean plots of GCaMP-labeled calcium transients showing overall activity, frequency, and clustering coefficient in IGSF3-GOF peritumoral neurons (n = 595); red arrows indicate medians (****p < 0.0001). (J) Bean plots of GCaMP-labeled calcium transients showing frequency and duration in IGSF3-GOF peritumoral neuropil; red arrows indicate medians (****p < 0.0001). (K and L) Representative ECoG traces from a GRE patient with intraoperative seizures. (K) shows the onset of a seizure (blue box). (L) shows that prior to seizure onset, preictal spiking begins following a large SD-like event (red trace) detected at the leading edge. (M–O) Representative iEEG trace of an IGSF3-GOF tumor mouse with multiple, bilateral SD events. (N) Zoom-in of blue box from (M) shows preictal spiking preceding SD onset. (O) Zoom-in of gray box from (M) shows the onset of lethal status epilepticus following SD events. ECoG, electrocorticography; FOV, field of view; FUCCI, fluorescent ubiquitination-based cell cycle indicator; GRE, glioma-related epilepsy; iEEG, intracranial electroencephalography; ROI, region of interest; and SD, spreading depolarization.

Comment in

References

    1. van Breemen MS, Wilms EB, and Vecht CJ (2007). Epilepsy in patients with brain tumours: epidemiology, mechanisms, and management. Lancet Neurol. 6, 421–430. 10.1016/S1474-4422(07)70103-5. - DOI - PubMed
    1. Berendsen S, Varkila M, Kroonen J, Seute T, Snijders TJ, Kauw F, Spliet WG, Willems M, Poulet C, Broekman ML, et al. (2016). Prognostic relevance of epilepsy at presentation in glioblastoma patients. Neuro. Oncol 18, 700–706. 10.1093/neuonc/nov238. - DOI - PMC - PubMed
    1. Correia CE, Umemura Y, Flynn JR, Reiner AS, and Avila EK (2021). Pharmacoresistant seizures and IDH mutation in low-grade gliomas. Neurooncol. Adv. 3, vdab146. 10.1093/noajnl/vdab146. - DOI - PMC - PubMed
    1. Yu K, Lin CJ, Hatcher A, Lozzi B, Kong K, Huang-Hobbs E, Cheng YT, Beechar VB, Zhu W, Zhang Y, et al. (2020). PIK3CA variants selectively initiate brain hyperactivity during gliomagenesis. Nature 578, 166–171. 10.1038/s41586-020-1952-2. - DOI - PMC - PubMed
    1. Venkatesh HS, Johung TB, Caretti V, Noll A, Tang Y, Nagaraja S, Gibson EM, Mount CW, Polepalli J, Mitra SS, et al. (2015). Neuronal activity promotes glioma growth through Neuroligin-3 secretion. Cell 161, 803–816. 10.1016/j.cell.2015.04.012. - DOI - PMC - PubMed

Publication types