. 2023 Apr 19;111(8):1301-1315.e5.
doi: 10.1016/j.neuron.2023.01.015. Epub 2023 Feb 13.

Social deprivation induces astrocytic TRPA1-GABA suppression of hippocampal circuits

Affiliations

Social deprivation induces astrocytic TRPA1-GABA suppression of hippocampal circuits

Yi-Ting Cheng et al. Neuron. .

Abstract

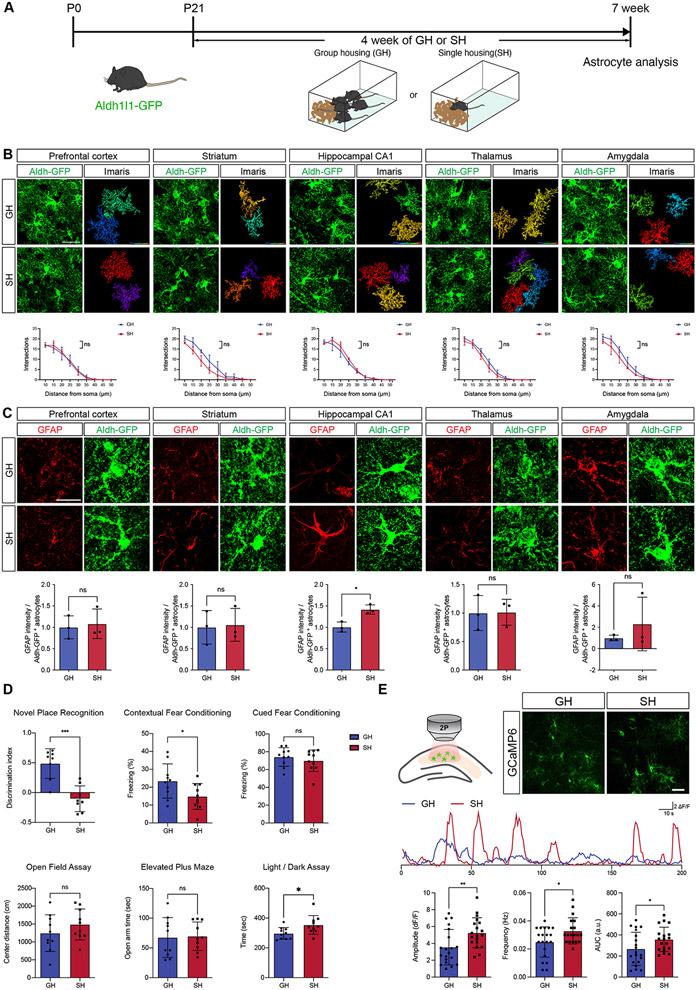
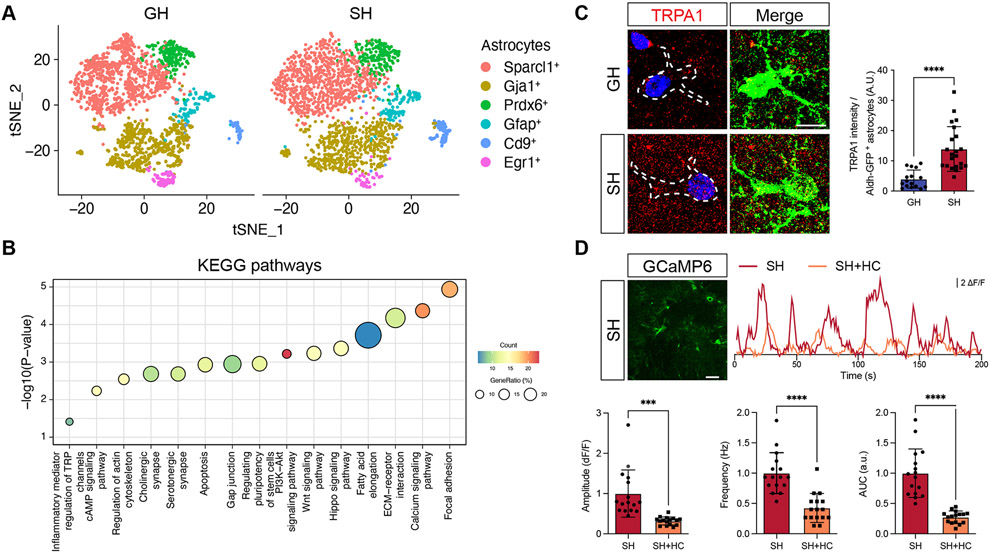
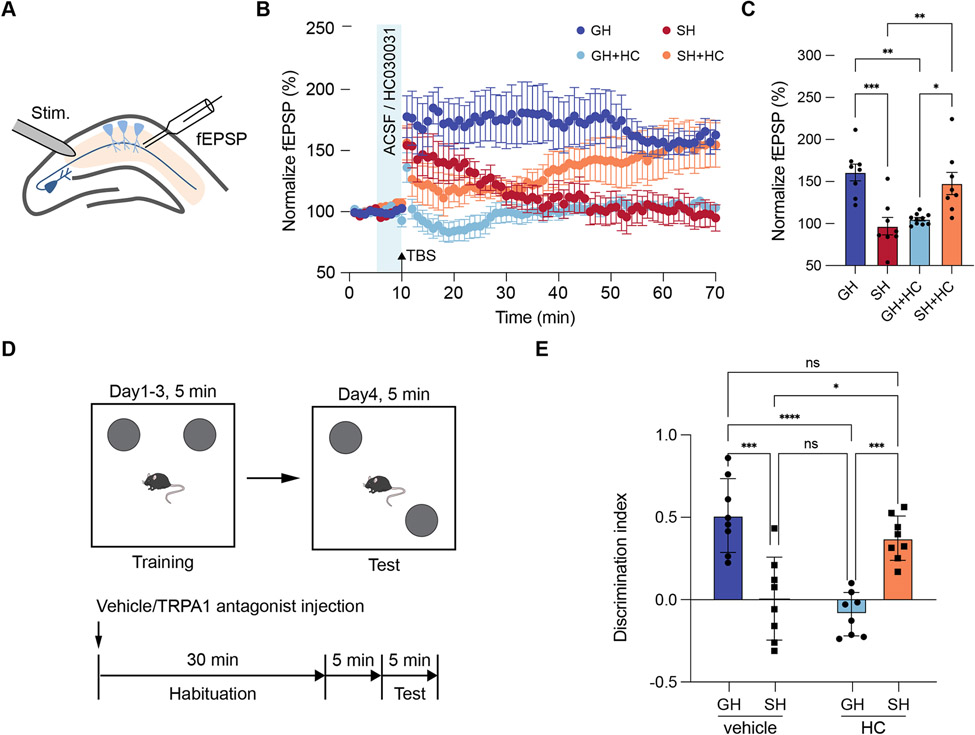
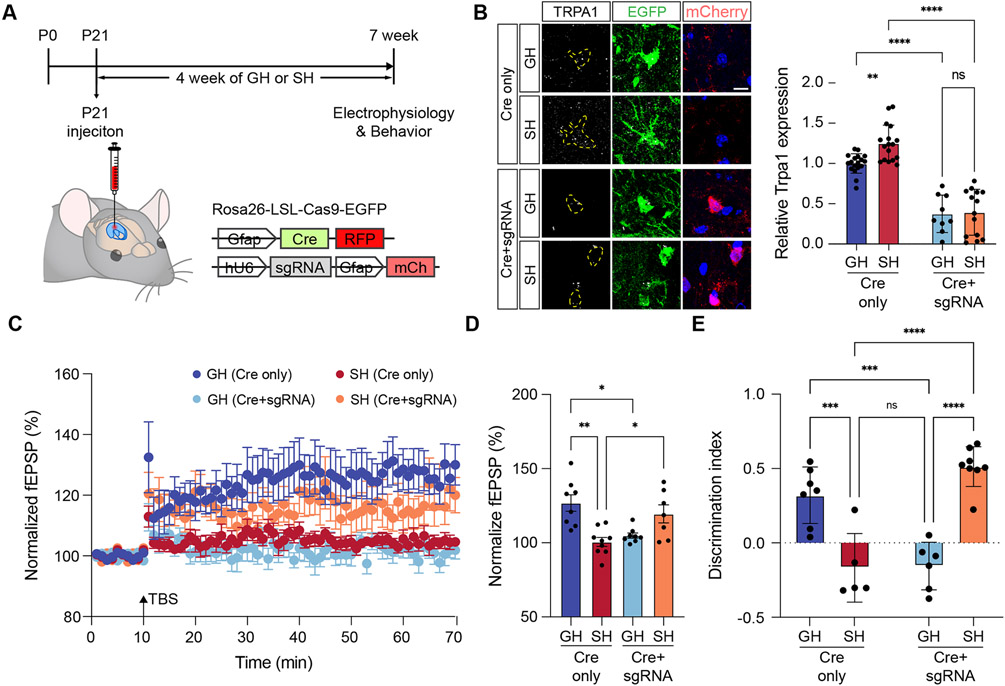
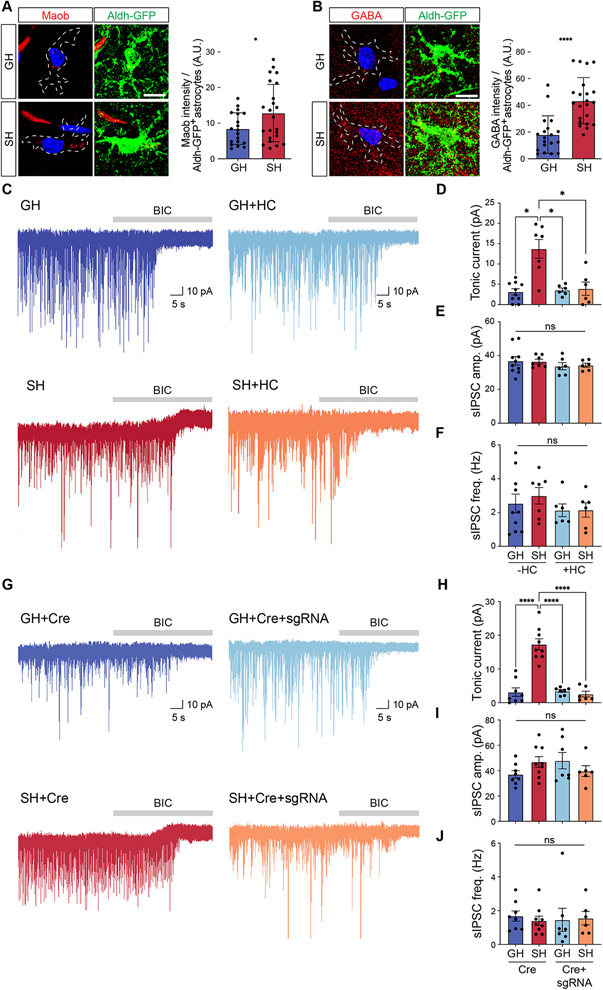
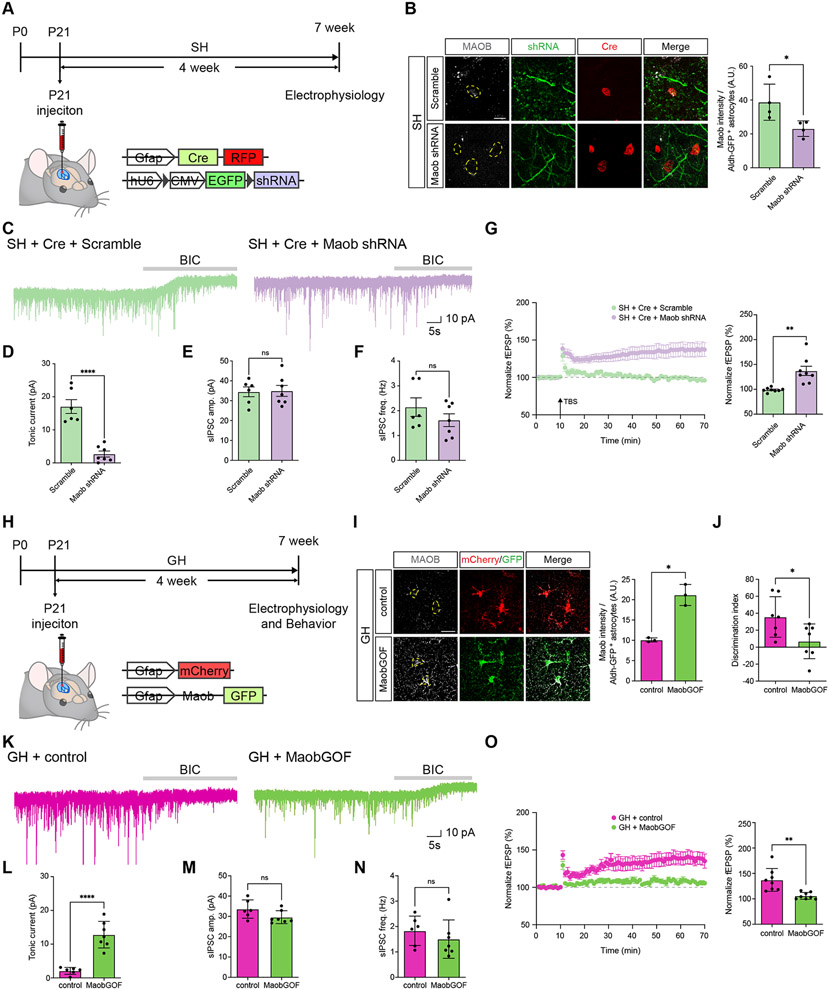
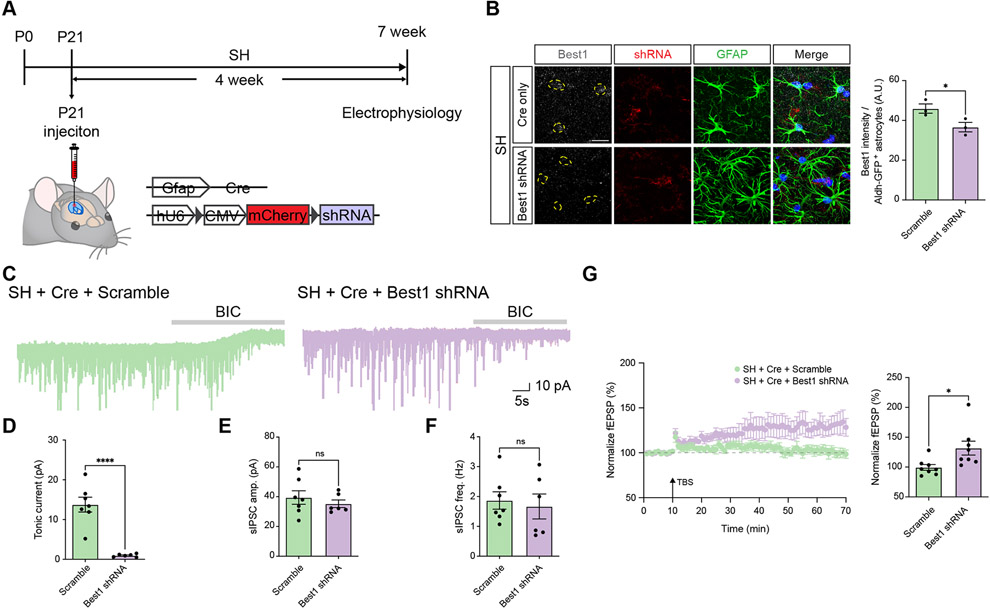
Social experience is essential for the development and maintenance of higher-order brain function. Social deprivation results in a host of cognitive deficits, and cellular studies have largely focused on associated neuronal dysregulation; how astrocyte function is impacted by social deprivation is unknown. Here, we show that hippocampal astrocytes from juvenile mice subjected to social isolation exhibit increased Ca2+ activity and global changes in gene expression. We found that the Ca2+ channel TRPA1 is upregulated in astrocytes after social deprivation and astrocyte-specific deletion of TRPA1 reverses the physiological and cognitive deficits associated with social deprivation. Mechanistically, TRPA1 inhibition of hippocampal circuits is mediated by a parallel increase of astrocytic production and release of the inhibitory neurotransmitter GABA after social deprivation. Collectively, our studies reveal how astrocyte function is tuned to social experience and identifies a social-context-specific mechanism by which astrocytic TRPA1 and GABA coordinately suppress hippocampal circuit function.

Keywords: GABA; TRPA1; astrocyte; hippocampus; social deprivation.


Conflict of interest statement

Declaration of interests The authors declare no competing interests.

Figures

Figure 1.
Figure 1.. Social deprivation alters core properties of hippocampal astrocytes
(A) Schematic of Group Housing (SH) and Single Housing (SH) Paradigms. (B) Imaging of Aldh1l1-GFP astrocytes and quantification of morphological complexity using Scholl analysis from prefrontal cortex, striatum, CA1, thalamus, and amygdala (n = 3 pairs of animals, at least 10 cells from each animal). Two-way ANOVA. (C) Immunostaining for GFAP expression in prefrontal cortex, striatum, CA1, thalamus, and amygdala of Aldh1l1-GFP mice from GH and SH cohorts. Welch’s t-test. (n = 3 pairs of animals, 3 sections per animal) (D) Behavioral results from GH and SH cohorts (n = 8-10 animals) (E) Representative image showing expression of GCaMP6s in astrocytes and representative spontaneous Ca2+ of two-photon, slice imaging from the hippocampus of GH and SH mice quantification is derived from n = 19-20 cells from 3 pairs of animals. Welch’s t-test. *p < 0.05; **p < 0.01; ***p < 0.001; ****p < 0.0001.
Figure 2.
Figure 2.. TRPA1 expression is increased in astrocytes after social deprivation
(A) Serut analysis of single cell RNA-Seq (scRNA-Seq) of hippocampal astrocytes from a pair of GH and SH. (B) KEGG pathway analysis of differentially expressed gene (DEGs) between GH and SH cohorts (cutoff for DEGs, adjusted p < 10−15, average log2 foldchange > 2). (C) Immunostaining for TRPA1 expression in Aldh1l1-GFP mice from GH and SH cohorts (n = 16-22 cells from 3 pairs of animals). Welch’s t-test. (D) Representative image showing expression of GCaMP6s in astrocytes and representative spontaneous Ca2+ of two-photon, slice imaging from the hippocampus of SH mice, treated with vehicle or HC030031 (HC); quantification is derived from n = 16 cells from 3 pairs of animals. Welch’s t-test. *p < 0.05; **p < 0.01; ***p < 0.001; ****p < 0.0001.
Figure 3.
Figure 3.. Inhibition of TRPA1 restores hippocampal circuit function
(A-C) Recording of Long-Term Potentiation (LTP) from the hippocampus in GH and SH cohorts treated with vehicle or HC. Two-way ANOVA, Sidak tests. (D) Schematic of Novel Placement Recognition (NPR) and treatment paradigm. (E) NPR behavioral studies on GH and SH cohorts treated with vehicle or HC (n = 8 animals in each group). Welch’s t-test. *p < 0.05; **p < 0.01; ***p < 0.001; ****p < 0.0001.
Figure 4.
Figure 4.. Astrocyte-specific deletion of TRPA1 rescues hippocampal circuit function after social deprivation
(A) Schematic of Cas9, AAV-based approach for deletion of TRPA1 in hippocampal astrocytes and time line of experimental paradigm. (B) Immunostaining of TRPA1 in hippocampal astrocytes from control and Cre+gRNA, groups. (n = 9-18 cells from 2 animals in each group) Two-way ANOVA, Tukey tests. (C-D) Recording of Long-Term Potentiation (LTP) from the hippocampus in GH and SH cohorts treated under control (Cre only) or TRPA1 deletion (Cre+sgRNA) genetic conditions. Two-way ANOVA, Tukey tests. (E) NPR behavioral studies on GH and SH cohorts under control (Cre only) or TRPA1 deletion (Cre+sgRNA) genetic conditions (n = 5-8 animals in each group). Two-way ANOVA, Tukey tests. *p < 0.05; **p < 0.01; ***p < 0.001; ****p < 0.0001.
Figure 5.
Figure 5.. Increased release of astrocytic GABA after social deprivation
(A-B) Immunostaining for Maob and GABA in hippocampal astrocytes from Aldh1l1-GFP mice after GH or SH paradigms (n = 19-23 cells from 3 pairs of animals). Welch’s t-test. (C) Representative traces measuring tonic GABA currents in CA1 pyramidal neurons in GH and SH cohorts treated with vehicle or HC. (D-F) Quantification of tonic GABA current (D), sIPSC amplitude (E), and sIPSC frequency (F) from the same cohorts and experimental conditions. Two-way ANOVA, Tukey test. (G) Representative traces measuring tonic GABA currents in CA1 pyramidal neurons in GH and SH cohorts with Cre or Cre+sgRNA. (H-J) Quantification of tonic GABA current (H), sIPSC amplitude (I), and sIPSC frequency (J) from the same cohorts and experimental conditions. Two-way ANOVA, Tukey test. *p < 0.05; **p < 0.01; ***p < 0.001; ****p < 0.0001.
Figure 6.
Figure 6.. Maob knockdown rescues hippocampal circuit function after social deprivation
(A) Schematic of AAV-Cre and lentiviral-based shRNA approach for knocking down Maob in hippocampal astrocytes and time line of experimental paradigm. (B) Immunostaining for Maob and Cre-RFP in hippocampal astrocytes from GH or SH after Maob knockdown paradigms. (n = 4 pairs of animals) Welch’s t-test (C) Representative traces measuring tonic GABA currents in CA1 pyramidal neurons in GH and SH cohorts Cre plus scramble or Cre plus Maob shRNA. (D-F) Quantification of tonic GABA current (D), sIPSC amplitude (E), and sIPSC frequency (F) from the same cohorts and experimental conditions. Welch’s t-test. (G) Recording of Long-Term Potentiation (LTP) from the hippocampus in SH cohorts treated under control (Scramble) or Maob knockdown (Maob shRNA) genetic conditions. Welch’s t-test. (H) Schematic for Maob overexpression in hippocampal astrocytes and the timeline of the experimental paradigm. (I) Immunostaining for Maob in hippocampal astrocytes after Maob overexpression from GH paradigm. (n = 3 pairs of animals) Welch’s t-test. (J) NPR behavioral studies on GH cohorts from control or Maob overexpression groups (n = 7 animals in each group). Welch’s t-test. (K) Representative traces measuring tonic GABA currents in CA1 pyramidal neurons in control or Maob overexpression groups in the GH paradigm. (L-N) Quantification of tonic GABA current (L), sIPSC amplitude (M), and sIPSC frequency (N) from the same cohorts and experimental conditions. (n= 3 animals per group). Welch’s t-test. (O) Recording of Long-Term Potentiation (LTP) from the hippocampus in GH cohorts treated under control or Maob overexpression. Welch’s t-test. *p < 0.05; **p < 0.01; ***p < 0.001; ****p < 0.0001.
Figure 7.
Figure 7.. Knockdown of Best1 restores hippocampal circuit function after social deprivation
(A) Schematic of AAV-Cre and lentiviral-based shRNA approach for knocking down Best1 in hippocampal astrocytes and time line of experimental paradigm. (B) Immunostaining for Best1 in hippocampal astrocytes from SH cohort after Best1 knockdown paradigm. (n = 3 pairs of animals) Welch’s t-test (C) Representative traces measuring tonic GABA currents in CA1 pyramidal neurons in SH cohorts Cre plus scramble or Cre plus Best1 shRNA. (D-F) Quantification of tonic GABA current (D), sIPSC amplitude (E), and sIPSC frequency (F) from the same cohorts and experimental conditions. Welch’s t-test (G) Recording of Long-Term Potentiation (LTP) from the hippocampus in SH cohorts treated under control (Scramble) or Best1 knockdown (Best1 shRNA) genetic conditions. Welch’s t-test. *p < 0.05; ****p < 0.0001.

References

    1. Pollak SD, Nelson CA, Schlaak MF, Roeber BJ, Wewerka SS, Wiik KL, Frenn KA, Loman MM, and Gunnar MR (2010). Neurodevelopmental effects of early deprivation in postinstitutionalized children. Child Dev 81, 224–236. 10.1111/j.1467-8624.2009.01391.x. - DOI - PMC - PubMed
    1. Widom CS, DuMont K, and Czaja SJ (2007). A prospective investigation of major depressive disorder and comorbidity in abused and neglected children grown up. Arch. Gen. Psychiatry 64, 49–56. 10.1001/archpsyc.64.1.49. - DOI - PubMed
    1. Rubin KH, and Mills RSL (1988). The Many Faces of Social Isolation in Childhood. J Consult Clin Psych 56, 916–924. 10.1037/0022-006x.56.6.916. - DOI - PubMed
    1. Loades ME, Chatburn E, Higson-Sweeney N, Reynolds S, Shafran R, Brigden A, Linney C, McManus MN, Borwick C, and Crawley E (2020). Rapid Systematic Review: The Impact of Social Isolation and Loneliness on the Mental Health of Children and Adolescents in the Context of COVID-19. J Am Acad Child Psy 59, 1218–1239.e3. 10.1016/j.jaac.2020.05.009. - DOI - PMC - PubMed
    1. Cacioppo JT, Cacioppo S, Capitanio JP, and Cole SW (2015). The neuroendocrinology of social isolation. Annu Rev Psychol 66, 733–767. 10.1146/annurev-psych-010814-015240. - DOI - PMC - PubMed

Publication types

LinkOut - more resources