. 2023 Feb 22;290(1993):20222489.
doi: 10.1098/rspb.2022.2489. Epub 2023 Feb 15.

Scent mark signal investment predicts fight dynamics in house mice

Affiliations

Scent mark signal investment predicts fight dynamics in house mice

Caitlin H Miller et al. Proc Biol Sci. .

Abstract

Signals mediate competitive interactions by allowing rival assessment, yet are often energetically expensive to produce. One of the key mechanisms maintaining signal reliability is social costs. While the social costs of over-signalling are well known, the social costs of under-signalling are underexplored, particularly for dynamic signals. In this study, we investigate a dynamic and olfactory-mediated signalling system that is ubiquitous among mammals: scent marking. Male house mice territorially scent mark their environment with metabolically costly urine marks. Competitive male mice are thought to deposit abundant scent marks in the environment. However, we recently identified a cohort of low-marking males that win fights. We hypothesized that there may be social costs imposed on individuals who under-invest in signalling. Here we find that scent mark investment predicts fight dynamics. Winning males that produce fewer scent marks prior to a fight engage in more intense fights that take longer to resolve. This effect appears to be driven by an unwillingness among losers to acquiesce to weakly signalling winners. We, therefore, find evidence for rival assessment of scent marks as well as social costs to under-signalling. This supports existing hypotheses for the importance of social punishment in maintaining optimal signalling equilibria. Our results further highlight the possibility of diverse signalling strategies in house mice.

Keywords: house mice; scent marking; signal investment; social costs; strategy.


Conflict of interest statement

We declare we have no competing interests.

Figures
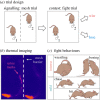
Figure 1.
Figure 1.
Trial design and recording methods. (a) Two-part trial design starting with a 30 min signalling trial where paired competitors were separated by a mesh barrier, and urine marking was measured. The mesh barrier was removed and males entered into the contest phase of the trial (fight trial) for an additional 30 min. (b) Urine depositions were recorded using thermal imaging. Urine exits the body hot and then cools below substrate temperatures, providing a distinct thermal signature. (c) For each fight trial, four aggressive behaviours were scored: wrestling, boxing, chases and hits. Wrestling and boxing were classified as intense attacks; chases and hits were classified as mild attacks.
Figure 2.
Figure 2.
Winners displayed more aggressive behaviours throughout the fight trial, while losers rarely displayed any aggression after the first 5 min. (a) Total aggressive behaviours performed by males that either won or lost the fight. (b) Histogram of the temporal distribution of aggressive behaviours performed by winners and losers over the fight trial duration. (c) Total mild versus intense aggression displayed by winners and losers. A linear mixed model was used to model relationships (electronic supplementary material, table S1) and a type III analysis of variance was used to test for overall effects. The dependent variable (no. of aggressive behaviours) was logarithmically transformed to meet assumptions for model residuals, and male identity (ID) was treated as a random effect in the model to account for the paired data structure. Significance codes: n.s., p > 0.05, ***p < 0.001. (a,c) Boxplot midlines: medians; box limits: upper and lower quartiles; whiskers: 1.5× interquartile range; points: outliers. (d,e) Histograms of intense versus mild aggression exhibited by winners over the course of the fight trial.
Figure 3.
Figure 3.
Temporal fight dynamics and intensity vary with the initial signalling effort of winning males. (a) Estimated marginal means plot of the contest aggression levels (log-transformed) given the initial marking effort (no. of urine marks) and attack intensity (mild versus intense) for winning males. (b) Estimated marginal means plot of contest aggression levels (log-transformed) by marking group, attack intensity, and 15 min time bins (first and second half of the fight trial) for winning males. (a,b) Linear mixed models (M4 and M5: electronic supplementary material, table S2) were used to assess relationships, and type III analyses of variance were used to test for overall effects (electronic supplementary material, table S2). The dependent variable (number of aggressive behaviours) was logarithmically transformed to meet assumptions for model residuals, and male identity (ID) was treated as a random effect in the model to account for the paired data structure. One male was excluded from these analyses owing to a zero value.
Figure 4.
Figure 4.
Proportion of intense aggression with signalling effort among winners. The proportion of intense-to-total attacks is plotted against the total number of urine marks deposited prior to the fight for all winning males. The linear model is fitted to the data (M6: electronic supplementary material, table S4). The following groups of males are labelled for visualization purposes: intensely aggressive low-marking winners (orange) and mildly aggressive high-marking winners (turquoise). One male was excluded from this analysis owing to a zero value.

References

    1. Parker GA. 1974. Assessment strategy and the evolution of fighting behaviour. J. Theor. Biol. 47, 223-243. (10.1016/0022-5193(74)90111-8) - DOI - PubMed
    1. Enquist M. 1985. Communication during aggressive interactions with particular reference to variation in choice of behaviour. Anim. Behav. 33, 1152-1161. (10.1016/S0003-3472(85)80175-5) - DOI
    1. Wagner WE. 1989. Fighting, assessment, and frequency alteration in Blanchard's cricket frog. Behav. Ecol. Sociobiol. 25, 429-436. (10.1007/BF00300189) - DOI
    1. Johnstone RA, Norris K. 1993. Badges of status and the cost of aggression. Behav. Ecol. Sociobiol. 32, 127-134. (10.1007/BF00164045) - DOI
    1. Backwell PRY, Christy JH, Telford SR, Jennions MD, Passmore J. 2000. Dishonest signalling in a fiddler crab. Proc. R. Soc. Lond. B 267, 719-724. (10.1098/rspb.2000.1062) - DOI - PMC - PubMed

Publication types

LinkOut - more resources