. 2023 Feb;11(2):e005509.
doi: 10.1136/jitc-2022-005509.

Clonal expansion of resident memory T cells in peripheral blood of patients with non-small cell lung cancer during immune checkpoint inhibitor treatment

Affiliations

Clonal expansion of resident memory T cells in peripheral blood of patients with non-small cell lung cancer during immune checkpoint inhibitor treatment

Hyunsu Kim et al. J Immunother Cancer. 2023 Feb.

Abstract

Background: Immune checkpoint inhibitors (ICIs) are an essential treatment for non-small cell lung cancer (NSCLC). Currently, the tumor-related intrinsic factors in response to ICIs have mostly been elucidated in tissue samples. However, tissue immune status and changes in the immune microenvironment can also be reflected and monitored through peripheral blood.

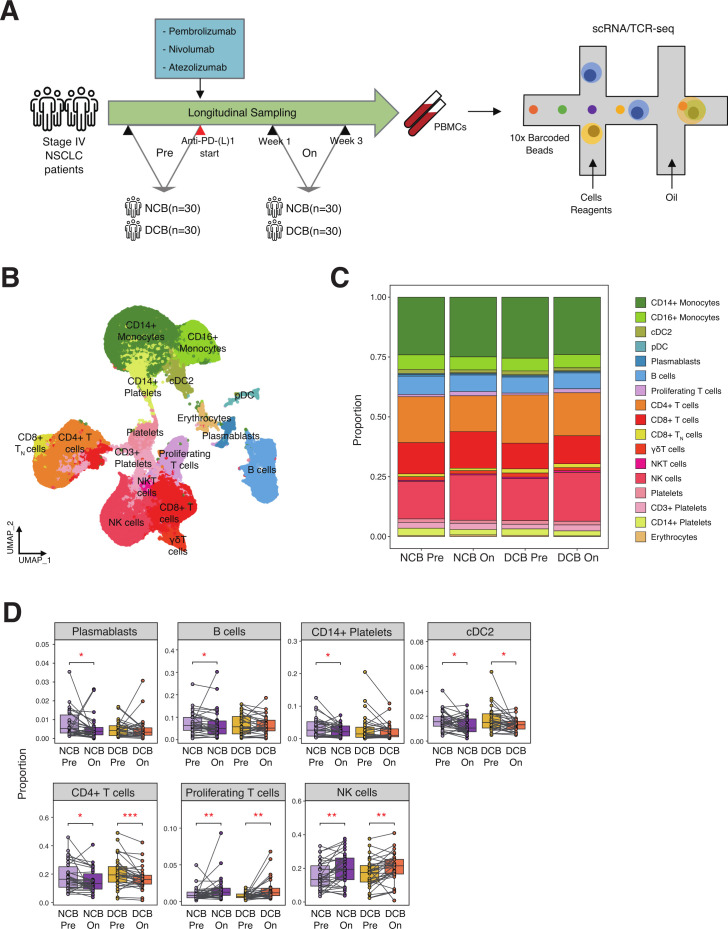
Methods: Single-cell RNA and T cell receptor (scTCR) sequencing were conducted using peripheral blood mononuclear cells (PBMCs) from 60 patients with stage IV NSCLC. Those samples were prospectively acquired from patients treated with anti-PD(L)-1 therapy for advanced lung cancer. Based on the clinical outcomes, samples were classified as durable clinical benefit (DCB) and non-durable clinical benefit (NCB). The samples constituted paired longitudinal samples, consisting of pre-treatment and on-treatment. Additionally, PBMC samples from 60 healthy donors from the Asian Immune Diversity Atlas project were used as a control.

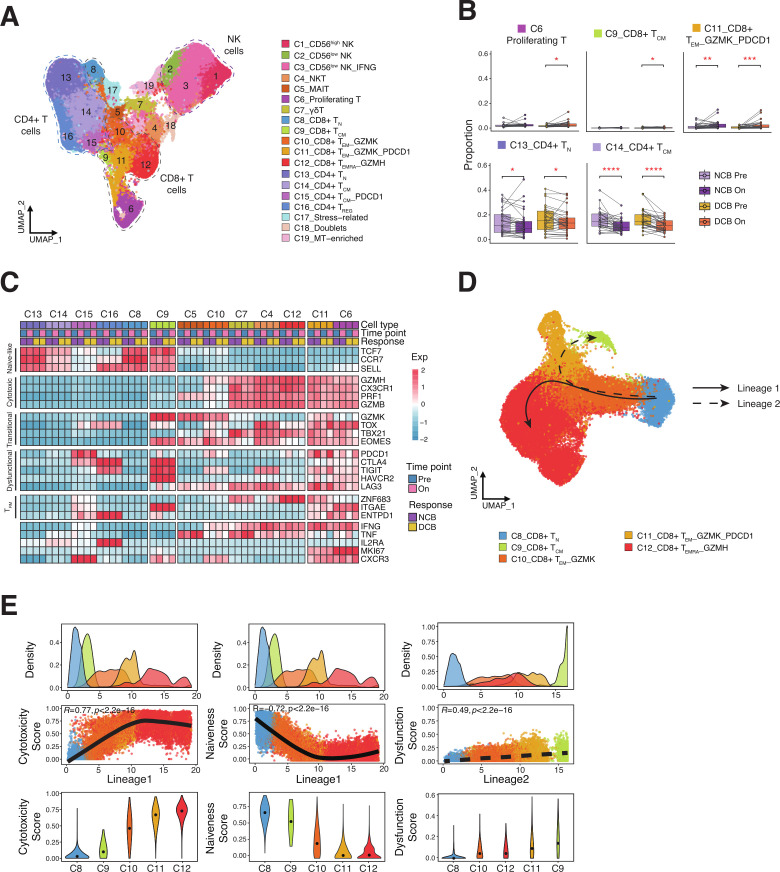
Results: The dynamic changes in major cell types between pre-treatment and on-treatment PBMCs were associated with an increase in proliferating T cells and NK cells in both DCB and NCB groups. Among T cell subtypes, effector memory CD8+ T cells (CD8+ TEM_GZMK_PDCD1) were increased after ICI treatment in both DCB and NCB. From the lineage trajectory analysis, effector memory CD8+ T cells resided at the bifurcation point, which has the potential to differentiate into lineages with precursor exhausted CD8+ T cells (CD8+ TCM cells) assumed to be related to the ICI response. From the scTCR-seq, effector memory CD8+ T cells along with T cells recognizing unknown antigen expanded and composed of novel clones skewed toward dysfunctional status, especially in on-treatment samples of the DCB group. The extent of immunophenotype conversion capabilities of the TCR with effector memory CD8+ T cells showed remarkable variation in the on-treatment sample in the DCB group.

Conclusion: A transitioning T cell subtype identified in PBMCs might be related to the prolonged ICI response. From our study, expansion of effector memory CD8+ T cells with novel TCRs in PBMCs after ICI treatment could contribute to a better clinical outcome in patients with NSCLC. This proof-of-concept research strengthens the use of non-invasive PBMCs in studying systemic changes of immune reactions related to the ICI treatment.

Keywords: Adaptive Immunity; Immunotherapy; Programmed Cell Death 1 Receptor; T-Lymphocytes; Tumor Biomarkers.


Conflict of interest statement

Competing interests: S-HL reports grants and personal fees from MSD, personal fees from Novartis, personal fees from AstraZeneca, personal fees from BMS, personal fees from Roche, outside the submitted work. W-YP is a founder and CEO of Geninus Inc. All remaining authors have declared no conflicts of interest.

Figures

Figure 1
Figure 1
Overview of study and analysis of representative cell types on immune checkpoint inhibitor (ICI) treatment. (A) Scheme of the overall study design. Peripheral blood mononuclear cells from stage IV non-small cell lung cancer patients (n=60) before and after ICIs were sequenced by 5’ scRNA and scTCR sequencing. (B) UMAP indicating cell types of 405,303 analyzed cells pre-treatment and on-treatment. (C) Bar plot showing distribution of subclusters from global cell types based on the clinical response (NCB and DCB) and the sampling time point (pre-treatment and on-treatment). (D) Box plot indicating proportion of cell types based on response (NCB=30, DCB=30) and sampling time point (pre-treatment=30, on-treatment=30). *p<0.05; **p<0.01; ***p<0.001; using Wilcoxon rank sum and signed-rank tests. DCB, durable clinical benefit; NCB, non-durable clinical benefit; NSCLC, non-small cell lung cancer; scTCR, single-cell T cell receptor.
Figure 2
Figure 2
State of T and NK cell subtypes and lineage analysis of CD8+ T cells. (A) UMAP visualization of 2 17 629 T cells and NK cells based on gene expression profile. The color legend applies to B–E. TN, naive T; TCM, central memory T; TEM, effector memory T; TEMRA, terminally differentiated effector memory T; TREG regulatory T cells. (B) Box plot showing the proportion of T cell subtypes based on clinical response and the sampling time point. *p<0.05; **p<0.01; ***p<0.001; ****p<0.0001; using Wilcoxon rank sum and signed-rank tests. (C) Heatmap indicates differential expression of selected genes by cell type. Z-score with range –2 to 2 from blue to red. Selected genes are grouped as naive-like, cytotoxic, transitional, dysfunctional, and TRM-associated. (D) Pseudo-time trajectories of CD8+ T cells. Two different trajectories were composed with different CD8+ T cell phenotypes from C8 to C12. (E) Density and correlation of pseudotime with cytotoxicity, naiveness, and dysfunction scores. Density plot displays density of CD8+ T cell subtypes at each lineage point. Solid black line and the top-left text (R) denote LOESS fit and Pearson’s correlation, respectively. Distribution of functional scores for each cluster was plotted on a violin plot. DCB, durable clinical benefit; NCB, non-durable clinical benefit.
Figure 3
Figure 3
States of expanded clones in TRUA and virus-specific T cells. (A) T and NK cells (127 843 total) were matched based on TCRs alpha or beta chain. (B) Clonal composition of T cells indicating the number of T cells obtained from TCR, the number of unique clonotypes, and the distribution of clonotypes along clonal sizes. (C) Pie charts indicating the cell type composition based on clinical response and sampling time point. (D) TRUA clonotypes classified four groups (expanded, contracted, large, and others). Proportion of these TRUA clonotypes was calculated based on clinical outcome. The right bar graph reflects the proportion of TRUA clonotypes excluding the ‘others’ group. The number at the top of the bar plot indicates total TRUA clonotypes. (E) The proportion of cell types constituting expanded TRUA and virus-specific T cell clones. DCB, durable clinical benefit; NCB, non-durable clinical benefit; TCR, T cell receptor; TURA, T cells recognizing unknown antigen.
Figure 4
Figure 4
Dysfunction score and clone size of T cells in transitional state in response to ICI. (A) Bubble plots indicating size of clones and the characteristics of cell types. Changes in cytotoxic and dysfunction score based on the cell types (top, left) and novelty (top, right) in TRUA. Similarly, cell types (bottom, left) and novelty (bottom, right) in virus-specific T cells. (B) Size distribution of TCR clones with proliferating T cells and CD8+ TEM_GZMK_PDCD1 based on the average value of dysfunction score. Line color shows subtypes of T cells. Each dot represents a single clone by sample. (C) Clone size were compared based on functional states (predysfunction, dysfunction) using dysfunction score cut-off 0.171. *p<0.05; **p<0.01; using Wilcoxon rank sum tests. (D) The extent of sharing TCRs between T cell subtypes. Sectors of circos plot indicate immunophenotypes of the shared TCR. Links represent the interaction between T cell subtypes. The width of links is the degree of transition calculated by STARTRAC. DCB, durable clinical benefit; ICI, immune checkpoint inhibitor; NCB, non-durable clinical benefit; TCR, T cell receptor; TRUA, T cells recognizing unknown antigen.

References

    1. Reck M, Rodríguez-Abreu D, Robinson AG, et al. . Five-Year outcomes with pembrolizumab versus chemotherapy for metastatic non-small-cell lung cancer with PD-L1 tumor proportion score ≥ 50. J Clin Oncol 2021;39:2339–49. 10.1200/JCO.21.00174 - DOI - PMC - PubMed
    1. Paz-Ares L, Ciuleanu T-E, Cobo M, et al. . First-line nivolumab plus ipilimumab combined with two cycles of chemotherapy in patients with non-small-cell lung cancer (CheckMate 9LA): an international, randomised, open-label, phase 3 trial. Lancet Oncol 2021;22:198–211. 10.1016/S1470-2045(20)30641-0 - DOI - PubMed
    1. Hellmann MD, Paz-Ares L, Bernabe Caro R, et al. . Nivolumab plus ipilimumab in advanced non-small-cell lung cancer. N Engl J Med 2019;381:2020–31. 10.1056/NEJMoa1910231 - DOI - PubMed
    1. Yi M, Jiao D, Xu H, et al. . Biomarkers for predicting efficacy of PD-1/PD-L1 inhibitors. Mol Cancer 2018;17:129. 10.1186/s12943-018-0864-3 - DOI - PMC - PubMed
    1. Pilard C, Ancion M, Delvenne P, et al. . Cancer immunotherapy: it's time to better predict patients' response. Br J Cancer 2021;125:927–38. 10.1038/s41416-021-01413-x - DOI - PMC - PubMed

Publication types

MeSH terms

Substances