. 2023 Feb 14;14(1):654.
doi: 10.1038/s41467-023-36135-6.

The gut microbiome and early-life growth in a population with high prevalence of stunting

Affiliations

The gut microbiome and early-life growth in a population with high prevalence of stunting

Ruairi C Robertson et al. Nat Commun. .

Abstract

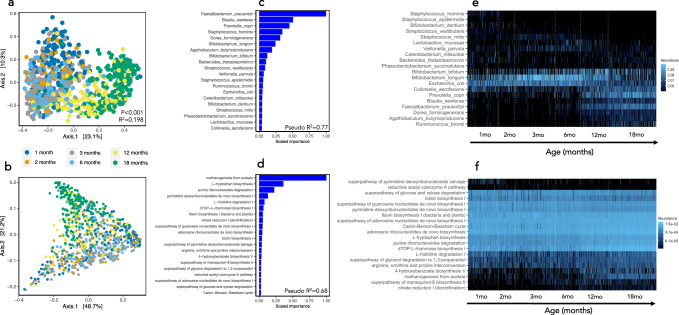
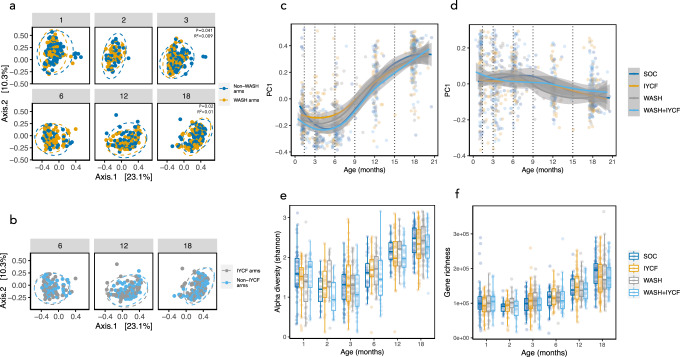
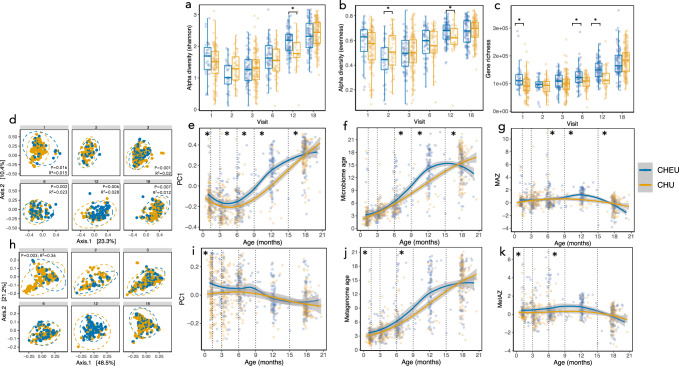
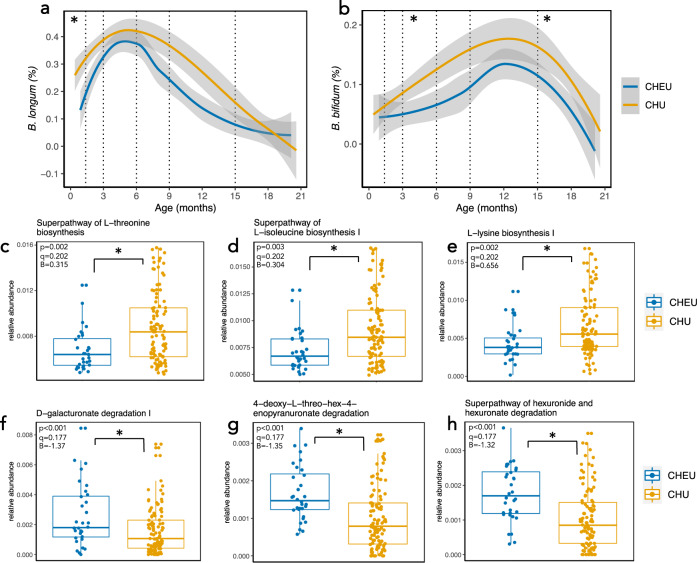
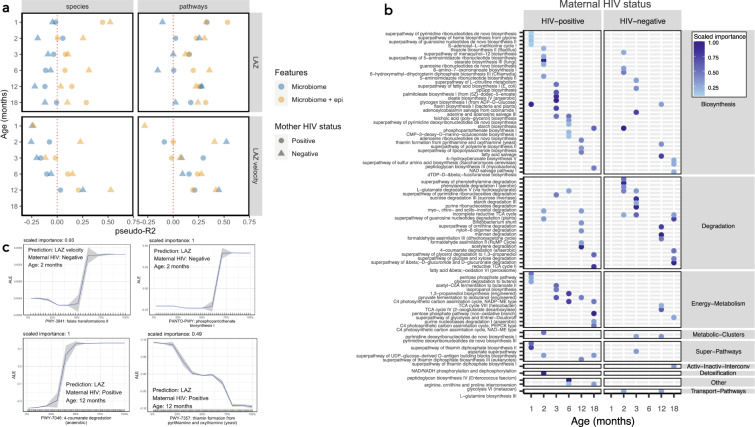
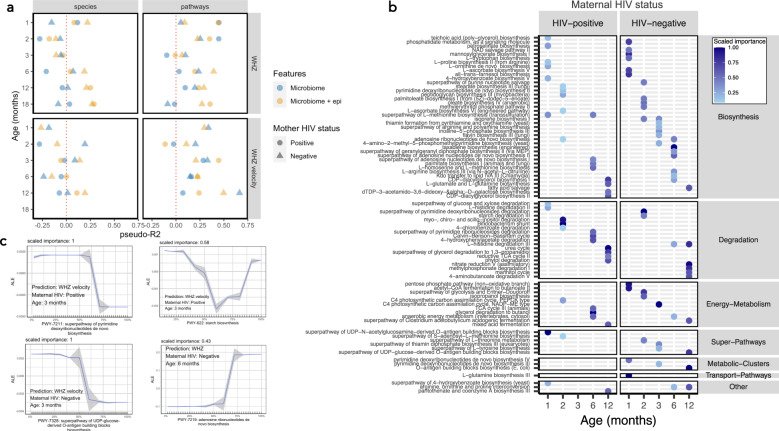
Stunting affects one-in-five children globally and is associated with greater infectious morbidity, mortality and neurodevelopmental deficits. Recent evidence suggests that the early-life gut microbiome affects child growth through immune, metabolic and endocrine pathways. Using whole metagenomic sequencing, we map the assembly of the gut microbiome in 335 children from rural Zimbabwe from 1-18 months of age who were enrolled in the Sanitation, Hygiene, Infant Nutrition Efficacy Trial (SHINE; NCT01824940), a randomized trial of improved water, sanitation and hygiene (WASH) and infant and young child feeding (IYCF). Here, we show that the early-life gut microbiome undergoes programmed assembly that is unresponsive to the randomized interventions intended to improve linear growth. However, maternal HIV infection is associated with over-diversification and over-maturity of the early-life gut microbiome in their uninfected children, in addition to reduced abundance of Bifidobacterium species. Using machine learning models (XGBoost), we show that taxonomic microbiome features are poorly predictive of child growth, however functional metagenomic features, particularly B-vitamin and nucleotide biosynthesis pathways, moderately predict both attained linear and ponderal growth and growth velocity. New approaches targeting the gut microbiome in early childhood may complement efforts to combat child undernutrition.


Conflict of interest statement

TJE was paid a scientific consulting fee in relation to the analysis of the data presented here by Zvitambo Institute for Maternal and Child Health Research. RCR declares remittance from Abbott Nutrition Health Institute (March 2022) and Nutricia (May 2021) for public conference talks outside the submitted work. All other authors declare that they have no competing interests.

Figures

Fig. 1
Fig. 1. Compositional and functional maturation of the gut microbiome of 335 infants from rural Zimbabwe from 1–18 months of age.
PCoA of Bray-Curtis distances of species (a; PERMANOVA; two-sided, p < 0.001) and metagenomic pathways (b; PERMANOVA; two-sided, p < 0.001) coloured by age category. The top 20 features and model pseudo-R2 from XGBoost models predicting age using species (c) or pathways (d) are ranked by scaled feature importance and relative abundance(0–1) plotted by age (e, f) to visualize taxonomic and functional microbiome succession from 1–18 months of age. n = 875 samples.
Fig. 2
Fig. 2. Impact of randomized WASH and IYCF interventions on infant gut microbiome.
PCoA of Bray-Curtis distances species composition coloured by WASH vs non-WASH arms (a), including PERMANOVA model results, and IYCF vs non-IYCF arms (b) are plotted (dotted lines represents 95% confidence ellipses; two-sided p-value) in addition to the first component (PC1) from PCoA of species (c) and pathways (d; lines represent smoothed conditional means and grey shaded areas represent 95% confidence intervals). The IYCF intervention was introduced after 6 months of age, therefore direct comparisons of IYCF vs non-IYCF arms are not shown in the 1-, 2- and 3-month age categories. No significant differences were observed in Shannon alpha diversity (e) and gene richness (f) according to trial arm (the band indicates the median, the box indicates the first and third quartiles and the whiskers indicate ±1.5 × interquartile range). n = 875 samples. WASH water sanitation and hygiene arm, IYCF infant and young child feeding arm, WASH + IYCF combined WASH and IYCF arm, SOC standard of care arm, Non-WASH the two arms that did not contain WASH interventions, Non-IYCF the two arms that did not contain IYCF interventions.
Fig. 3
Fig. 3. Maternal HIV infection comprehensively alters infant gut microbiome diversity and maturity.
Shannon alpha diversity (a), species richness (b) and gene richness (c) shows significant over-diversification in CHEU vs CHU (multivariate regression, two-sided *p < 0.05; the band indicates the median, the box indicates the first and third quartiles and the whiskers indicate ±1.5 × interquartile range). PCoA of Bray-Curtis distances (d) and PC1 (e) of species composition in CHEU vs CHU show significant differences throughout 18 months of life (PERMANOVA; two-sided p-value; dotted lines represent 95% confidence ellipses). Microbiome age (f) and microbiome-for-age Z score (MAZ; g) shows significant differences in gut microbiome maturity in CHEU vs CHU (multivariate linear regression analyses; *p < 0.05, two-sided). PCoA of microbiome gene pathways shows differences in CHEU vs CHU at 1 month of age (h, i; PERMANOVA, two-sided p-value) in addition to differences in metagenome-for-age Z-score (MetAZ) at 1 and 6 months of age (j, k; multivariate linear regression analyses; two-sided, *p < 0.05). Lines represent smoothed conditional means and grey shaded areas represent 95% confidence intervals. n = 859 samples. *p < 0.05. CHEU children who are HIV-exposed but uninfected, CHU children who are HIV-unexposed and uninfected, PC1 principle component 1.
Fig. 4
Fig. 4. Maternal HIV infection is associated with reduced abundance of Bifidobacteria abundance and amino acid biosynthesis genes.
Relative abundance(0–1) of Bifidobacterium longum (a) and B. bifidum (b) in the gut microbiome of CHEU and CHU at each age category via multivariate regression analyses (*q < 0.1; n = 859 samples total. Lines represent smoothed conditional means and grey shaded areas represent 95% confidence intervals). Multivariate regression of gene pathways demonstrates reduced abundance of amino acid biosynthetic pathways (c–e) and increase in abundance of pathways involved in degradation of sugar derivatives at 1 month of age (fh; n = 32 CHEU, n = 107 CHU; multivariate linear regression analyses adjusted for multiple comparisons using Benjamini–Hochberg correction; the band indicates the median, the box indicates the first and third quartiles and the whiskers indicate ±1.5 × interquartile range; two-sided p-value). Significance thresholds defined using MaAsLin2 defaults (*p < 0.05, q < 0.25).
Fig. 5
Fig. 5. Prediction of attained LAZ and LAZ velocity using XGBoost models.
Performance of XGBoost models as assessed by pseudo-R2 values for prediction of attained LAZ and LAZ velocity (LAZ increase per day to next study visit) using species or metagenomic pathways, stratified by age category and maternal HIV status (a). Models were run using microbiome features alone (species or metagenomic pathways; blue points) and in combination with epidemiological variables (yellow points). The top ranked pathways predicting LAZ at each age category are plotted (b), stratified by maternal HIV status and coloured by scaled importance in the XGBoost model (darkness of blue shading indicates feature ranking in the model). Accumulated effect plots (ALE) of representative pathways ranking highly in XGBoost model predictions display change in predicted linear growth (LAZ or LAZ velocity) by percentile of the feature abundance distribution (c). Tick marks on the x-axis are a rug plot of individual feature abundance percentiles. ALEs were generated using the ALEplot package and were plotted using ggplot2. Standard deviations (sd) were calculated per increment in microbiome feature and were used to calculate and plot increment-wise 95% confidence intervals as the average change in the outcome ±1.96(sd/sqrt(n)), where n is the number of observed feature values, and sd is the standard deviation of the change in the outcome variable in an interval. n = 856 and n = 460 samples for models predicting LAZ and LAZ velocity respectively.
Fig. 6
Fig. 6. Prediction of attained WHZ and WHZ velocity using XGBoost models.
Performance of XGBoost models as assessed by pseudo-R2 values for prediction of attained WHZ and WHZ velocity (WHZ increase per day to next study visit) using species or metagenomic pathways, stratified by age category and maternal HIV status (a). Models were run using microbiome features alone (species or metagenomic pathways; blue points) and in combination with epidemiological variables (yellow points). The top ranked pathways predicting WHZ at each age category are plotted (b), stratified by maternal HIV status and coloured by scaled importance in the XGBoost model (darkness of blue shading indicates feature ranking in the model). Accumulated effect plots (ALE) of representative pathways ranking highly in XGBoost model predictions display change in predicted linear growth (WHZ or WHZ velocity) by percentile of the feature abundance distribution (c). Tick marks on the x-axis are a rug plot of individual feature abundance percentiles. ALEs were generated using the ALEplot package and were plotted using ggplot2. Standard deviations (sd) were calculated per increment in microbiome feature and were used to calculate and plot increment-wise 95% confidence intervals as the average change in the outcome ±1.96(sd/sqrt(n)), where n is the number of observed feature values, and sd is the standard deviation of the change in the outcome variable in an interval. n = 854 and n = 455 for models predicting WHZ and WHZ velocity respectively.

Similar articles

Cited by

References

    1. Victora CG, et al. Revisiting maternal and child undernutrition in low-income and middle-income countries: variable progress towards an unfinished agenda. Lancet. 2021;397:1388–99.. doi: 10.1016/S0140-6736(21)00394-9. - DOI - PMC - PubMed
    1. Black RE, et al. Maternal and child undernutrition and overweight in low-income and middle-income countries. Lancet. 2013;382:427–51.. doi: 10.1016/S0140-6736(13)60937-X. - DOI - PubMed
    1. Prendergast AJ, Humphrey JH. The stunting syndrome in developing countries. Paediatr. Int Child Health. 2014;34:250–265. doi: 10.1179/2046905514Y.0000000158. - DOI - PMC - PubMed
    1. Dewey KG, Begum K. Long-term consequences of stunting in early life. Matern Child Nutr. 2011;7:5–18. doi: 10.1111/j.1740-8709.2011.00349.x. - DOI - PMC - PubMed
    1. Dewey KG, Stewart CP, Wessells KR, Prado EL, Arnold CD. Small-quantity lipid-based nutrient supplements for the prevention of child malnutrition and promotion of healthy development: overview of individual participant data meta-analysis and programmatic implications. Am. J. Clin. Nutr. 2021;114:3S–14S. doi: 10.1093/ajcn/nqab279. - DOI - PMC - PubMed

Publication types