. 2023 Feb 14;14(1):832.
doi: 10.1038/s41467-023-36544-7.

Quantifying portable genetic effects and improving cross-ancestry genetic prediction with GWAS summary statistics

Affiliations

Quantifying portable genetic effects and improving cross-ancestry genetic prediction with GWAS summary statistics

Jiacheng Miao et al. Nat Commun. .

Abstract

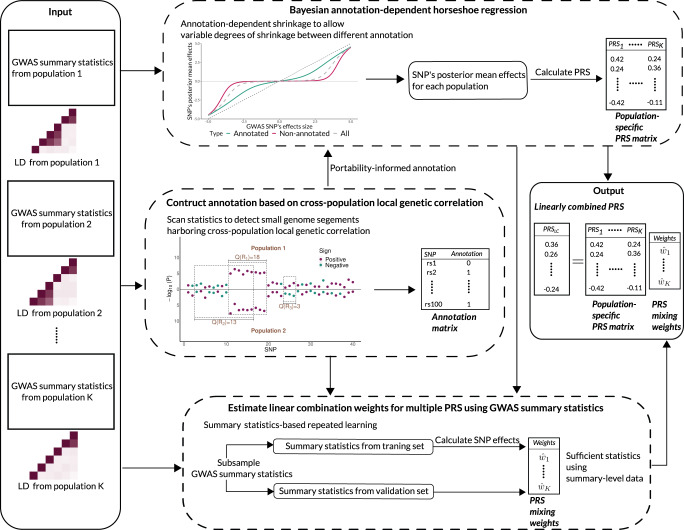
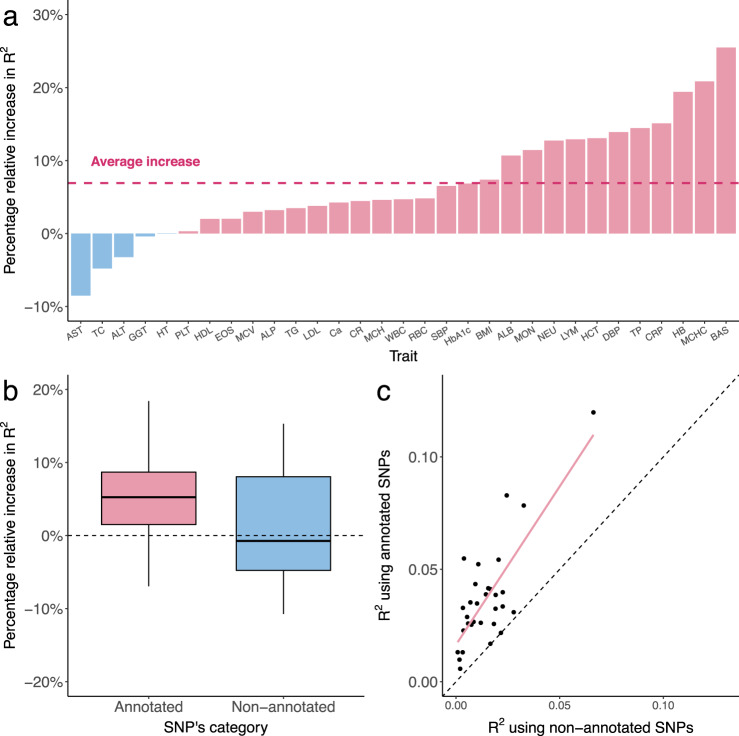
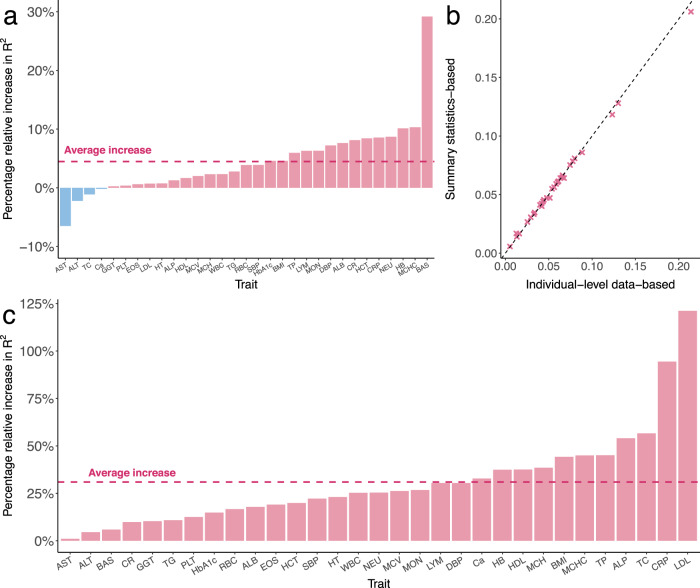
Polygenic risk scores (PRS) calculated from genome-wide association studies (GWAS) of Europeans are known to have substantially reduced predictive accuracy in non-European populations, limiting their clinical utility and raising concerns about health disparities across ancestral populations. Here, we introduce a statistical framework named X-Wing to improve predictive performance in ancestrally diverse populations. X-Wing quantifies local genetic correlations for complex traits between populations, employs an annotation-dependent estimation procedure to amplify correlated genetic effects between populations, and combines multiple population-specific PRS into a unified score with GWAS summary statistics alone as input. Through extensive benchmarking, we demonstrate that X-Wing pinpoints portable genetic effects and substantially improves PRS performance in non-European populations, showing 14.1%-119.1% relative gain in predictive R2 compared to state-of-the-art methods based on GWAS summary statistics. Overall, X-Wing addresses critical limitations in existing approaches and may have broad applications in cross-population polygenic risk prediction.


Conflict of interest statement

The authors declare no competing interests.

Figures

Fig. 1
Fig. 1. X-Wing workflow.
X-Wing uses GWAS summary statistics and population-matched LD references as input. It first employs a scan statistic approach to detect genome segments showing local genetic correlation between populations. Next, it incorporates the local genetic correlation annotation into a Bayesian PRS model, amplifying SNP effects that are correlated between populations. Finally, it uses summary statistics-based repeated learning to combine multiple population-specific PRS and produce the final PRS with improved accuracy.
Fig. 2
Fig. 2. X-Wing achieves superior statistical power in identifying cross-population local genetic correlation.
a, b Statistical power in simulations under a heritability enrichment framework. Power is defined as the proportion of simulation repeats that the true signal region is identified. Panels (a) and (b) illustrate results for continuous and binary trait outcomes, respectively. c Number of regions with significant cross-population genetic correlations identified by X-Wing and PESCA for 31 complex traits. d Proportion of total genetic covariance explained by significant local regions for 31 complex traits. Genetic covariance measures covariance of additive genetic component between two populations. In both panels (c) and (d), GWAS sample sizes are indicated by the color of each data point, and the diagonal line is highlighted in red.
Fig. 3
Fig. 3. X-Wing identifies genomic regions strongly enriched for correlated genetic effects between Europeans and East Asians.
a Scatter plot shows the proportion of SNPs in regions identified by X-Wing and the proportion of cross-population genetic covariance explained by these SNPs. All data points are above the diagonal line highlighted in red, showing substantial enrichment. b Cross-population genetic correlation for 31 complex traits. Three bars denote the global genetic correlation estimated from genome-wide data (light green), genetic correlation in regions identified by X-Wing (brown), and genetic correlation outside regions identified by X-Wing (dark green). Results for a simulated uncorrelated trait are labeled as ‘Control’. All traits are ordered according to the global genetic correlation estimates. Error bars indicate 95% confidence interval. The centre for the error bars represents the point estimates for genetic correlation. A list of trait acronyms can be found in Supplementary Data 7. c Bar plot shows the number of significant regions identified only in discovery stage (purple), only in replication stage (orange), and in both stages (blue) for four lipid traits. HDL, LDL, TC, TG stand for HDL cholesterol, LDL cholesterol, total cholesterol, and triglycerides, respectively. d Cumulative proportion of genetic covariance explained by regions identified in the discovery stage for triglycerides. Analogous results for HDL cholesterol, LDL cholesterol, and total cholesterol are shown in Supplementary Fig. 6. Pink dashed line indicates FDR cutoff of 0.05. Red line represents the diagonal line of y = x. Genetic correlation and genetic covariance were calculated using XPASS.
Fig. 4
Fig. 4. Local genetic correlation annotation improves PRS prediction accuracy for 31 traits in East Asians.
a The percentage relative increase in R2 for prediction accuracy of annotation-informed European PRS over PRS-CSx European PRS. A list of trait acronyms can be found in Supplementary Data 7. b The percentage relative increase in R2 for prediction accuracy of annotation-informed over PRS-CSx European PRS using only annotated and non-annotated SNPs (n = 31 traits). In the boxplot, the center line, box limits and whiskers denote the median, upper and lower quartiles, and 1.5 × interquartile range, respectively. c Comparison of R2 between annotation-informed European PRS using only annotated and non-annotated SNPs. Each point represents a trait. X-axis is the R2 for PRS based on non-annotated SNPs. Y-axis is the R2 for PRS based on annotated SNPs.
Fig. 5
Fig. 5. Performance of X-Wing in combining population-specific PRS using GWAS summary statistics for 31 traits in East Asian samples.
a The percentage relative increase in R2 of X-Wing PRS over PRS-CSx. The dashed line represents the average increase. A list of trait acronyms can be found in Supplementary Data 5. b Comparison of R2 for linearly combined PRS with mixing weights obtained using GWAS summary statistics and individual-level data. The X-axis represents the R2 using weights estimated from individual-level data, while the Y-axis shows the R2 using summary statistics-based weights. The dashed line represents the diagonal line of y = x. c The percentage relative increase in R2 of X-Wing PRS over PRS-CSx using GWAS summary statistics. PRS-CSx PRS is calculated based on European posterior mean effects. The dashed line represents the average increase.

References

    1. Tam V, et al. Benefits and limitations of genome-wide association studies. Nat. Rev. Genet. 2019;20:467–484. doi: 10.1038/s41576-019-0127-1. - DOI - PubMed
    1. Visscher PM, et al. 10 years of GWAS discovery: Biology, function, and translation. Am. J. Hum. Genet. 2017;101:5–22. doi: 10.1016/j.ajhg.2017.06.005. - DOI - PMC - PubMed
    1. Becker J, et al. Resource profile and user guide of the polygenic index repository. Nat. Hum. Behav. 2021;5:1744–1758. doi: 10.1038/s41562-021-01119-3. - DOI - PMC - PubMed
    1. Ma Y, Zhou X. Genetic prediction of complex traits with polygenic scores: A statistical review. Trends Genet. 2021;37:995–1011. doi: 10.1016/j.tig.2021.06.004. - DOI - PMC - PubMed
    1. Miao J, et al. A quantile integral linear model to quantify genetic effects on phenotypic variability. Proc. Natl Acad. Sci. 2022;119:e2212959119. doi: 10.1073/pnas.2212959119. - DOI - PMC - PubMed

Publication types

MeSH terms