. 2023 Feb 14;13(1):2631.
doi: 10.1038/s41598-023-29606-9.

A small-dataset-trained deep learning framework for identifying atoms on transmission electron microscopy images

Affiliations

A small-dataset-trained deep learning framework for identifying atoms on transmission electron microscopy images

Yuan Chen et al. Sci Rep. .

Abstract

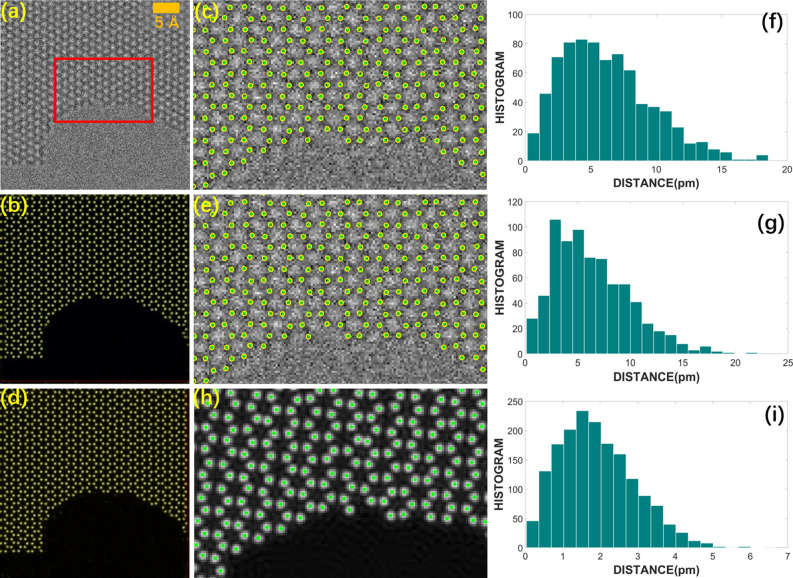
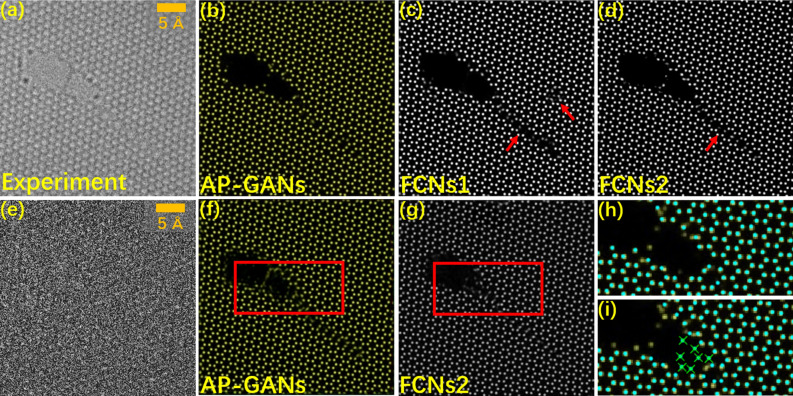
To accurately identify atoms on noisy transmission electron microscope images, a deep learning (DL) approach is employed to estimate the map of probabilities at each pixel for being an atom with element discernment. Thanks to a delicately-designed loss function and the ability to extract features, the proposed DL networks can be trained by a small dataset created from approximately 30 experimental images, each with a size of 256 × 256 pixels2. The accuracy and robustness of the network were verified by resolving the structural defects of graphene and polar structures in PbTiO3/SrTiO3 multilayers from both the general TEM images and their imitated images on which intensities of some pixels lost randomly. Such a network has the potential to identify atoms from very few images of beam-sensitive material and explosive images recorded in a dynamical atomic process. The idea of using a small-dataset-trained DL framework to resolve a specific problem may prove instructive for practical DL applications in various fields.


Conflict of interest statement

The authors declare no competing interests.

Figures

Figure 1
Figure 1
Application of AP-GANs towards identifying atomic columns on images at the atomic scale. (a, b) Schematic architectures of (a) generator and (b) discriminator in AP-GANs and disassemble layers are at the below. The green ball represents the input and the output of a residual block are added element by element. In (b), a thicker yellow layer represents more filters involved in Convolution2D. (c) Schematics of the “semi-supervised” approach. One schematic input–output pair in the training set is enclosed by a red dashed box in the bottom left corner.
Figure 2
Figure 2
Predictions and their accuracy of modes trained via a mixture of simulated images and experimental images. (ad) Two sets of the input–output image pairs. (a) An input image intercepted from one experimental image, and (b) the output image prepared from the atomic positions identified by using the traditional method. (c) A simulated input image and (d) the output image with atoms plotted according to its known structure. (e) An experimental image in the test set and (f) its prediction. (g) The region extracted from the red box in (e), in which the yellow circles are the positions of the atoms measured from the probability map. (hm) Evolution of the line defects and the holes in graphene extracted from the (h) 1st, (i) 10th, (j) 15th, (k) 20th, (l) 25th and (m) 30th frames in this image series.
Figure 3
Figure 3
The precision of networks trained by different training sets. (a) A simulated image in the test set, and (b) its probability map predicted from the AP-GANs trained by the training set mixed with the simulated and experimental input–output image pairs. (c) A region extracted from (a), on which yellow circles are atom positions measured from (b). (d) The probability map predicted from the AP-GANs trained by the simulated training set. (e) A region extracted from (a), on which yellow circles are atom positions measured from (d). (f, g) Histogram of position errors between the true and those measured from the (c) and (e) image, respectively. And the errors are counted from approximately 800 positions. (h) Atoms are measured directly from the phase of the simulated wave of (a) with the assistance of CalAtom software. (i) Histogram of errors between the ground truth and those measured from (h).
Figure 4
Figure 4
Comparison of the predictions of AP-GANs, FCNs1 and FCNs2 for the same experimental images in the test set. (a) The experimental image, and (bd) their probability maps were obtained via (b) the proposed AP-GANs, (c) FCNs1 in and (d) FCNs2 in . (e) Imitated low-dose image simulated from (a). (f, g) Atom maps were predicted by using (f) AP-GANs and (g) FCNs2, respectively. (h, i) Regions extracted from (f) and (g), respectively. The darker yellow dots were estimated from (a) normal images via using AP-GANs and FCNs2, and green dots were predicted by ARP and green crosses highlight the clear artefacts.
Figure 5
Figure 5
Probability map with element discernment and atom displacement vector map on STEM images of PbTiO3/SrTiO3 superlattice. (a) One experimental STEM image of PbTiO3/SrTiO3 superlattice in the test set. Purple, red, green, and yellow balls denote the positions of Sr2+, Pb2+, Ti4+, and O2- columns respectively, and orange dashed lines indicate the interface between PbTiO3 and SrTiO3. (b) The compressed image simulated from the red region of (a). (c, d) Probability maps with element discernment and (e, f) Ti atom displacement vector maps relating to polarization, corresponding to the red region of (a) and predicted from experimental STEM images in (c, e) traditional mode and (d, f) compressed mode. (g) The magnified displacement of each position was obtained by comparing (d) with (c). The inserts are the absolute displacements of all positions with units of pixels. Red and blue arrows (dots) represent the Ti and Pb/Sr sites, respectively.

References

    1. Zhang QH, et al. Near-room temperature ferromagnetic insulating state in highly distorted LaCoO2.5 with CoO5 square pyramids. Nat. Commun. 2021;12:1853. doi: 10.1038/s41467-021-22099-y. - DOI - PMC - PubMed
    1. Niu KD, et al. Direct visualization of large-scale intrinsic atomic lattice structure and its collective anisotropy in air-sensitive monolayer 1T’. Adv. Sci. 2021;8:2101563. doi: 10.1002/advs.202101563. - DOI - PMC - PubMed
    1. Hou FC, et al. Te-vacancy-induced surface collapse and reconstruction in antiferromagnetic topological insulator MnBi2Te4. ACS Nano. 2020;14:11262–11272. doi: 10.1021/acsnano.0c03149. - DOI - PubMed
    1. Du K, et al. Manipulating topological transformations of polar structures through real-time observation of the dynamic polarization evolution. Nat. Commun. 2019;10:4864. doi: 10.1038/s41467-019-12864-5. - DOI - PMC - PubMed
    1. Li XM, et al. Atomic-scale observations of electrical and mechanical manipulation of topological polar flux closure. PNAS. 2020;117:18954–18961. doi: 10.1073/pnas.2007248117. - DOI - PMC - PubMed