

Total and regional appendicular skeletal muscle mass prediction from dual-energy X-ray absorptiometry body composition models
- PMID: 36788294
- PMCID: PMC9929067
- DOI: 10.1038/s41598-023-29827-y
Total and regional appendicular skeletal muscle mass prediction from dual-energy X-ray absorptiometry body composition models
Erratum in
-
Publisher Correction: Total and regional appendicular skeletal muscle mass prediction from dual-energy X-ray absorptiometry body composition models.Sci Rep. 2023 Aug 9;13(1):12922. doi: 10.1038/s41598-023-39896-8. Sci Rep. 2023. PMID: 37558734 Free PMC article. No abstract available.
Abstract
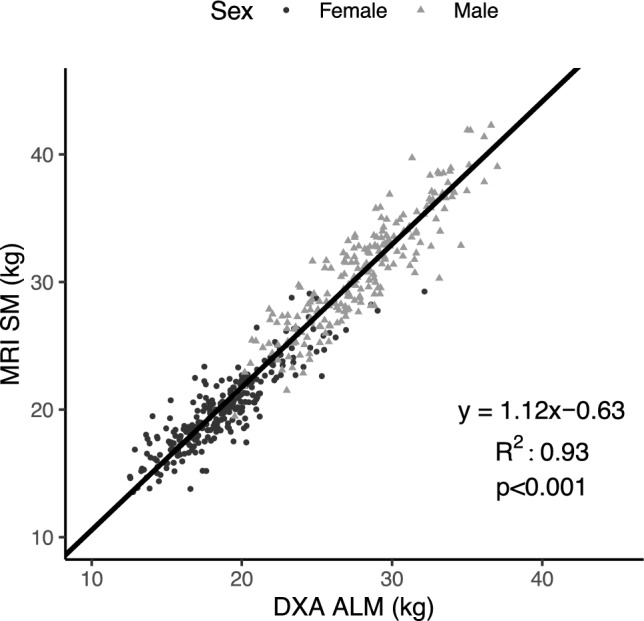
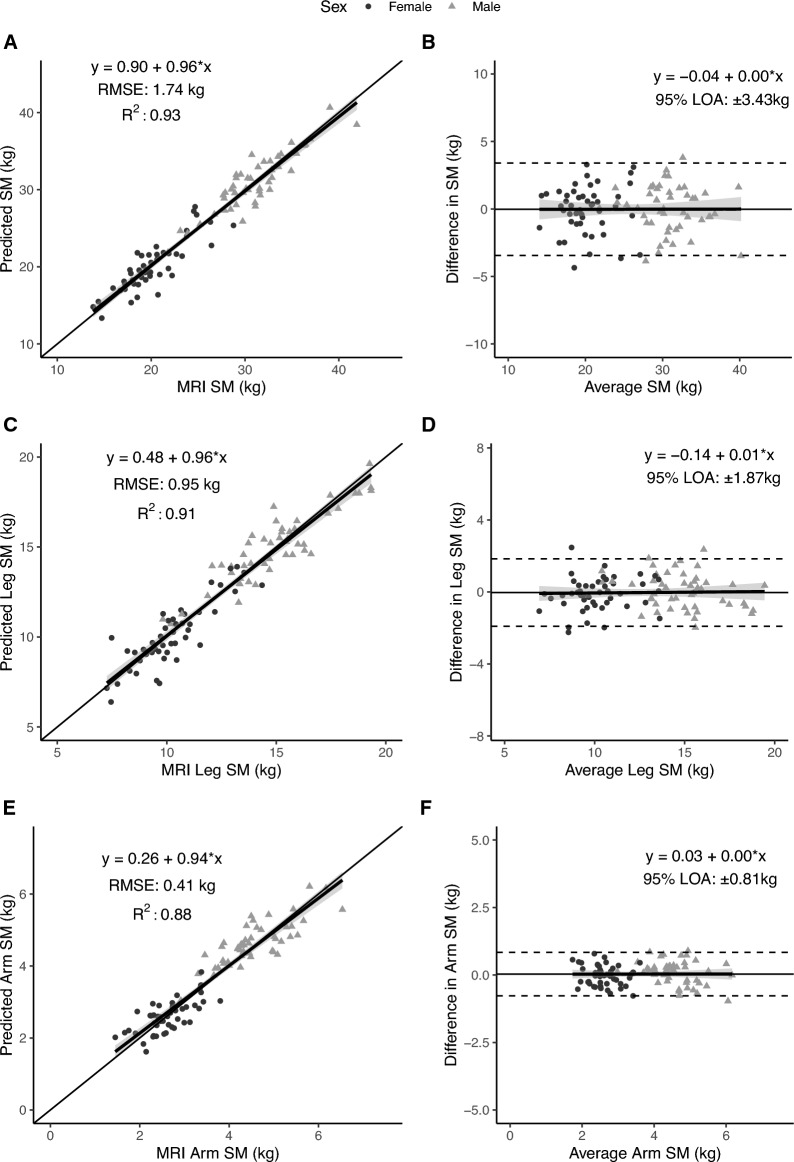
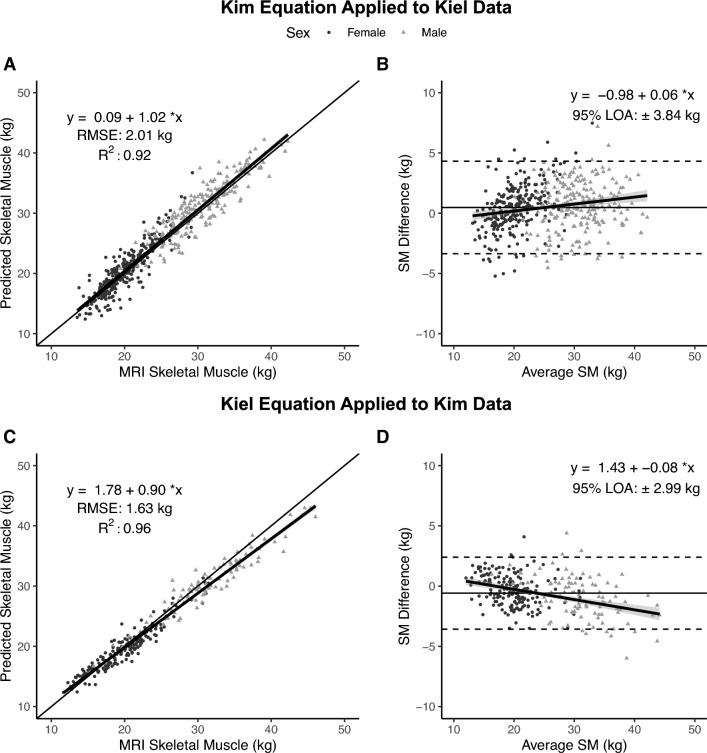
Sarcopenia, sarcopenic obesity, frailty, and cachexia have in common skeletal muscle (SM) as a main component of their pathophysiology. The reference method for SM mass measurement is whole-body magnetic resonance imaging (MRI), although dual-energy X-ray absorptiometry (DXA) appendicular lean mass (ALM) serves as an affordable and practical SM surrogate. Empirical equations, developed on relatively small and diverse samples, are now used to predict total body SM from ALM and other covariates; prediction models for extremity SM mass are lacking. The aim of the current study was to develop and validate total body, arm, and leg SM mass prediction equations based on a large sample (N = 475) of adults evaluated with whole-body MRI and DXA for SM and ALM, respectively. Initial models were fit using ordinary least squares stepwise selection procedures; covariates beyond extremity lean mass made only small contributions to the final models that were developed using Deming regression. All three developed final models (total, arm, and leg) had high R2s (0.88-0.93; all p < 0.001) and small root-mean square errors (1.74, 0.41, and 0.95 kg) with no bias in the validation sample (N = 95). The new total body SM prediction model (SM = 1.12 × ALM - 0.63) showed good performance, with some bias, against previously reported DXA-ALM prediction models. These new total body and extremity SM prediction models, developed and validated in a large sample, afford an important and practical opportunity to evaluate SM mass in research and clinical settings.
© 2023. The Author(s).
Conflict of interest statement
SBH reports his role on the Medical Advisory Boards of Tanita Corporation, Amgen, and Medifast. GMT has received support for his research laboratory, in the form of research grants or equipment loan or donation, from manufacturers of body composition assessment devices, including Size Stream LLC; Naked Labs Inc.; Prism Labs Inc.; RJL Systems; MuscleSound; and Biospace, Inc. The other authors and their close relatives and their professional associates have no financial interests in the study outcome, nor do they serve as an officer, director, member, owner, trustee, or employee of an organization with a financial interest in the outcome or as an expert witness, advisor, consultant, or public advocate on behalf of an organization with a financial interest in the study outcome.
Figures
References
Publication types
MeSH terms
Grants and funding
LinkOut - more resources
Full Text Sources
Medical
