

Activity patterns are associated with fractional lifespan, memory, and gait speed in aged dogs
- PMID: 36788306
- PMCID: PMC9929073
- DOI: 10.1038/s41598-023-29181-z
Activity patterns are associated with fractional lifespan, memory, and gait speed in aged dogs
Abstract
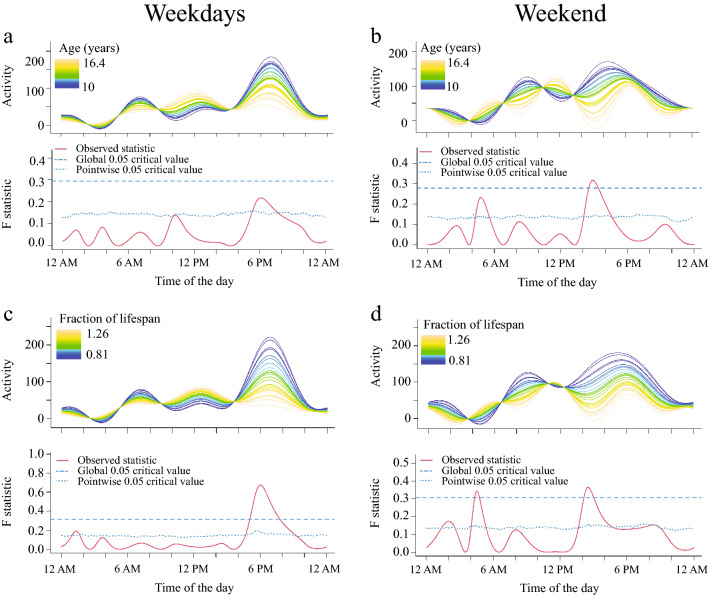
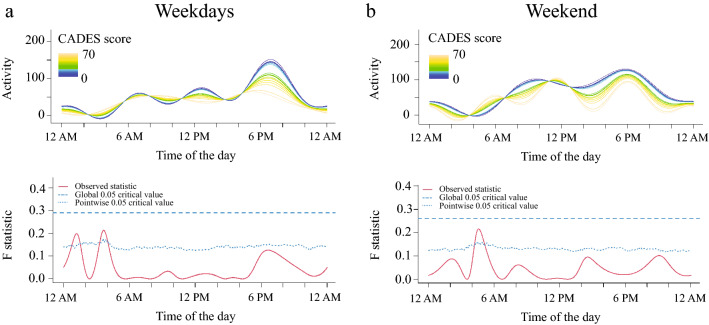
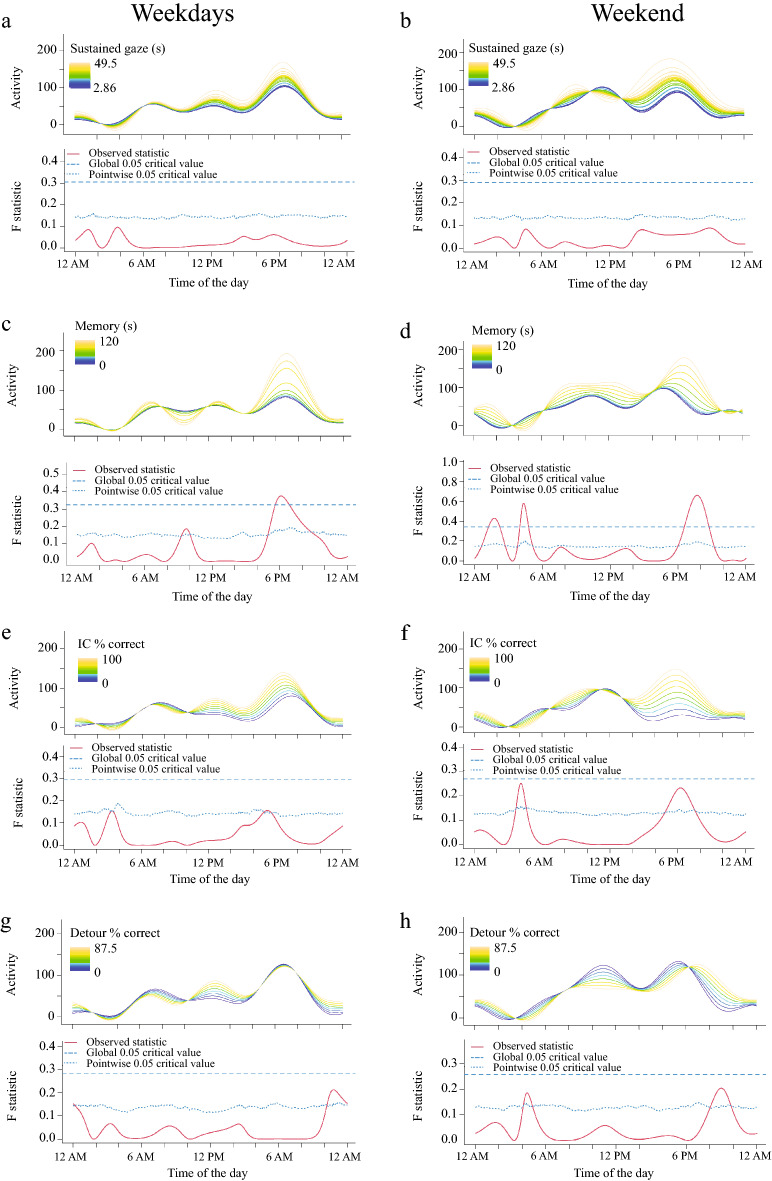
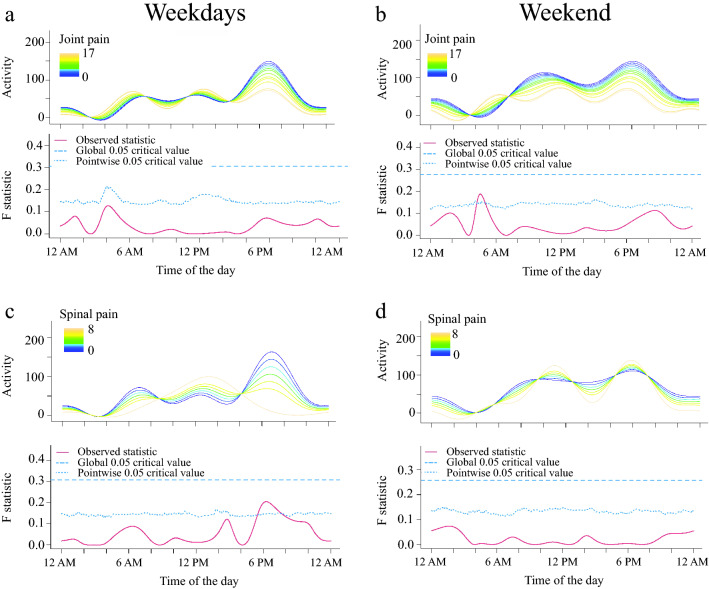
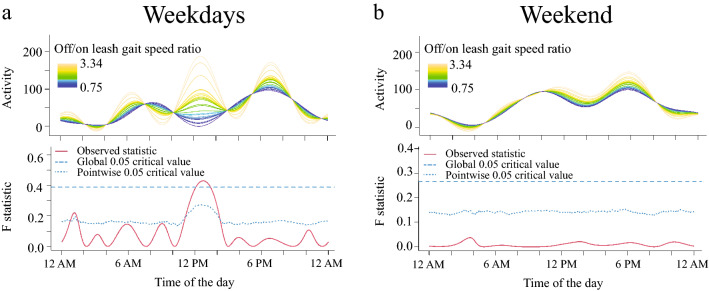
Maintaining an active lifestyle is considered a hallmark of successful aging. Physical activity significantly reduces the risk of cognitive decline and Alzheimer's disease in humans. However, pain and lack of motivation are important barriers to exercise. Dogs are a remarkable model for translational studies in aging and cognition as they are prone to Canine Cognitive Dysfunction syndrome, which has many similarities with Alzheimer's disease. According to owner reports, changes in activity levels are characteristic of this syndrome, with decreased daytime activity, but also excessive pacing, especially at sleep time. We used physical activity monitors to record the activity of 27 senior dogs and evaluated the association between activity level and age, fractional lifespan, cognitive status measured by an owner questionnaire and cognitive tests. We also assessed the relationship between activity and joint/spinal pain, and the off/on leash gait speed ratio (a potential marker of gait speed reserve and motivation). We found that activity patterns in dogs are associated with fractional lifespan and working memory. Additionally, dogs with higher on/off leash gait speed are more active in the afternoon of weekdays. These results encourage future studies evaluating how physical activity can improve or delay cognitive impairment in senior dogs.
© 2023. The Author(s).
Conflict of interest statement
The authors declare no competing interests.
Figures
Similar articles
-
Winning the race with aging: age-related changes in gait speed and its association with cognitive performance in dogs.Front Vet Sci. 2023 Jun 15;10:1150590. doi: 10.3389/fvets.2023.1150590. eCollection 2023. Front Vet Sci. 2023. PMID: 37396989 Free PMC article.
-
Association of Combined Slow Gait and Low Activity Fragmentation With Later Onset of Cognitive Impairment.JAMA Netw Open. 2021 Nov 1;4(11):e2135168. doi: 10.1001/jamanetworkopen.2021.35168. JAMA Netw Open. 2021. PMID: 34792590 Free PMC article.
-
Associations between physical activity and cognitive dysfunction in older companion dogs: results from the Dog Aging Project.Geroscience. 2023 Apr;45(2):645-661. doi: 10.1007/s11357-022-00655-8. Epub 2022 Sep 21. Geroscience. 2023. PMID: 36129565 Free PMC article.
-
The Association Between Gait Speed and Cognitive Status in Community-Dwelling Older People: A Systematic Review and Meta-analysis.J Gerontol A Biol Sci Med Sci. 2019 May 16;74(6):943-948. doi: 10.1093/gerona/gly140. J Gerontol A Biol Sci Med Sci. 2019. PMID: 29917045
-
Measuring gait speed to better identify prodromal dementia.Exp Gerontol. 2019 Sep;124:110625. doi: 10.1016/j.exger.2019.05.014. Epub 2019 Jun 4. Exp Gerontol. 2019. PMID: 31173841 Review.
Cited by
-
Cross-sectional and longitudinal analysis of health-related quality of life (HRQoL) in senior and geriatric dogs.PLoS One. 2024 Sep 4;19(9):e0301181. doi: 10.1371/journal.pone.0301181. eCollection 2024. PLoS One. 2024. PMID: 39231144 Free PMC article.
-
Factors influencing, and associated with, physical activity patterns in dogs with osteoarthritis-associated pain.Front Vet Sci. 2025 Mar 19;12:1503009. doi: 10.3389/fvets.2025.1503009. eCollection 2025. Front Vet Sci. 2025. PMID: 40177669 Free PMC article.
-
Where did my dog go? A pilot study exploring the movement ecology of farm dogs.Front Vet Sci. 2024 Jan 8;10:1325609. doi: 10.3389/fvets.2023.1325609. eCollection 2023. Front Vet Sci. 2024. PMID: 38260201 Free PMC article.
-
Evaluation of risk factors for sleep-disordered breathing in dogs.J Vet Intern Med. 2024 Mar-Apr;38(2):1135-1145. doi: 10.1111/jvim.17019. Epub 2024 Feb 15. J Vet Intern Med. 2024. PMID: 38358051 Free PMC article.
-
A randomized, controlled clinical trial demonstrates improved owner-assessed cognitive function in senior dogs receiving a senolytic and NAD+ precursor combination.Sci Rep. 2024 May 29;14(1):12399. doi: 10.1038/s41598-024-63031-w. Sci Rep. 2024. PMID: 38811634 Free PMC article.
References
MeSH terms
LinkOut - more resources
Full Text Sources
Medical
