

Ten-year longitudinal changes in muscle power, force, and velocity in young, middle-aged, and older adults
- PMID: 36788413
- PMCID: PMC10067493
- DOI: 10.1002/jcsm.13184
Ten-year longitudinal changes in muscle power, force, and velocity in young, middle-aged, and older adults
Abstract
Background: Maximum muscle power (Pmax ) is a biomarker of physical performance in all ages. No longitudinal studies have assessed the effects of aging on Pmax obtained from the torque-velocity (T-V) relationship, which should be considered the 'gold standard'. This study evaluated the longitudinal changes in the T-V relationship and Pmax of the knee-extensor muscles in young, middle-aged, and older adults after 10 years of follow-up.
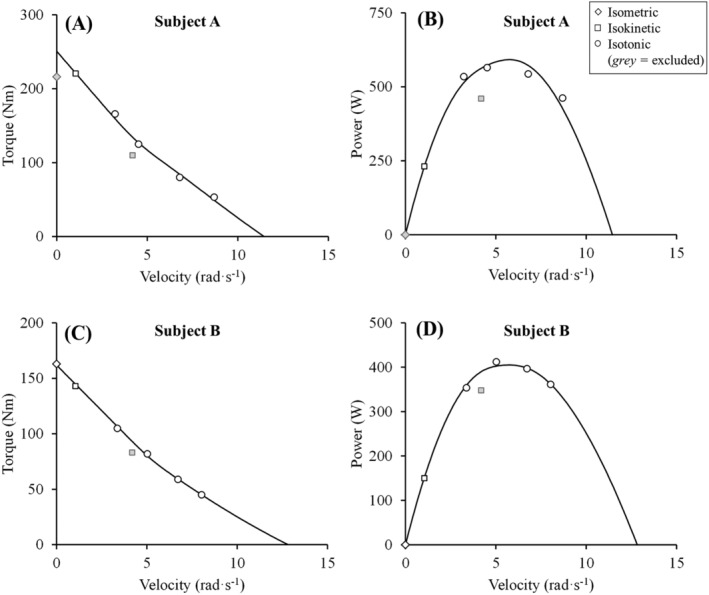
Methods: Four hundred eighty-nine subjects (311 men and 178 women; aged 19-68 years) were tested at baseline and after a 10-year follow-up. Anthropometric data, daily protein intake, physical activity level (PAL), and knee-extension muscle function (isometric, isokinetic, and isotonic) were evaluated. A novel hybrid equation combining a linear and a hyperbolic (Hill-type) region was used to obtain the T-V relationship and Pmax of the participants, who were grouped by sex and age (young: 20-40 years; middle-aged: 40-60 years; and old: ≥60 years). Linear mixed-effect models were used to assess effects of time, sex, and age on T-V parameters, Pmax , and body mass index (BMI). Additional analyses were performed to adjust for changes in daily protein intake and PAL.
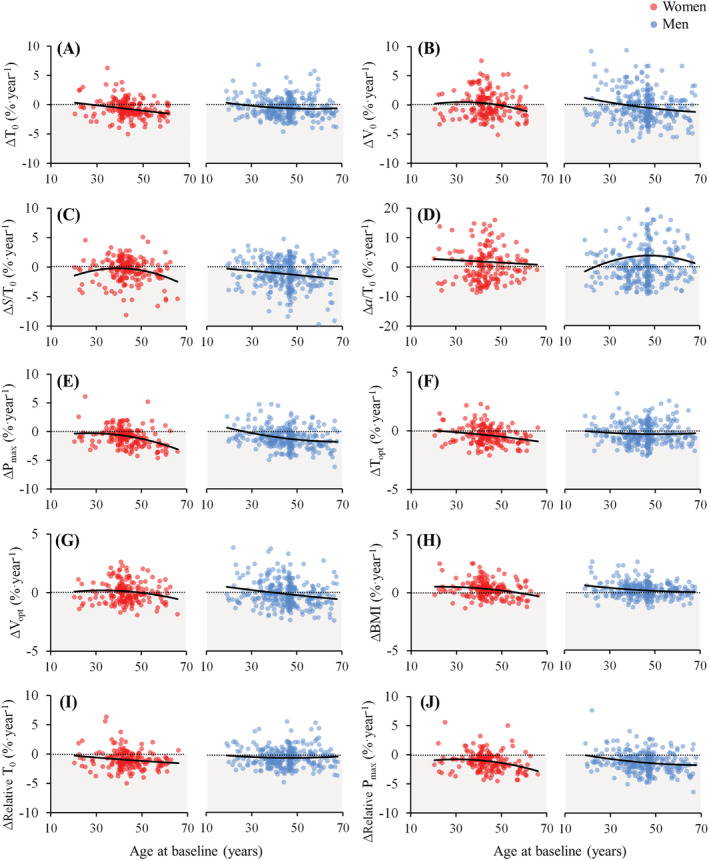
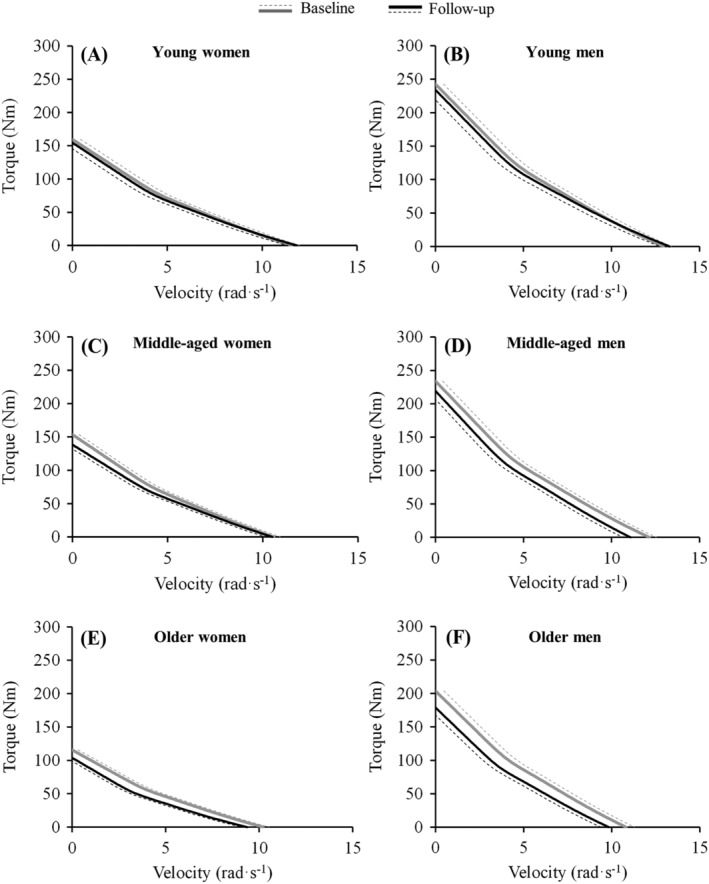
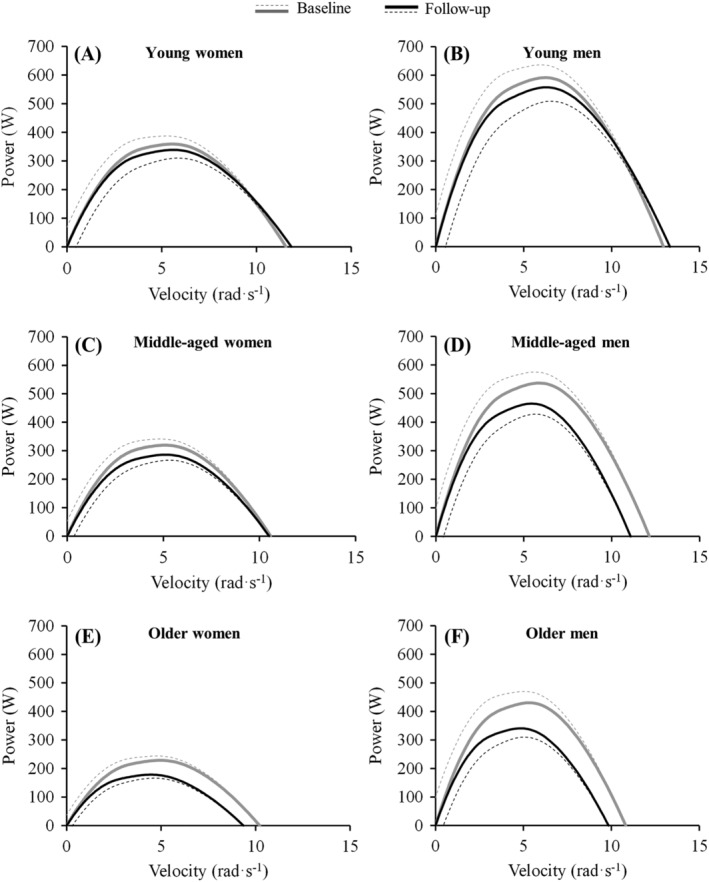
Results: Pmax decreased in young men (-0.6% per year; P < 0.001), middle-aged men and women (-1.1% to -1.4% per year; P < 0.001), and older men and women (-2.2% to -2.4% per year; P ≤ 0.053). These changes were mainly related to decrements in torque at Pmax at early age and to decrements in both torque and velocity at Pmax at older age. BMI increased among young and middle-aged adults (0.2% to 0.5% per year; P < 0.001), which led to greater declines in relative Pmax in those groups. S/T0 , that is, the linear slope of the T-V relationship relative to maximal torque, exhibited a significant decline over time (-0.10%T0 ·rad·s-1 per year; P < 0.001), which was significant among middle-aged men and old men and women (all P < 0.05). Annual changes in PAL index were significantly associated to annual changes in Pmax (P = 0.017), so the overall decline in Pmax was slightly attenuated in the adjusted model (-5.26 vs. -5.05 W per year; both P < 0.001).
Conclusions: Pmax decreased in young, middle-aged, and older adults after a 10-year follow-up. The early declines in Pmax seemed to coincide with declines in force, whereas the progressive decline at later age was associated with declines in both force and velocity. A progressively blunted ability to produce force, especially at moderate to high movement velocities, should be considered a specific hallmark of aging.
Keywords: Aging; Force-velocity; Knee extension; Sarcopenia; Torque; Torque-velocity.
© 2023 The Authors. Journal of Cachexia, Sarcopenia and Muscle published by John Wiley & Sons Ltd on behalf of Society on Sarcopenia, Cachexia and Wasting Disorders.
Conflict of interest statement
The authors declare no conflicts of interest.
Figures
References
-
- Valenzuela PL, McGuigan M, Sánchez‐Martínez G, Torrontegi E, Vázquez‐Carrión J, Montalvo Z, et al. Reference power values for the jump squat exercise in elite athletes: A multicenter study. J Sports Sci 2020;38:2273–2278. - PubMed
-
- Foldvari M, Clark M, Laviolette LC, Bernstein MA, Kaliton D, Castaneda C, et al. Association of muscle power with functional status in community‐dwelling elderly women. J Gerontol A Biol Sci Med Sci 2000;55:M192–M199. - PubMed
-
- Alcazar J, Alegre LM, Suetta C, Júdice PB, Van Roie E, González‐Gross M, et al. Threshold of Relative Muscle Power Required to Rise from a Chair and Mobility Limitations and Disability in Older Adults. Med Sci Sports Exerc 2021;53:2217–2224. - PubMed
Publication types
MeSH terms
Substances
Grants and funding
LinkOut - more resources
Full Text Sources
Medical
