. 2023 Feb 14;14(1):7.
doi: 10.1186/s13229-022-00536-z.

CRISIS AFAR: an international collaborative study of the impact of the COVID-19 pandemic on mental health and service access in youth with autism and neurodevelopmental conditions

Bethany Vibert #  1 Patricia Segura #  1 Louise Gallagher  2 Stelios Georgiades  3 Panagiota Pervanidou  4 Audrey Thurm  5 Lindsay Alexander  6 Evdokia Anagnostou  7   8 Yuta Aoki  9 Catherine S Birken  10   11 Somer L Bishop  12 Jessica Boi  13 Carmela Bravaccio  14 Helena Brentani  15 Paola Canevini  16   17 Alessandra Carta  18 Alice Charach  19   20 Antonella Costantino  21 Katherine T Cost  19 Elaine A Cravo  22 Jennifer Crosbie  19   20 Chiara Davico  23 Federica Donno  13 Junya Fujino  24 Alessandra Gabellone  25 Cristiane T Geyer  22 Tomoya Hirota  26   27 Stephen Kanne  28 Makiko Kawashima  29 Elizabeth Kelley  30 Hosanna Kim  31 Young Shin Kim  31 So Hyun Kim  32 Daphne J Korczak  19   20 Meng-Chuan Lai  19   20   33   34   35 Lucia Margari  25 Lucia Marzulli  25 Gabriele Masi  36 Luigi Mazzone  37 Jane McGrath  2   38 Suneeta Monga  19   20 Paola Morosini  39 Shinichiro Nakajima  40 Antonio Narzisi  36 Rob Nicolson  41 Aki Nikolaidis  6 Yoshihiro Noda  40 Kerri Nowell  42 Miriam Polizzi  14 Joana Portolese  15 Maria Pia Riccio  14 Manabu Saito  27   43   44 Ida Schwartz  45 Anish K Simhal  1   46 Martina Siracusano  37 Stefano Sotgiu  18 Jacob Stroud  1 Fernando Sumiya  15 Yoshiyuki Tachibana  47 Nicole Takahashi  42 Riina Takahashi  29 Hiroki Tamon  47 Raffaella Tancredi  36 Benedetto Vitiello  23 Alessandro Zuddas  13   48 Bennett Leventhal  49 Kathleen Merikangas  50 Michael P Milham  6   51 Adriana Di Martino  52
Affiliations

CRISIS AFAR: an international collaborative study of the impact of the COVID-19 pandemic on mental health and service access in youth with autism and neurodevelopmental conditions

Bethany Vibert et al. Mol Autism. .

Abstract

Background: Heterogeneous mental health outcomes during the COVID-19 pandemic are documented in the general population. Such heterogeneity has not been systematically assessed in youth with autism spectrum disorder (ASD) and related neurodevelopmental disorders (NDD). To identify distinct patterns of the pandemic impact and their predictors in ASD/NDD youth, we focused on pandemic-related changes in symptoms and access to services.

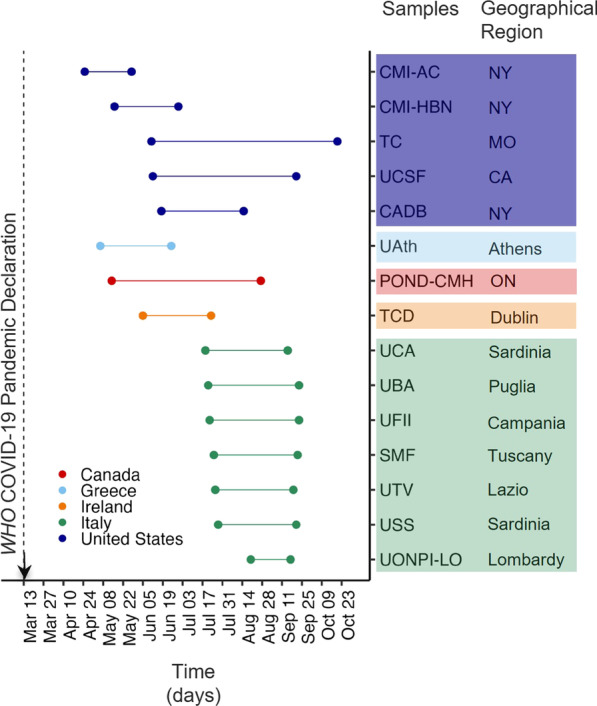
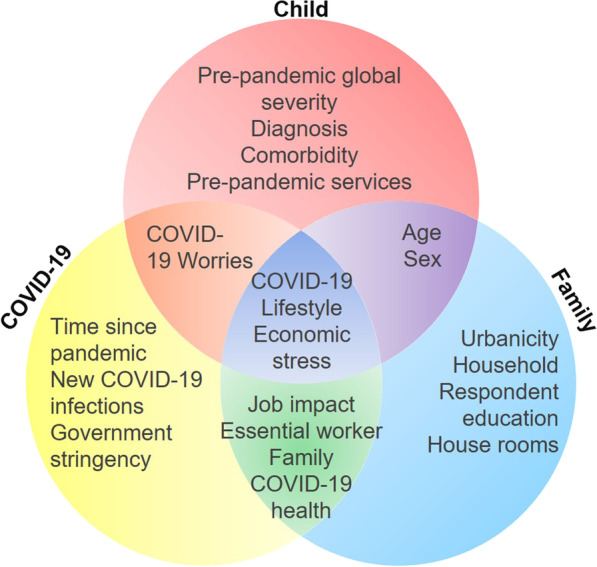
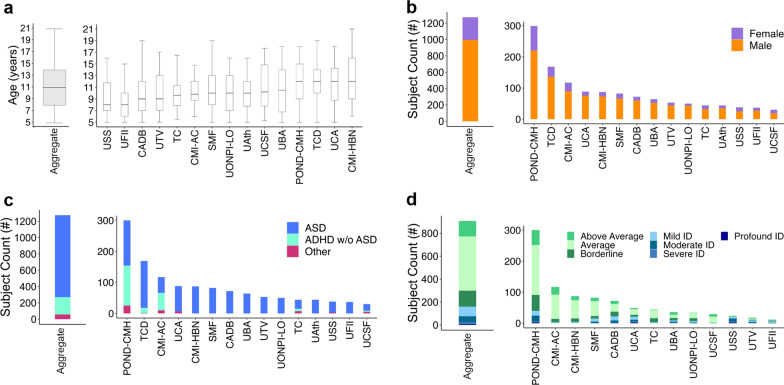
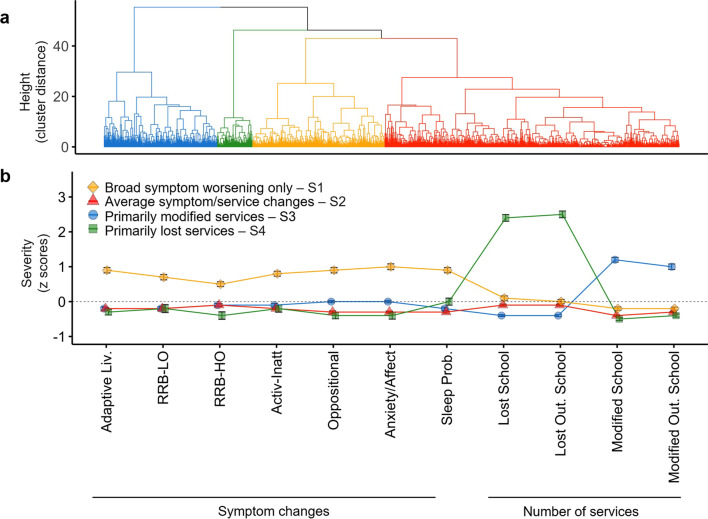
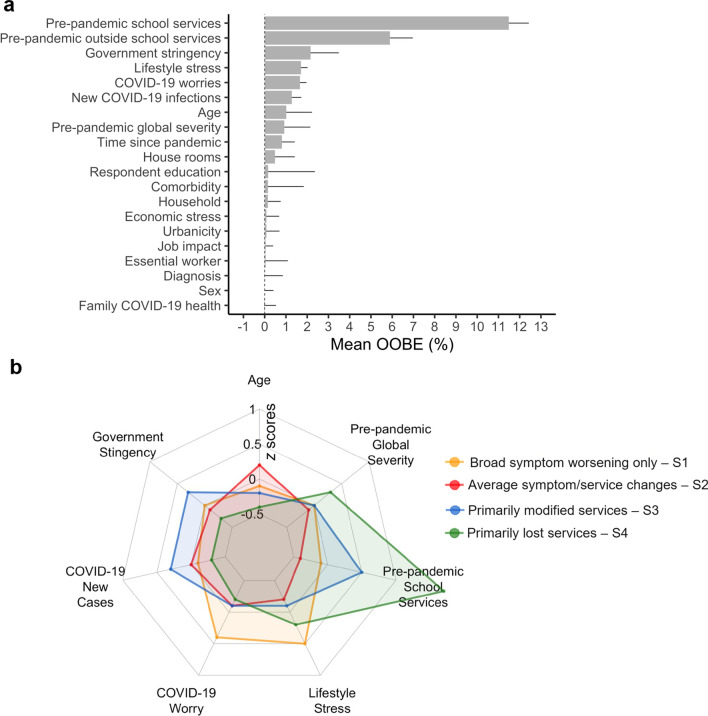
Methods: Using a naturalistic observational design, we assessed parent responses on the Coronavirus Health and Impact Survey Initiative (CRISIS) Adapted For Autism and Related neurodevelopmental conditions (AFAR). Cross-sectional AFAR data were aggregated across 14 European and North American sites yielding a clinically well-characterized sample of N = 1275 individuals with ASD/NDD (age = 11.0 ± 3.6 years; n females = 277). To identify subgroups with differential outcomes, we applied hierarchical clustering across eleven variables measuring changes in symptoms and access to services. Then, random forest classification assessed the importance of socio-demographics, pre-pandemic service rates, clinical severity of ASD-associated symptoms, and COVID-19 pandemic experiences/environments in predicting the outcome subgroups.

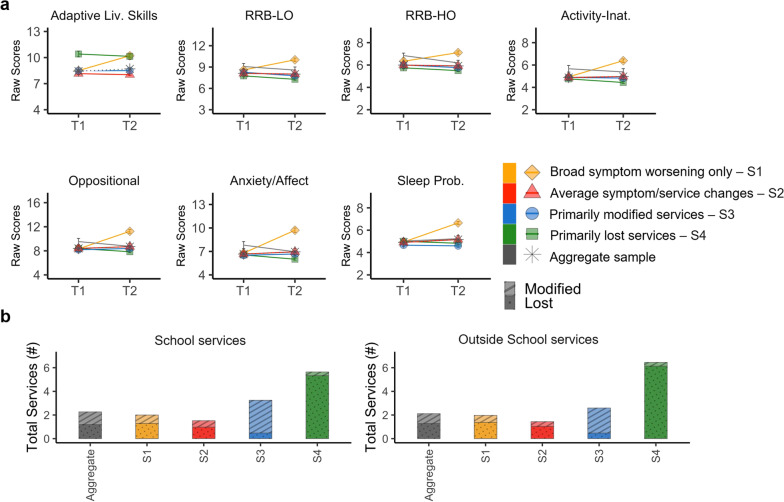
Results: Clustering revealed four subgroups. One subgroup-broad symptom worsening only (20%)-included youth with worsening across a range of symptoms but with service disruptions similar to the average of the aggregate sample. The other three subgroups were, relatively, clinically stable but differed in service access: primarily modified services (23%), primarily lost services (6%), and average services/symptom changes (53%). Distinct combinations of a set of pre-pandemic services, pandemic environment (e.g., COVID-19 new cases, restrictions), experiences (e.g., COVID-19 Worries), and age predicted each outcome subgroup.

Limitations: Notable limitations of the study are its cross-sectional nature and focus on the first six months of the pandemic.

Conclusions: Concomitantly assessing variation in changes of symptoms and service access during the first phase of the pandemic revealed differential outcome profiles in ASD/NDD youth. Subgroups were characterized by distinct prediction patterns across a set of pre- and pandemic-related experiences/contexts. Results may inform recovery efforts and preparedness in future crises; they also underscore the critical value of international data-sharing and collaborations to address the needs of those most vulnerable in times of crisis.

Keywords: Autism spectrum disorder; Behavioral problems; COVID-19 pandemic; Mental health outcomes; Neurodevelopmental conditions; Prediction; Public health; Risk and resilience factors; Sleep.


Conflict of interest statement

Dr. Bishop receives royalties for the sale of the ADOS-2 that she has co-authored. Royalties generated from any of their own research or clinical activities are donated to charity. Dr. Tancredi receives royalties for the sale of the Italian version of the ADOS-2. The other authors declare that they have no competing interests.

Figures

Fig. 1
Fig. 1
Data collection times across contributing samples. Data collection time periods for each contributing sample are color coded by country. Specific geographical regions for each sample are also indicated as state, or region. See Supplementary material in Additional file 1: Methods and Table S1 for details on data collection protocols. NY, New York; MO Missouri; CA California; ON Ontario; WHO World Health Organization
Fig. 2
Fig. 2
Features selected for predicting COVID-19 Impact Subgroups. The Venn diagram shows the 20 features examined as potential predictors of the four COVID-19 impact subgroups with random forest classification. Each feature is organized across three partially overlapping domains: child characteristics before the pandemic (red); COVID-19 pandemic experiences and environment (yellow); and family/household characteristics (blue)
Fig. 3
Fig. 3
Characteristics of aggregate and each contributing sample. Age distribution (box plots), proportion of males and females, primary diagnoses, and intellectual functioning (stacked bar plots) are depicted for each of the n = 15 contributing samples, as well as for the aggregate sample (i.e., the dataset resulting from combining all contributing samples). CMI-AC Child Mind Institute-Autism Center; CMI-HBN CMI Healthy Brain Network; TC Thompson Center; UCSF University of California San Francisco; CADB Center for Autism and Developing Brain, Weill Cornell Medical College/New York Presbyterian Hospital; UAth University of Athens, National & Kapodistrian University of Athens, School of Medicine, First Department of Pediatrics, Unit of Developmental and Behavioral Pediatrics. “Aghia Sophia” Children’s Hospital; POND-CMH Province of Ontario Neurodevelopmental Network, COVID Mental Health collaboration; TCD Trinity College Dublin; UCA University of Cagliari, Child & Adolescent Neuropsychiatry Unit, A.Cao Paediatric Hospital; UBA University Bari, Child Neuropsychiatry Unit, Policlinic of Bari; UFII University of Naples Federico II, Child and Adolescent Neuropsychiatry Unit; SMF Stella Maris Foundation, University of Pisa; UTV University Tor Vergata; USS University of Sassari, Child Neuropsychiatry Unit, Azienda Ospedaliero-Universitaria; UONPI-LO Unita' Operativa di Neuropsichiatria dell’ Infanzia e dell' adolescenza, Lodi; ASD Autism Spectrum Disorder, ADHD Attention-Deficit/Hyperactivity Disorder; and ID Intellectual Disability. See Table S1 and Methods in Additional file 1 for details on data collection protocols
Fig. 4
Fig. 4
Clustering results and COVID-19 Impact Subgroup Patterns. a The dendrogram shows the optimal 4-cluster solution of COVID-19 Impact including: broad symptom worsening only (n = 251; 20%, yellow), primarily modified services (n = 293; 23%, blue), primarily lost services (n = 78; 6%, green), and average symptom/service changes (n = 653; 53%, red). b Groups means and standard error bars of the z scored symptom factor changes (difference between Current and Prior scores; or Δ) and number of services lost or modified in and outside (Out.) of school are shown for each cluster (i.e., outcome subgroup). The dotted gray horizontal line at a z score 0 represents the average of the aggregate sample (N = 1275) across each variable examined. Abbreviations: Adaptive Liv., Adaptive Living skills; RRB-LO, Restricted and Repetitive Behaviors—Lower Order; RRB-HO, Restricted and Repetitive Behaviors—Higher Order; Activ-Inatt, Activity Inattention; Sleep Prob., Sleep Problems; Out., Outside; and Mod., Modified
Fig. 5
Fig. 5
Symptom and service access change pattern. a For each of the four outcome subgroups (color coded in the legend) and the aggregate sample (in gray), plots depict groups means and standard error bars of prior (T1) and current (T2) symptom raw scores across the seven factors examined. High scores indicate greater severity/impairment. The scores from the adaptive living skills domain were multiplied by minus 1 in order to follow the same direction as the other factors. b The bar height represents the mean total number of services received prior to the pandemic for each subgroup (color coded in the legend), as well as for the aggregate dataset (gray) at school (left plot), or outside school (right plot). The dotted pattern within each stacked bar illustrates the group mean number of services lost, the striped pattern depicts the group mean number of services modified
Fig. 6
Fig. 6
Random forest feature importance ranking and top-ranked features by subgroup. a Feature (predictor) ranking by importance indexed by mean out-of-bag errors (OOBEs) is shown in descendent order. b The radial plot shows the z-scored group means across the eight top-ranked predictors color coded by outcome subgroup (Yellow = broad symptom worsening only; Red = average symptom/service changes; Blue = primarily modified services; Green = primarily lost services)

References

    1. Unite Nations. Policy Brief: The Impact of COVID-19 on Children. UN; 2020.
    1. Nearchou F, Flinn C, Niland R, Subramaniam SS, Hennessy E. Exploring the impact of COVID-19 on mental health outcomes in children and adolescents: a systematic review. Int J Environ Res Public Health. 2020 doi: 10.3390/ijerph17228479. - DOI - PMC - PubMed
    1. Child Protection and COVID-19. Accessed November 3, 2022. https://alliancecpha.org/en/child-protection-and-covid-19.
    1. Panda PK, Gupta J, Chowdhury SR, et al. Psychological and behavioral impact of lockdown and quarantine measures for COVID-19 pandemic on children, adolescents and caregivers: a systematic review and meta-analysis. J Trop Pediatr. 2021 doi: 10.1093/tropej/fmaa122. - DOI - PMC - PubMed
    1. World Health Organization. The international statistical classification of diseases and health related problems ICD-10: tenth revision. Volume 2: Instruction Manual. World Health Organization; 2004.

Publication types