. 2023 Feb 14;5(1):12.
doi: 10.1186/s42523-023-00233-z.

Host metabolome and faecal microbiome shows potential interactions impacted by age and weaning times in calves

Affiliations

Host metabolome and faecal microbiome shows potential interactions impacted by age and weaning times in calves

Nida Amin et al. Anim Microbiome. .

Abstract

Background: Calves undergo nutritional, metabolic, and behavioural changes from birth to the entire weaning period. An appropriate selection of weaning age is essential to reduce the negative effects caused by weaning-related dietary transitions. This study monitored the faecal microbiome and plasma metabolome of 59 female Holstein calves during different developmental stages and weaning times (early vs. late) and identified the potential associations of the measured parameters over an experimental period of 140 days.

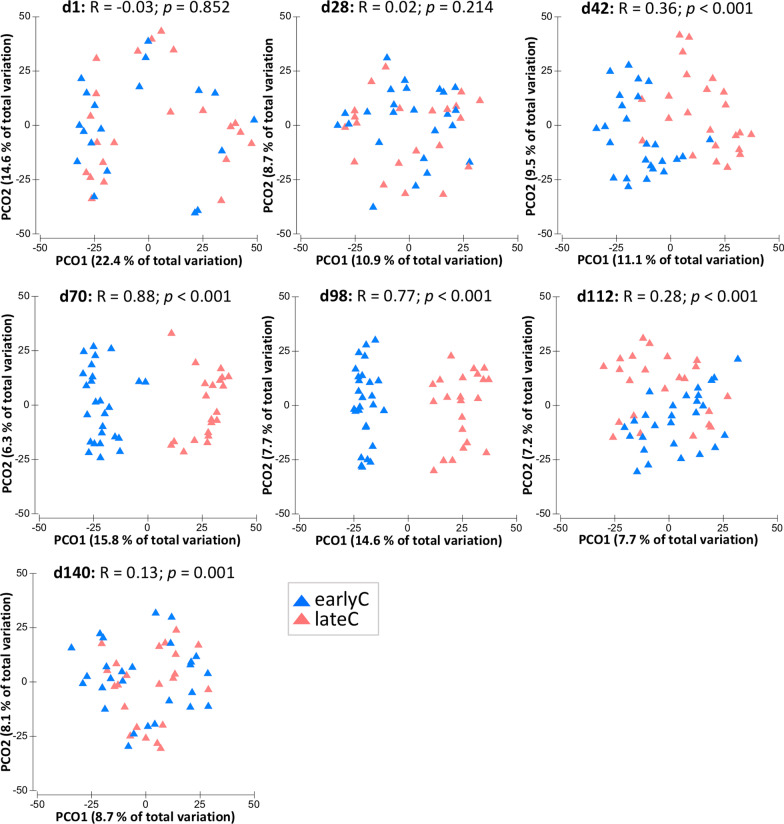
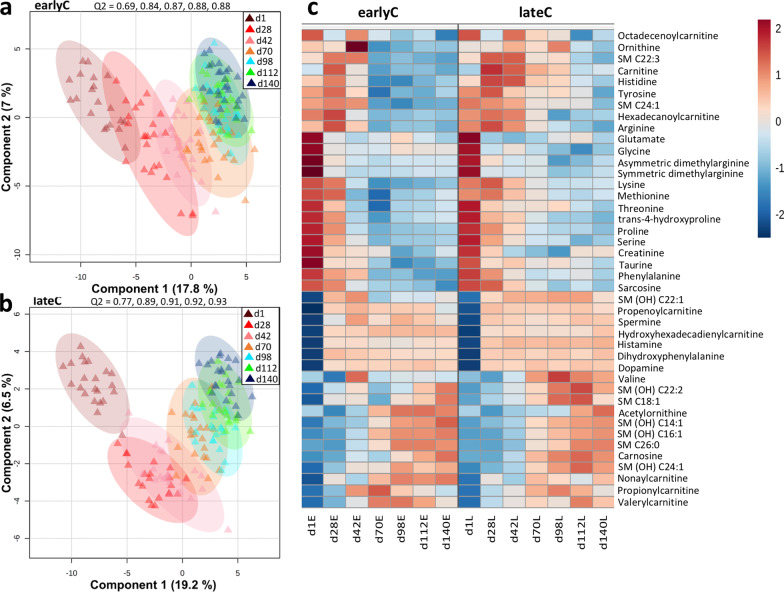
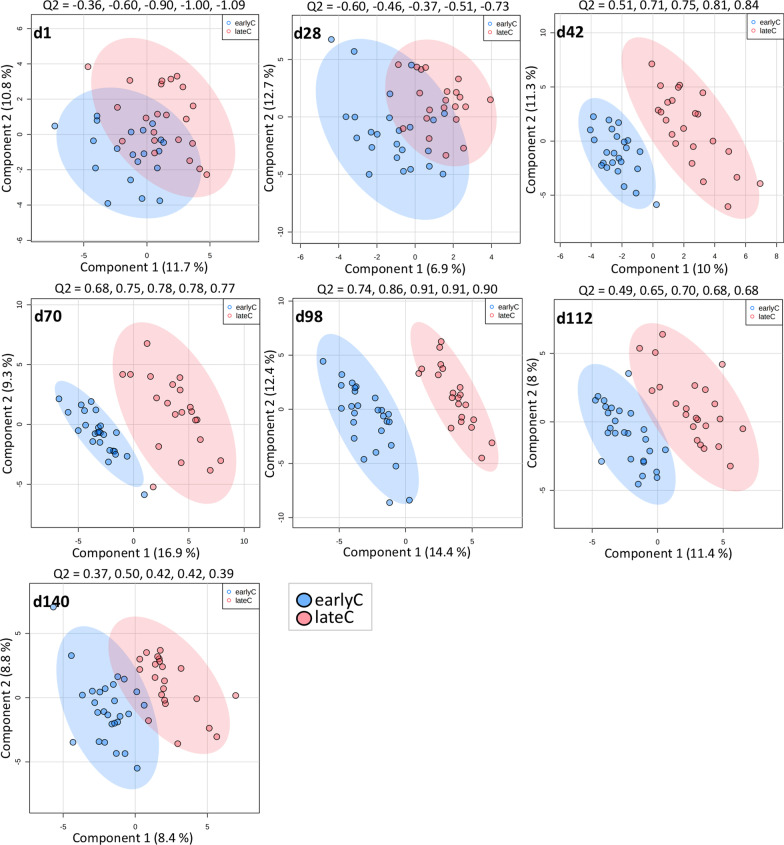
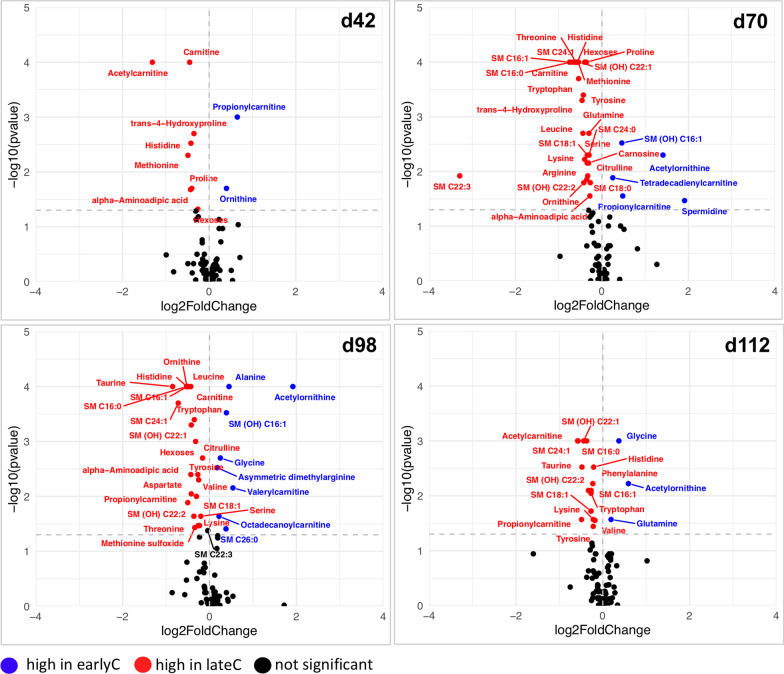
Results: A progressive development of the microbiome and metabolome was observed with significant differences according to the weaning groups (weaned at 7 or 17 weeks of age). Faecal samples of young calves were dominated by bifidobacterial and lactobacilli species, while their respective plasma samples showed high concentrations of amino acids (AAs) and biogenic amines (BAs). However, as the calves matured, the abundances of potential fiber-degrading bacteria and the plasma concentrations of sphingomyelins (SMs), few BAs and acylcarnitines (ACs) were increased. Early-weaning at 7 weeks significantly restructured the microbiome towards potential fiber-degrading bacteria and decreased plasma concentrations of most of the AAs and SMs, few BAs and ACs compared to the late-weaning event. Strong associations between faecal microbes, plasma metabolites and calf growth parameters were observed during days 42-98, where the abundances of Bacteroides, Parabacteroides, and Blautia were positively correlated with the plasma concentrations of AAs, BAs and SMs as well as the live weight gain or average daily gain in calves.

Conclusion: The present study reported that weaning at 17 weeks of age was beneficial due to higher growth rate of late-weaned calves during days 42-98 and a quick adaptability of microbiota to weaning-related dietary changes during day 112, suggesting an age-dependent maturation of the gastrointestinal tract. However, the respective plasma samples of late-weaned calves contained several metabolites with differential concentrations to the early-weaned group, suggesting a less abrupt but more-persistent effect of dietary changes on host metabolome compared to the microbiome.

Keywords: Age; Calves; Faeces; Microbiome; Plasma metabolites; Weaning time.


Conflict of interest statement

The authors declare that they have no competing interests.

Figures

Fig. 1
Fig. 1
Age-dependent changes in the faecal bacterial communities of earlyC and lateC calves. a, b Bacterial compositional profiles of different age group earlyC (n = 176) and lateC (n = 154) faecal samples based on ASVs visualized using principal-coordinate analysis plots. Each triangle indicates one sample. c Heatmap based on bacterial taxa with significantly different relative abundance (p < 0.05; Kruskal–Wallis test). Each day represents an average value for animals: d1 (20 & 22), d28 (24 & 21), d42 (25 & 23), d70 (26 & 21), d98 (27 & 22), d112 (27 & 23), and d140 (27 & 22) animals for earlyC and lateC groups, respectively. EarlyC group was weaned during experimental days 28–42 and lateC during experimental days 98–112
Fig. 2
Fig. 2
Principal-coordinate analysis plots showing changes in bacterial compositional profiles of faecal samples due to weaning event. Each triangle indicates one sample. The significant differences between same-age-old weaning groups, separated based on PCO analysis, were confirmed using analysis of similarities test (ANOSIM), with R- and p values indicated
Fig. 3
Fig. 3
Changes in faecal bacterial communities of calves due to weaning event. Significantly different bacterial genera with relative abundance (≥ 1%) and p  ≤ 0.05 (Kruskal–Wallis test) among same-age old weaning groups are shown. Each bar represents an average value for animals: d42 (25 & 23), d70 (26 & 21), d98 (27 & 22) animals for earlyC and lateC groups, respectively
Fig. 4
Fig. 4
Age-dependent changes in plasma metabolites concentrations of earlyC and lateC calves. a, b Metabolic profiles of different age group earlyC (n = 174) and lateC (n = 153) plasma samples visualized using PLS-DA score plots. Each shape indicates one sample coloured according to the age group with ellipse indicating the 95% confidence region. c Heatmap of the significantly altered metabolites due to calves age (VIP > 1, FDR < 0.001, ANOVA). Each day represents an average concentration of metabolites for animals: d1 (20 & 22), d28 (24 & 21), d42 (24 & 23), d70 (25 & 21), d98 (27 & 21), d112 (27 & 23), and d140 (27 & 22) animals for earlyC and lateC groups, respectively
Fig. 5
Fig. 5
Partial least squares-discriminate analysis for identification of metabolic differences among weaning groups. Each circle indicates one sample and ellipse indicating the 95% confidence region. The quality of the models was assessed using Q2 as performance measure and tenfold cross-validation method. The Q2 values for the first 5 components are shown
Fig. 6
Fig. 6
Volcano plots of the weaning-dependent changes in the plasma metabolic profiles of weaning groups. The identification of significantly altered metabolites due to weaning event within each age group was based on a VIP > 1, FDR < 0.05 (t-test) and log2 FC > 0.1 or < − 0.1. Each circle indicates one metabolite
Fig. 7
Fig. 7
Heatmaps showing the Spearman’s rank correlations between differentially abundant faecal microbial genera and plasma metabolites of weaning groups. Colours indicates the correlation between microbiome and metabolome (blue: significant positive, red: significant negative, and white: non-significant). Only Spearman correlation coefficients with p < 0.05 are shown. Abbreviations (ACs, AAs, BAs and SMs) indicates following metabolites classes: acylcarnitines, amino acids, biogenic amines, and sphingomyelins respectively

Similar articles

Cited by

References

    1. Davis CL, Drackley JK. The development, nutrition, and management of the young calf. 1. Ames: Iowa State University Press; 1998.
    1. Kenéz Á, Koch C, Korst M, Kesser J, Eder K, Sauerwein H, et al. Different milk feeding intensities during the first 4 weeks of rearing dairy calves: part 3: plasma metabolomics analysis reveals long-term metabolic imprinting in Holstein heifers. J Dairy Sci. 2018;101(9):8446–60. doi: 10.3168/jds.2018-14559. - DOI - PubMed
    1. Amin N, Seifert J. Dynamic progression of the calf’s microbiome and its influence on host health. Comput Struct Biotechnol J. 2021;19:989–1001. doi: 10.1016/j.csbj.2021.01.035. - DOI - PMC - PubMed
    1. Tourneur E, Chassin C. Neonatal immune adaptation of the gut and its role during infections. Clin Dev Immunol. 2013;2013:270301. doi: 10.1155/2013/270301. - DOI - PMC - PubMed
    1. Sommer F, Bäckhed F. The gut microbiota—masters of host development and physiology. Nat Rev Microbiol. 2013;11(4):227–38. doi: 10.1038/nrmicro2974. - DOI - PubMed

LinkOut - more resources