

Spectral Changes of EEG Following a 6-Week Low-Dose Oral Ketamine Treatment in Adults With Major Depressive Disorder and Chronic Suicidality
- PMID: 36789509
- PMCID: PMC10109122
- DOI: 10.1093/ijnp/pyad006
Spectral Changes of EEG Following a 6-Week Low-Dose Oral Ketamine Treatment in Adults With Major Depressive Disorder and Chronic Suicidality
Abstract
Background: Ketamine has considerable therapeutic potential in alleviating major depressive disorder and chronic suicidality. However, the clinical diagnosis of neuropsychiatric disorders requires more robust diagnostic criteria. Electroencephalography (EEG) has shown promise in classifying depressive and suicidal patients from healthy individuals. The present study aimed to identify changes in the spectral properties of EEG in patients with major depressive disorder and chronic suicidality after completing the 6-week Oral Ketamine Trial on Suicidality with follow-up occurring 4 weeks after final ketamine treatment and determine associations between EEG spectral output and clinical symptoms.
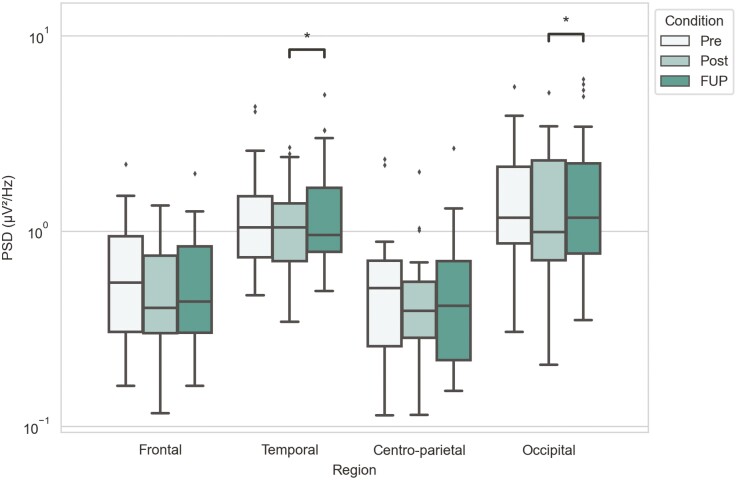
Methods: Participants (n = 25) had 4-minute eyes closed resting state EEG recorded at frontal, temporal, centro-parietal, and occipital regions. Spectral analysis was performed with Welch's power spectrum density method, and the power of 4 distinct frequency bands was analyzed: theta, alpha, low-beta, and high-beta. Correlation analyses between changes in clinical symptoms and spectral power were conducted using Spearman's ranked correlation.
Results: Between pre- and posttreatment, only centro-parietal alpha power decreased. Between posttreatment and follow-up, centro-parietal alpha increased again in addition to increases in temporal alpha, centro-parietal and temporal theta, and occipital low-beta and decreases in occipital theta and temporal low-beta. Additionally, the decrease of occipital theta positively correlated with clinical subscales for depression and stress.
Conclusions: EEG spectral analysis revealed significant changes in theta, alpha, and low-beta frequency bands. Alpha band showed initial changes after treatment; however, this trended back toward baseline levels after the treatment cessation. In contrast, theta and low-beta showed significant power changes only after the treatment had ended.
Keywords: EEG; depression; ketamine; spectral analysis; suicidality.
© The Author(s) 2023. Published by Oxford University Press on behalf of CINP.
Figures


References
-
- Abhang PA, Gawali BW, Mehrotra SC (2016) Introduction to EEG- and speech-based emotion recognition. London, UK; San Diego, CA, USA: Elsevier/Academic Press.
-
- Anijärv TE (2022) EEG-pyline: EEG pipeline in Python. 10.5281/zenodo.7444821. Accessed December 21, 2022. - DOI
-
- Biasiucci A, Franceschiello B, Murray MM (2019) Electroencephalography. Curr Biol 29:R80–R85. - PubMed
Publication types
MeSH terms
Substances
LinkOut - more resources
Full Text Sources
Medical
