

Perceived Hospital Stress, Severe Acute Respiratory Syndrome Coronavirus 2 Activity, and Care Process Temporal Variance During the COVID-19 Pandemic
- PMID: 36790189
- PMCID: PMC10012837
- DOI: 10.1097/CCM.0000000000005802
Perceived Hospital Stress, Severe Acute Respiratory Syndrome Coronavirus 2 Activity, and Care Process Temporal Variance During the COVID-19 Pandemic
Abstract
Objectives: The COVID-19 pandemic threatened standard hospital operations. We sought to understand how this stress was perceived and manifested within individual hospitals and in relation to local viral activity.
Design: Prospective weekly hospital stress survey, November 2020-June 2022.
Setting: Society of Critical Care Medicine's Discovery Severe Acute Respiratory Infection-Preparedness multicenter cohort study.
Subjects: Thirteen hospitals across seven U.S. health systems.
Interventions: None.
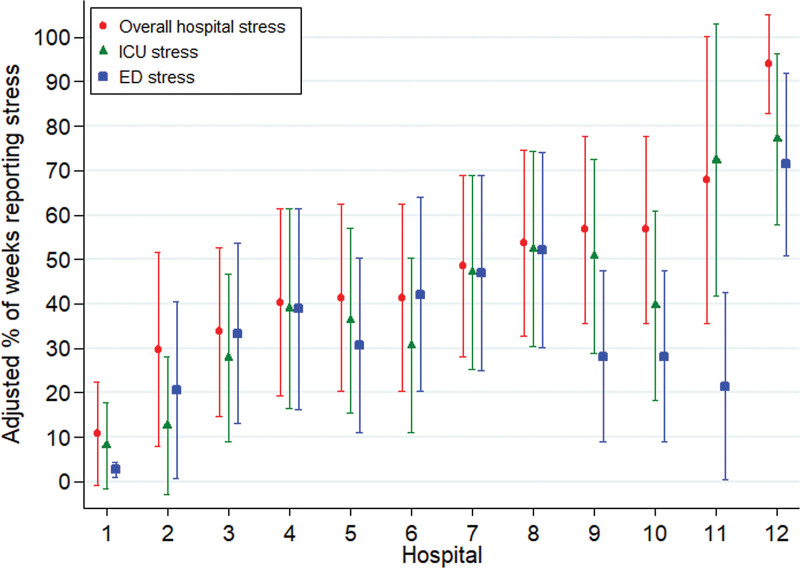
Measurements and main results: We analyzed 839 hospital-weeks of data over 85 pandemic weeks and five viral surges. Perceived overall hospital, ICU, and emergency department (ED) stress due to severe acute respiratory infection patients during the pandemic were reported by a mean of 43% ( sd , 36%), 32% (30%), and 14% (22%) of hospitals per week, respectively, and perceived care deviations in a mean of 36% (33%). Overall hospital stress was highly correlated with ICU stress (ρ = 0.82; p < 0.0001) but only moderately correlated with ED stress (ρ = 0.52; p < 0.0001). A county increase in 10 severe acute respiratory syndrome coronavirus 2 cases per 100,000 residents was associated with an increase in the odds of overall hospital, ICU, and ED stress by 9% (95% CI, 5-12%), 7% (3-10%), and 4% (2-6%), respectively. During the Delta variant surge, overall hospital stress persisted for a median of 11.5 weeks (interquartile range, 9-14 wk) after local case peak. ICU stress had a similar pattern of resolution (median 11 wk [6-14 wk] after local case peak; p = 0.59) while the resolution of ED stress (median 6 wk [5-6 wk] after local case peak; p = 0.003) was earlier. There was a similar but attenuated pattern during the Omicron BA.1 subvariant surge.
Conclusions: During the COVID-19 pandemic, perceived care deviations were common and potentially avoidable patient harm was rare. Perceived hospital stress persisted for weeks after surges peaked.
Copyright © 2023 The Author(s). Published by Wolters Kluwer Health, Inc. on behalf of the Society of Critical Care Medicine and Wolters Kluwer Health, Inc.
Conflict of interest statement
Dr. Anesi received funding from the National Institutes of Health (NIH) (K23HL161353), UptoDate, and expert witness consulting. Drs. Anesi and Segal received support for article research from the NIH. Drs. Bhatraju’s, Brett-Major’s, Broadhurst’s, Cobb’s, Kratochvil’s, Kumar’s, Landsittel’s, Lieber’s, Lutrick’s, Sevransky’s, Wurfel’s, Wyles’, and Evans’, and Mr. Gonzalez’s institutions received funding from the Centers for Disease Control and Prevention (CDC) Foundation. Dr. Bhatraju received funding from the NIH (K23DK116967). Drs. Bhatraju, Cobb, Kratochvil, Landsittel, Rodina, Segal, and Evans received support for article research from the CDC Foundation. Dr. Cobb received funding from Akido Labs, BauHealth, and GibLib. Dr. Kumar received funding from Janssen R&D LLC and the Assistant Secretary for Planning and Evaluation Food and Drug Administration. Dr. Liebler received funding from Immunexpress. Dr. Sevransky’s institution received funding from Regeneron Pharmaceuticals, the Department of Health and Human Services, the Department of Defense, and Society of Critical Care Medicine. Dr. Uyeki disclosed government work. Dr. Wyles’ institution received funding from Gilead Sciences. Dr. Evans disclosed that she serves on the Council of the Society of Critical Care Medicine. The remaining authors have disclosed that they do not have any potential conflicts of interest.
Figures


Comment in
-
Surprisingly Few Avoidable Harms From Pandemic Strain in Multihospital U.S. Survey: Resilient Hospitals or Respondent Bias?Crit Care Med. 2023 Apr 1;51(4):543-545. doi: 10.1097/CCM.0000000000005810. Epub 2023 Mar 18. Crit Care Med. 2023. PMID: 36928013 No abstract available.
References
Publication types
MeSH terms
Supplementary concepts
Grants and funding
LinkOut - more resources
Full Text Sources
Medical
